Werner Enterprises, Inc.

Werner Enterprises, Inc. (WERN) Market Cap

Werner Enterprises, Inc. has a market capitalization of $2.24B.

Price: $37.42

0.54 (1.46%)

Market Cap: 2.24B

NASDAQ · time unavailable

CEO: Derek J. Leathers

Sector: Industrials

Industry: Trucking

IPO Date: 1986-06-20

Website: https://www.werner.com

Werner Enterprises, Inc. (WERN) - Company Information

Market Cap: 2.24B|Sector: Industrials

Company Profile

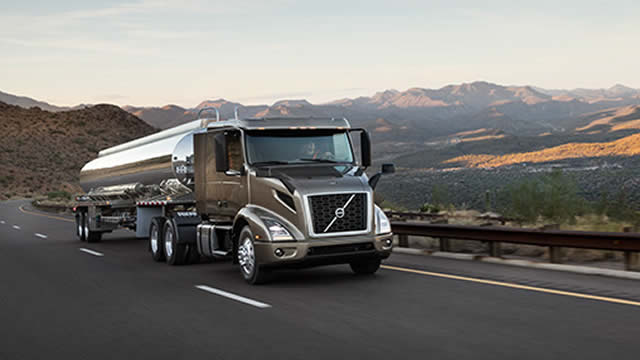
Werner Enterprises, Inc. is a prominent transportation and logistics company that specializes in the movement of full truckload shipments for a wide range of goods. Operating both domestically across U.S. states and internationally, including Mexico, the company provides crucial shipping services. Its operations are structured into two main divisions: Truckload Transportation Services and Werner Logistics. The Truckload Transportation Services segment manages several specialized fleets. This includes a medium-to-long-haul van fleet, which transports various everyday consumer products and general commodities in dry van trailers. For time-sensitive deliveries, an expedited fleet utilizes driver teams to ensure quick transit. A regional short-haul fleet provides comparable van services for shorter distances, while a temperature-controlled fleet is equipped to handle products requiring specific environmental conditions, such as food, beverages, and other perishables. This segment regularly transports items like retail merchandise and manufactured goods. The Werner Logistics segment offers comprehensive, non-asset-based solutions, encompassing services like truck brokerage, full-service logistics management, and facilitating rail transportation through strategic partnerships with rail and drayage providers. Additionally, it provides specialized residential and commercial delivery services for oversized or heavy items, often utilizing liftgate straight trucks for efficient handling. By the close of 2021, Werner commanded a substantial fleet that included 8,340 trucks (with 8,050 company-operated and 290 managed by independent contractors) and 27,225 company-owned trailers, a mix of dry vans, flatbeds, and temperature-controlled units. The company also operated 55 intermodal drayage trucks. Werner Enterprises, Inc. was established in 1956 and maintains its corporate headquarters in Omaha, Nebraska.

Analyst Sentiment

53%
Hold

From 19 Active Polls

1Y Forecast: $43.56

▲ +16.4% Potential Upside

Consensus Target Metrics

Low Bound

$29

Median

$43

High Bound

$55

Average

$44

Price & Moving Averages

Loading chart...

🎯 Wall Street Analyst Intelligence Report

1-Year structural target targets, chart projections, and sentiment maps.

Average 1Y Target
$43.56
▲ +16.41% Upside
Low Target
$29.00
-23% Risk
Median Target
$43.00
15% Mid
High Target
$55.00
47% Max
Consensus
Hold
12 / 36 Buys

Consensus Trend Projection

Trailing closures vs. 12-month metrics map.

Analyst Vote Distribution

Aggregate institutional coverage sentiment weights.

📊 Historical Valuation Multiples

Real-time Trailing Twelve Month (TTM) momentum side-by-side with discrete quarterly metrics.

Fiscal QuarterTTMQ2 2026Q1 2026Q4 2025Q3 2025Q2 2025Q1 2025Q4 2024Q3 2024
Period EndingTrailing 12MJun 30, 2026Mar 31, 2026Dec 31, 2025Sep 30, 2025Jun 30, 2025Mar 31, 2025Dec 31, 2024Sep 30, 2024
Market Cap ($M)2,2432,6251,7631,7971,6061,6841,8132,2412,385
Enterprise Value ($M)2,3352,7172,7432,5312,3232,4042,4502,9023,064
Price to Earnings Ratio (P/E)-48.53109.02-103.41-16.31-19.359.50-45.7847.2687.70
Price/Earnings-to-Growth Ratio (PEG)7.03-10.75-7.941.6539.26
Price to Sales Ratio (P/S)0.692.812.182.442.082.242.552.973.20
Price to Book Ratio (P/B)1.661.941.301.321.151.181.261.541.65
Price to Free Cash Flow Ratio (P/FCF)-51.3057.50-76.39-187.72-39.78309.61-229.43-32.49
Enterprise Value to Sales (EV/Sales)2.913.393.433.013.193.443.844.11
Enterprise Value to EBITDA (EV/EBITDA)8.4928.9033.4964.9338.5817.2737.0230.3833.58
Debt to Equity Ratio0.330.110.770.580.550.540.480.480.51

📘 Full Research Report

ℹ️

AI-Generated Research: This report is for informational purposes only.

📘 WERNER ENTERPRISES INC (WERN) — Investment Overview

🧩 Business Model Overview

Werner operates as a transportation services provider in North America, primarily serving shippers that need reliable movement of goods across the network. The value chain centers on (1) acquiring and maintaining transportation capacity (drivers, tractors, and intermodal relationships), (2) matching freight demand with that capacity through dispatch and routing systems, and (3) delivering service outcomes that reduce shipper friction (on-time performance, safety, claims management, and operational predictability).

In truckload operations, Werner purchases labor and equipment capacity and sells transportation “space” to shippers via contractual terms and spot opportunities. In intermodal, Werner coordinates rail-based transport plus trucking “last-mile” components, monetizing its ability to convert rail capacity and location timing into a dependable, door-to-door service.

💰 Revenue Streams & Monetisation Model

  • Truckload revenue (transactional, volume- and lane-driven): revenue scales with freight ton-miles, effective rates, and asset utilization. Margin is influenced by the operating environment and Werner’s ability to manage empty miles, optimize routing, and maintain disciplined capacity.
  • Intermodal revenue (transactional, network- and mix-driven): monetization comes from contracted and negotiated pricing for rail/truck combined movements. Profitability depends on rail cycle reliability, terminal throughput, and Werner’s ability to secure consistent linehaul/terminal match quality.
  • Logistics services (more relationship-driven): where applicable, Werner can earn revenue by arranging transportation and managing parts of the shipment lifecycle, typically with less direct exposure to owning capacity and more emphasis on customer retention and service execution.

Overall, Werner’s margin structure is best understood through operating efficiency rather than simple pricing power. Key drivers include fuel and wage costs, linehaul productivity, equipment utilization, empty repositioning, and claims frequency/severity.

🧠 Competitive Advantages & Market Positioning

Werner’s most durable moat is a combination of switching costs and operational scale that compounds service reliability over time.

  • Switching costs (service reliability and integration): enterprise shippers build operational routines around a carrier’s routing, billing/visibility workflow, and performance metrics. Once a carrier demonstrates consistent execution, replacing it can increase operational risk and administrative burden—especially when lanes require specialized scheduling and dependable capacity.
  • Network density and capacity management: larger carriers can better balance supply (drivers/equipment and intermodal availability) with demand (shipper freight patterns). This improves pricing resilience by lowering the cost of repositioning and reducing time spent in underutilized positions.
  • Safety and compliance execution: maintaining strong safety performance and claims management reduces chargebacks and improves win rates in regulated procurement processes.
  • Intermodal know-how and execution: Werner’s intermodal capabilities reflect competence in converting rail and drayage constraints into dependable service, which is operationally harder than it appears due to handoffs and cycle timing.

Competitive benchmarking: Werner competes primarily with carriers such as J.B. Hunt, Knight-Swift, and Schneider National.

  • J.B. Hunt and Knight-Swift also operate at scale across truckload and intermodal, competing on network breadth and service performance.
  • Schneider National competes heavily in truckload and intermodal/asset-backed services, with a focus on operational reliability.

Werner’s positioning emphasizes disciplined truckload execution and intermodal participation with a focus on translating network and service quality into repeat business. The competitive difference tends to be less about “branding” and more about lane-level execution, capacity discipline, and the ability to manage costs through different freight cycles.

🚀 Multi-Year Growth Drivers

  • Outsourcing of transportation: Shippers continue to prefer specialist carriers that can provide capacity flexibility, service accountability, and operational technology rather than operating fragmented internal fleets.
  • Intermodal growth as a cost-and-sustainability strategy: Rail’s ability to move long-haul volumes efficiently supports trucking cost optimization and network emissions targets, sustaining intermodal adoption where infrastructure and service reliability meet shipper needs.
  • E-commerce and supply chain complexity: Higher shipment fragmentation increases the value of reliable network execution and predictable pickup/delivery windows, benefiting carriers with strong dispatch and claims performance.
  • Industry labor and driver availability constraints: Continued driver shortages elevate the importance of recruiting, retention, and productivity systems—advantages that scale with carrier operational excellence.
  • Technology and data-driven dispatch: Better load planning, route optimization, and visibility improve asset utilization and reduce cost-to-serve, supporting margin resilience even when pricing becomes cyclical.

⚠ Risk Factors to Monitor

  • Freight-cycle volatility: Truckload and intermodal volumes and pricing typically fluctuate with economic activity, creating earnings volatility even for well-run carriers.
  • Cost inflation and pass-through limits: Diesel, wages, insurance, and maintenance costs can rise faster than contract pricing, compressing margins.
  • Fuel price sensitivity: Even with fuel surcharges, lag effects and mix impacts can affect profitability.
  • Regulatory and compliance changes: Hours-of-service rules, safety enforcement intensity, and environmental regulations can raise operating costs or constrain capacity.
  • Intermodal execution risks: Rail service reliability, terminal constraints, and drayage availability can disrupt handoffs and degrade service performance.
  • Capital intensity in asset-heavy operations: Fleet renewal, equipment availability, and residual values can influence free cash flow through the cycle.

📊 Valuation & Market View

Transportation carriers are typically valued using EV/EBITDA-type frameworks and earnings power measures, but investors usually underwrite more directly through operating ratio quality, cash generation, and cycle-through performance rather than a single headline multiple. Key valuation drivers include:

  • Evidence of cost discipline: sustained ability to manage wage, fuel, and maintenance costs relative to revenue.
  • Utilization and mix improvement: fewer empty miles, better equipment turns, and improved lane productivity.
  • Capital return capacity: free cash flow conversion through freight downturns supports balance sheet strength and fleet investment without excessive dilution.
  • Service outcomes: lower claims and stronger safety metrics improve win rates and reduce leakage in earnings.

Because the industry is cyclical, market pricing often reflects expectations for normalization of demand and cost levels, as well as confidence in management’s ability to avoid “overcapacity” during up-cycles.

🔍 Investment Takeaway

Werner Enterprises fits an evergreen investment profile built on operational scale and customer stickiness in truckload and intermodal transportation. The principal long-term thesis is that disciplined cost execution, network density, safety/compliance performance, and intermodal execution create compounding switching costs for shippers and improve resilience across freight cycles. The core challenge is underwriting cyclicality and cost volatility—addressed through close monitoring of utilization, operating efficiency, and cash generation through downturns.


⚠ AI-generated — informational only. Validate using filings before investing.
📰 Market News & Coverage

15 Stories Available

Real-time institutional reporting and market updates for WERN.

zacks.com2026-07-31

Here's Why Werner (WERN) Is a Great 'Buy the Bottom' Stock Now

After losing some value lately, a hammer chart pattern has been formed for Werner (WERN), indicating that the stock has found support. This, combined with an upward trend in earnings estimate revisions, could lead to a trend reversal for the stock in the near term.

zacks.com2026-07-31

After Plunging 14.6% in 4 Weeks, Here's Why the Trend Might Reverse for Werner (WERN)

The heavy selling pressure might have exhausted for Werner (WERN) as it is technically in oversold territory now. In addition to this technical measure, strong agreement among Wall Street analysts in revising earnings estimates higher indicates that the stock is ripe for a trend reversal.

defenseworld.net2026-07-31

Arrowstreet Capital Limited Partnership Buys 186,631 Shares of Werner Enterprises, Inc. $WERN

Arrowstreet Capital Limited Partnership boosted its stake in shares of Werner Enterprises, Inc. (NASDAQ: WERN) by 57.6% in the undefined quarter, according to the company in its most recent 13F filing with the Securities and Exchange Commission (SEC). The fund owned 510,847 shares of the transportation company's stock after purchasing an additional 186,631

zacks.com2026-07-30

After Plunging 16.4% in 4 Weeks, Here's Why the Trend Might Reverse for Werner (WERN)

The heavy selling pressure might have exhausted for Werner (WERN) as it is technically in oversold territory now. In addition to this technical measure, strong agreement among Wall Street analysts in revising earnings estimates higher indicates that the stock is ripe for a trend reversal.

247wallst.com2026-07-30

Here Are Wednesday’s Top Wall Street Analyst Research Calls: Bloom Energy, Dave, Fiverr, Humana, Las Vegas Sands, Lemonade, Procter & Gamble, SK hynix, Wix.com, and More

Wall Street analysts reshuffled their bets on Thursday as geopolitical fires, a Fed dissent surprise, and a brutal semiconductor selloff forced some major rating reversals across insurance, gaming, tech, and energy stocks.

defenseworld.net2026-07-30

Fifth Third Bancorp Acquires 15,755 Shares of Werner Enterprises, Inc. $WERN

Fifth Third Bancorp grew its stake in Werner Enterprises, Inc. (NASDAQ: WERN) by 11,500.0% during the first quarter, according to the company in its most recent filing with the Securities and Exchange Commission. The firm owned 15,892 shares of the transportation company's stock after purchasing an additional 15,755 shares during the quarter. Fifth

zacks.com2026-07-29

Werner Q2 Earnings Meet Estimates as TTS Margins Improve

WERN's second-quarter 2026 revenues benefit from growth in its Truckload Transportation Services segment, partially offset by a decline in the Logistics segment.

zacks.com2026-07-29

Why Werner Enterprises (WERN) is a Top Value Stock for the Long-Term

Wondering how to pick strong, market-beating stocks for your investment portfolio? Look no further than the Zacks Style Scores.

defenseworld.net2026-07-29

Dimensional Fund Advisors LP Increases Stake in Werner Enterprises, Inc. $WERN

Dimensional Fund Advisors LP grew its holdings in shares of Werner Enterprises, Inc. (NASDAQ: WERN) by 4.1% during the undefined quarter, according to the company in its most recent 13F filing with the Securities and Exchange Commission. The fund owned 3,794,752 shares of the transportation company's stock after purchasing an additional 148,826 shares

seekingalpha.com2026-07-28

Werner Enterprises, Inc. (WERN) Q2 2026 Earnings Call Transcript

Werner Enterprises, Inc. (WERN) Q2 2026 Earnings Call Transcript

marketbeat.com2026-07-28

Werner Enterprises Q2 Earnings Call Highlights

Werner Enterprises NASDAQ: WERN reported second-quarter revenue growth of 24% as its One-Way restructuring, the addition of FirstFleet and improved safety performance lifted profitability amid a tightening truckload market.

zacks.com2026-07-28

Werner (WERN) Reports Q2 Earnings: What Key Metrics Have to Say

Although the revenue and EPS for Werner (WERN) give a sense of how its business performed in the quarter ended June 2026, it might be worth considering how some key metrics compare with Wall Street estimates and the year-ago numbers.

zacks.com2026-07-28

Werner Enterprises (WERN) Q2 Earnings Match Estimates

Werner Enterprises (WERN) came out with quarterly earnings of $0.22 per share, in line with the Zacks Consensus Estimate . This compares to earnings of $0.11 per share a year ago.

businesswire.com2026-07-28

Werner Enterprises Reports Second Quarter 2026 Results

OMAHA, Neb.--(BUSINESS WIRE)--Werner Enterprises, Inc. (Nasdaq: WERN), a premier transportation and logistics provider, today reported results for the second quarter ended June 30, 2026. "Werner's strong second-quarter results reflect the strategic efforts implemented over the last few quarters and our decisive actions to adapt to a capacity tightening market," said Chairman and CEO Derek Leathers. "Our organic Dedicated business is growing, and the FirstFleet acquisition is driving margin impr.

zacks.com2026-07-24

WERN or XPO: Which Is the Better Value Stock Right Now?

Investors with an interest in Transportation - Truck stocks have likely encountered both Werner Enterprises (WERN) and XPO (XPO). But which of these two companies is the best option for those looking for undervalued stocks?

📊 AI Financial Analysis

Powered by StockMarketInfo
Earnings Data: Q Ending 2026-03-31

"WERN reported Q1 2026 revenue of $808.6M and net income of -$4.3M (EPS -$0.071). Revenue rose QoQ to some degree? Actually revenue increased from $737.6M in Q4’25 to $808.6M in Q1’26 (+9.7% QoQ), but declined vs Q1’25 revenue of $712.1M (+13.6% YoY). Profitability weakened sequentially: gross profit margin compressed from 10.8% (Q4’25) to 4.9% (Q1’26), and net margin deteriorated from -3.8% to -0.5% (i.e., losses narrowed). YoY, gross margin contracted (9.8% in Q1’25 to 4.9% in Q1’26) while net margin improved slightly vs -1.4% in Q1’25. Cash flow showed a rebound in Q1’26: operating cash flow was +$83.5M and free cash flow was +$30.7M, vs FCF -$23.5M in Q4’25. The company paid dividends of about $8.4M in the quarter, while no buybacks were recorded. Balance sheet resilience is mixed: total assets rose to $3.26B from $2.89B (Q4’25), while net debt increased to ~$980M from ~$734M, indicating leverage pressure despite ongoing equity levels (~$1.38B). Total shareholder returns were supportive given positive price momentum (1y_change +19.1% and 6m_change +17.2%), though not above the >20% threshold. Analyst valuation appears modest with a consensus target of $36.1 vs $32.58 spot."

Revenue Growth

Positive

Revenue increased +9.7% QoQ (Q4’25 $737.6M → Q1’26 $808.6M) and +13.6% YoY (Q1’25 $712.1M → Q1’26 $808.6M).

Profitability

Fair

Margins were volatile: gross margin compressed to 4.9% in Q1’26 from 10.8% in Q4’25 and from 9.8% in Q1’25. Net income remained negative (-$4.3M) but losses narrowed vs Q4’25 (-$27.8M), while YoY comparison shows improvement vs -$10.1M.

Cash Flow Quality

Positive

Operating cash flow rebounded to +$83.5M in Q1’26 and free cash flow turned positive to +$30.7M (vs -$23.5M in Q4’25). Dividends were paid (~$8.4M) with no disclosed buybacks; coverage is better than prior quarter but earnings remain loss-making.

Leverage & Balance Sheet

Neutral

Assets rose to $3.26B (from $2.89B). Net debt increased to ~$980M (from ~$734M), indicating higher leverage/financing pressure even though equity stayed relatively stable around ~$1.38B.

Shareholder Returns

Neutral

Price momentum is positive (1y_change +19.1%, 6m_change +17.2%), but below the >20% strong-momentum cutoff. Dividend yield is low (~0.48%). No buybacks were reported in Q1’26.

Analyst Sentiment & Valuation

Positive

Consensus price target of $36.1 vs current ~$32.58 implies upside (~10.8%). Target range ($29–$45) suggests moderate valuation support.

Disclaimer:This analysis is AI-generated for informational purposes only. Accuracy is not guaranteed and this does not constitute financial advice.

Fundamentals Overview

Loading fundamentals overview...

Werner delivered strong Q2 momentum driven by supply-side normalization plus internal execution. Revenues rose 24% to $934M and adjusted operating margin expanded 80 bps to 3.0%, with adjusted EPS up $0.14 to $0.22. The standout operational driver was 1 Way restructuring: revenue per truck per week +27.7% and adjusted OI margin +700 bps YoY, supporting TTS margin expansion of 270 bps (net of fuel). Dedicated remains resilient with retention >95% and dedicated revenue per truck per week guidance raised to +3% to +5%. Logistics remains the offset: segment margin -1.3% (-400 bps), pressured by Truckload Brokerage buy-side volatility and purchase transportation costs, though June sequential improvement occurred. Management also reaffirmed a multi-inning regulatory enforcement outlook (ELP, non-domiciled CDLs, cabotage), expecting ongoing capacity removal through year-end and possibly into early 2027, underpinning continued rate lift. Balance sheet liquidity remains solid with $657M total liquidity.

AI IconGrowth Catalysts

  • 1 Way Truckload restructuring benefits: revenue per truck per week strongest in a decade; adjusted 1-way OI margins +700 bps YoY; further benefit expected from repriced business and increased spot exposure in 2H
  • Technology/platform progress: 100% of legacy freight ingested into single edge TMS; AI/automation scaling across shipment optimization, load planning, maintenance, safety, and recruiting; early wins in road breakdown support and appointment scheduling
  • Dedicated momentum: customer retention >95%; dedicated bid activity at multi-quarter highs; dedicated revenue per truck per week strongest YoY since Q3 2022; 1-way market tightening pulling more long-term dedicated demand

Business Development

  • FirstFleet acquisition: 6 months post-close; synergy realization ahead of schedule; 98% renewal rate on >80% of portfolio renewed so far; remaining renewals expected in Q3 and Q4
  • Roadmaster school network (vertically integrated driver school network) and tier-1 collection of schools used to produce drivers for dedicated network

AI IconFinancial Highlights

  • Q2 revenues $934M (+24% YoY); adjusted operating income $27.6M (+67% YoY); adjusted operating margin 3.0% (+80 bps YoY)
  • Adjusted EPS $0.22 (+$0.14 YoY); consolidated gains on sale of property/equipment $1.5M vs $5.9M prior year and $3.8M in Q1; lower gains reduced adjusted EPS by ~$0.05
  • TTS margin net of fuel 5.5% (+270 bps YoY); excluding gains in both periods, operating income margins +370 bps
  • Truckload Transportation Services (TTS) safety: first-in DOT-preventable accidents per million miles down 45% YoY; similar decline in Q2; insurance/claims expense at lowest level since Q3 2020 (excluding FirstFleet and prior-year one-time nuclear verdict reversal)
  • 1 Way metrics: revenue per truck per week +27.7% YoY; miles per truck +15.7%; revenue per total mile +10.4%; 1-way adjusted operating margin +700 bps YoY
  • Logistics: revenue $212M (+8% sequential, -4% YoY); segment adjusted operating margin -1.3% (decline of 400 bps), primarily from Truckload Brokerage gross margin pressure; higher purchase transportation costs reduced segment gross margin by 260 bps
  • Liquidity/cash: operating cash flow $85M (+84% YoY); free cash flow $94M (10% of revenue); net CapEx net proceeds nearly $10M in Q2; full-year guidance updated for CapEx
  • Tax rate: Q2 effective tax rate 27.3% (including discrete items); full-year guidance maintained 25.5%–26.5%

AI IconCapital Funding

  • Debt: $841M total at quarter end; $48M assumed low-cost capital lease; $793M on credit facilities
  • Net debt: down $86M sequentially; $111M lower vs a year earlier
  • Liquidity: $657M total (including $57M cash and $600M availability under credit facilities); no near-term maturities in credit facilities
  • Buyback amounts: not stated in provided transcript
  • Cash runway: implied via $657M liquidity and stated access to low-cost capital; FirstFleet integration consuming mainly via ongoing M&A/integration costs

AI IconStrategy & Ops

  • TMS consolidation: 100% ingestion of legacy freight into single edge TMS to enable visibility, foundation for automation, and operational efficiency
  • Safety and operations upgrades: tech-enabled safety tools and equipment, upgraded driver training, safety onboarding, and equipment investment aimed at earlier risk identification and lower accident rates
  • 1 Way fleet management: first full quarter after restructuring conclusion; average trucks -34% YoY to 36; sequential average fleet -18% (down 386 trucks); driver hiring constraints slowing rehiring speed after asset repositioning
  • Logistics mix management: protecting yield amid buy-side rate volatility; actions to manage PowerLink vs brokerage mix; brokerage faced largest margin pressure

AI IconMarket Outlook

  • Market recovery is supply-driven with enforcement still early innings; long-haul truckload employment below pre-COVID; tender rejections elevated; ongoing rate lift expected through remainder of year
  • Dedicated: raise full-year guidance for dedicated revenue per truck per week to +3% to +5% (from prior flat to +3%)
  • 1 Way pricing: 1-way revenue per total mile guidance for Q3 up 10% to 13% YoY (Q2 reported +10.4%)
  • Fleet guidance revised: average truck fleet growth revised from +23% to +28% to +16% to +18%
  • Net CapEx guidance revised upward: $185M–$225M to $215M–$250M (includes strategic pre-buy of certain 2020-model-year tractors ahead of 2027 emission standards)

AI IconRisks & Headwinds

  • Regulatory enforcement is multi-inning and can continue to remove capacity, which also tightens driver supply and changes shipper/broker risk preferences (potential demand volatility)
  • Driver hiring constraints: limited speed/pace of driver rehiring post-1-way restructuring; competition for high-quality drivers increasing
  • Logistics margin pressure: purchase transportation costs and Truckload Brokerage buy-side rate volatility drove 400 bps decline in segment margin; April/May most challenging though June improved
  • Shadow capacity continues to dismantle via ELD provider exits/revocations (~1/3 exiting or certifications revoked), increasing enforcement-driven capacity contraction but may cause market/order volatility
  • Higher operating cost pressures noted: upward pressure on fuel, insurance, and equipment replacement costs

Q&A: Analyst Interest

  • Regulatory enforcement remaining innings and pricing impact: Management quantified a “third inning” status for FMCSA/CBP-focused enforcement, citing 27k+ ELP out-of-service drivers, 550 fraudulent CDL schools shut, nearly 10k CDL schools removed, 700+ high-risk investigations, October budget funding, and Modus tech rollout—suggesting continued capacity removal into early next year and sustained rate lift.
  • Montgomery/CH Robinson employer verdict—logistics and vetting implications: Management stated it won’t opine on Robinson’s specific case, but emphasized the verdict’s role in highlighting carrier-employer risk and increasing customer focus on compliance. Werner doubled down pre-Montgomery on vetting systems, and expects conversations to shift from price to quality/reliability, supporting asset and logistics differentiation.
  • Driver pipeline vs dedicated bid strength; pay increases: Management emphasized robust dedicated bid activity while remaining selective (not chasing capacity). They credited Roadmaster and tier-1 schools for producing high-quality drivers plus ramped experienced hires. For pay, they said targeted driver-pay increases are used “where right,” alongside lifestyle, equipment quality, and route predictability.

Sentiment: POSITIVE

Note: This summary was synthesized by AI from the WERN Q2 2026 earnings transcript. Financial data is complex; please verify all metrics against official SEC filings before making investment decisions.

📋 Official Regulatory 10-K / 10-Q SEC Filings

Direct authenticated documentation links to audited SEC database reports for WERN.

SEC EDGAR Live Feed
Loading financial data and tables...
📁

SEC Filings (WERN)

© 2026 Stock Market Info — Werner Enterprises, Inc. (WERN) Financial Profile