Worthington Industries, Inc.

Worthington Industries, Inc. (WOR) Market Cap

Worthington Industries, Inc. has a market capitalization of $2.67B.

Financials based on reported quarter end 2026-02-28

Price: $53.96

-0.64 (-1.17%)

Market Cap: 2.67B

NYSE · time unavailable

CEO: Joseph Hayek

Sector: Industrials

Industry: Manufacturing - Metal Fabrication

IPO Date: 1980-03-17

Website: https://www.worthingtonindustries.com

Worthington Industries, Inc. (WOR) - Company Information

Market Cap: 2.67B · Sector: Industrials

Worthington Industries, Inc., an industrial manufacturing company, focuses on value-added steel processing, manufactured consumer, building, and sustainable mobility products in North America and internationally. It operates through Steel Processing, Consumer Products, Building Products, and Sustainable Energy Solutions segments. The Steel Processing segment processes flat-rolled steel for customers primarily in the automotive, aerospace, agricultural, appliance, construction, container, energy, hardware, heavy-truck, HVAC, lawn and garden, leisure and recreation, office furniture, and office equipment markets. It also toll processes steel for steel mills, large end-users, service centers, and other processors. The Consumer Products segment sells tools, outdoor living, and celebrations products under the Coleman, Bernzomatic, Balloon Time, Mag-Torch, General, Garden-Weasel, Pactool International, Hawkeye, Worthington Pro Grade, and Level5 brand names. The Building Products segment sells refrigerant and LPG cylinders, well water and expansion tanks, and other specialty products to gas producers and distributors. The Sustainable Energy Solutions segment offers on-board fueling systems and services, as well as gas containment solutions and services for the storage, transport, and distribution of industrial gases. The company was founded in 1955 and is headquartered in Columbus, Ohio.

Analyst Sentiment

66%
Buy

Based on 15 ratings

Analyst 1Y Forecast: $72.00

Average target (based on 3 sources)

Consensus Price Target

Low

$65

Median

$67

High

$69

Average

$67

Potential Upside: 24.2%

Price & Moving Averages

Loading chart...

📘 Full Research Report

ℹ️

AI-Generated Research: This report is for informational purposes only.

📘 WORTHINGTON ENTERPRISES INC (WOR) — Investment Overview

🧩 Business Model Overview
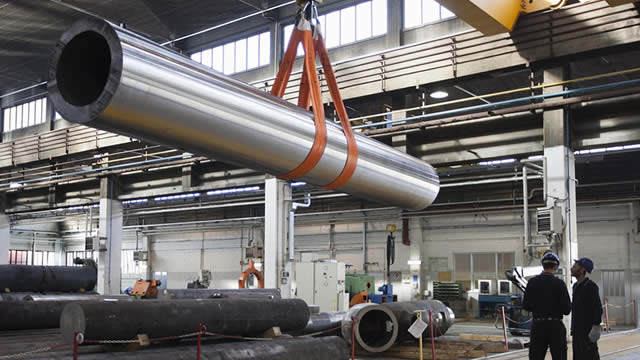
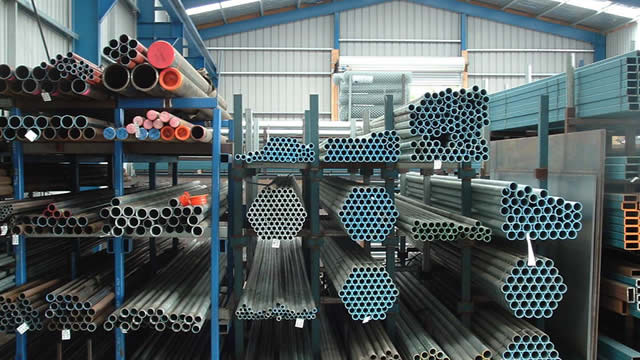
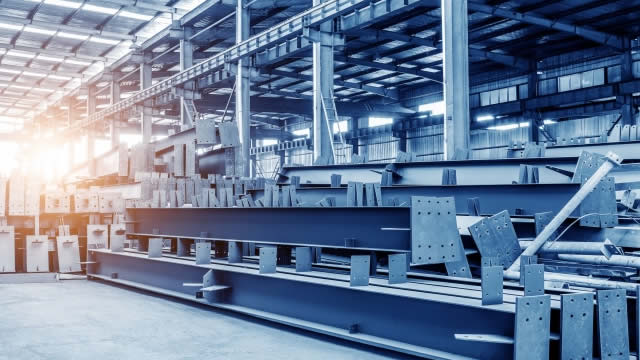
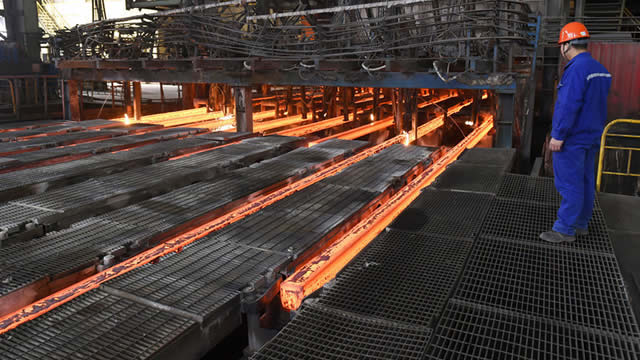
Worthington Enterprises Inc. (WOR) operates as a diversified industrial manufacturing company with a focus on high-value, engineered products. The company has evolved from its historical steel-processing roots into a portfolio of businesses serving end-markets like automotive, construction, energy, agriculture, and industrial. Through its subsidiaries, WOR designs and manufactures products such as pressure cylinders, value-added steel solutions, industrial components, and consumer products. The company aims to maintain a balanced growth strategy by blending organic investment with strategic acquisitions and portfolio optimization. WOR’s approach emphasizes lean manufacturing, operational excellence, and a culture of innovation. It fosters close collaborations with OEMs, commercial customers, and distributors, often by integrating value-added services, customization capabilities, and supply chain management solutions.

💰 Revenue Streams & Monetisation Model

Worthington Enterprises’ revenue is derived from multiple segments, reflecting its diversified model: - Steel Processing: Historically a major revenue driver, this segment offers steel slitting, tubing, and custom fabrications, supplying automotive, construction, and heavy machinery sectors. - Pressure Cylinders: This segment produces cylinders and related products for applications including industrial gas, cryogenics, alternative fuel storage, and consumer recreational products. - Building Products & Solutions: WOR manufactures and markets architectural and construction solutions, including cold-formed steel framing, HVAC components, and metal roofing products. - Industrial and Consumer Products: This includes specialty products tailored for energy, agriculture, and consumer end-uses. The company monetizes its product portfolio via a mix of direct sales to OEMs and distributors, long-term contracts with key industrial partners, and recurring sales from aftermarket and replacement markets.

🧠 Competitive Advantages & Market Positioning

Worthington Enterprises’ primary competitive advantages arise from its scale, operational expertise, and deep-rooted customer relationships: - Diversification: The company’s breadth across multiple industrial markets insulates it from sector-specific cyclicality and enables cross-selling opportunities. - Manufacturing Efficiency: Lean operations and an ongoing focus on automation and process optimization contribute to attractive margins and a nimble cost structure. - Innovation & Customization: A strong engineering and R&D focus allows the company to deliver tailored solutions, securing its position as a preferred supplier to major OEMs and distributors. - Strategic M&A: WOR has a track record of successful acquisitions and divestitures—enhancing its product offering and optimizing capital allocation. - Reputation & Longevity: With a history spanning over six decades, the company has established trust with customers and suppliers, leading to high retention and repeat business. The combination of these attributes enables the company to defend and grow its market share, even as competitive pressures mount within its core segments.

🚀 Multi-Year Growth Drivers

Several structural and strategic drivers underpin Worthington Enterprises’ long-term growth outlook: - Infrastructure and Construction Demand: Ongoing public and private investments in infrastructure, nonresidential construction, and renovation drive demand for building products and steel solutions. - Automotive Trends: Evolving automotive technologies, particularly around lightweighting and alternative fuels, create opportunities for value-added steel and pressure cylinder segments. - Alternative Energy Growth: Expanding hydrogen, natural gas, and renewable energy markets increase the need for safe and effective storage solutions—an area where WOR has established capabilities. - Portfolio Realignment: Strategic M&A, coupled with divestitures of non-core assets, position the company for higher-margin, less cyclical growth. - Operational Excellence Initiatives: Ongoing investments in automation, digitalization, and lean transformation drive productivity improvements and margin expansion. These macro trends support long-term demand while the company’s agility and diversified approach allow it to capitalize on emerging opportunities across various markets.

⚠ Risk Factors to Monitor

Despite its strengths, Worthington Enterprises faces several risks that could impact its financial performance and strategic trajectory: - Cyclical End Markets: Exposure to industrial, construction, and automotive demand cycles introduces earnings volatility. - Raw Material Price Fluctuations: Steel and other input costs are subject to commodity cycles and geopolitical factors, which can pressure margins despite hedging strategies. - Competition: The company faces competition from global conglomerates and specialized manufacturers across most of its segments. - Integration and Execution Risk: As a frequent acquirer and portfolio optimizer, the company must continue to integrate acquisitions effectively and realize projected synergies. - Environmental and Regulatory Compliance: Tightening environmental regulations and evolving safety standards may require additional investment or create execution hurdles, particularly in energy storage and pressure cylinder lines. - Customer Concentration: Significant revenue exposure to large OEMs and distributors increases dependence and negotiating risk.

📊 Valuation & Market View

According to prevailing analyst frameworks, Worthington Enterprises is frequently evaluated on both earnings and cash flow metrics, reflecting its established profitability and dividend-paying history. Its multiples often reflect a discount or premium to the industrial sector average based on its balance between cyclical exposure and defensive characteristics from diversification. Key considerations for valuation include: - Consistent free cash flow generation. - History of shareholder returns via dividends and share repurchases. - Balanced leverage and a strong balance sheet. - Optionality from M&A and portfolio transformation, which typically introduce catalysts for re-rating. Market perceptions may shift in line with macroeconomic cycles, steel price volatility, and management’s execution on its long-term strategy. Benchmarking against peers often considers both legacy steel-centric industrials and diversified manufacturers with exposure to growth markets like alternative energy and engineered building products.

🔍 Investment Takeaway

Worthington Enterprises Inc. provides investors with exposure to a diversified set of industrial and manufacturing end-markets, anchored by a culture of operational excellence and a history of strategic capital allocation. Its positioning across steel processing, pressure cylinders, and building solutions creates a resilient platform that can flexibly respond to changing demand cycles. While risks around cyclicality and raw material input costs remain notable, WOR’s track record of navigating industry cycles, executing on M&A, and driving operational efficiencies underpins its investment case. The company’s ongoing evolution from traditional steel processing toward higher-margin, value-added products, combined with tailwinds from infrastructure investment and alternative energy adoption, positions it for sustained multi-year growth. For long-term, risk-aware investors, Worthington Enterprises offers a differentiated industrial exposure with the potential for steady returns and upside from strategic transformation initiatives.

⚠ AI-generated — informational only. Validate using filings before investing.

Fundamentals Overview

Loading fundamentals overview...

📊 AI Financial Analysis

Powered by StockMarketInfo
Earnings Data: Q Ending 2026-02-28

"WOR reported revenue of $378.68M and a net income of $45.46M for the most recent quarter ending February 28, 2026. With earnings per share (EPS) at $0.93 and a total asset base of approximately $1.82B, the company demonstrates a solid financial footing. Operating cash flow is strong at $61.94M, with a free cash flow of $87.57M, indicating good cash generation despite recording $9.34M in dividends paid. WOR's total liabilities amount to $820.98M, leading to total equity of $1.00B, which reflects a manageable leverage profile with net debt of $351.70M. The stock has seen significant price appreciation of 26.44% over the past year, which notably enhances total shareholder returns. Despite recent volatility with a 6-month price decline of 13.91%, the market considers a consistent valuation with a target price consensus of $69. Overall, WOR shows potential in growth, profitability, and cash flow, highlighting its resilience in the market."

Revenue Growth

Good

Strong revenue of $378.68M reflecting solid performance.

Profitability

Positive

Profit margins are healthy with a net income of $45.46M.

Cash Flow Quality

Good

Robust operating cash flow of $61.94M complements healthy free cash flow.

Leverage & Balance Sheet

Positive

Manageable debt levels with net debt at $351.70M relative to equity.

Shareholder Returns

Strong

Excellent 1-year price appreciation of 26.44% despite dividend payments.

Analyst Sentiment & Valuation

Positive

Market maintains strong target price consensus at $69.

Disclaimer:This analysis is AI-generated for informational purposes only. Accuracy is not guaranteed and this does not constitute financial advice.

So what: Q3 was a strong execution quarter—revenue +24% YoY to $379M and adjusted EPS $0.98 (+8% vs $0.91) with SG&A down 70 bps as a % of sales. However, investors pressed on where the “strength” could break: tariffs remain unresolved, and management admitted negative tariff effects (commodity costs and overseas consumer products) even while claiming a net competitive benefit via Section 232 exposure for foreign competitors. Operational hurdles were real but bounded—storms caused lost production days and conversion cost pressure, and LSI purchase accounting temporarily dragged gross margin (28.9% vs 29.3%). In the Q&A, management stayed confident on multi-year data-center momentum (ASME cooling tanks ‘probably triple’ this year) and on LSI integration (meeting expectations, early days). Overall tone is upbeat, but the analyst pressure centered on margin durability, JV macro weakness (ClarkDietrich flattish Q4), and logistics/shipping uncertainty (Middle East LPG shipments).

AI IconGrowth Catalysts

  • 14% organic revenue growth; Building Products organic +16% for second straight quarter; Consumer organic +11%
  • ASME cooling tanks for liquid cooling/data centers—pipeline building with liquid-cooling adoption
  • Balloon Time new product + placement engine: store count up 64% to 55,000 stores; Balloon Time Mini innovation
  • Continuous margin/efficiency efforts with WBS (innovation, transformation/80-20 initiative, AI embedded into workflows)
  • LSI integration ramp starting mid-quarter; targeted cross-sell into engineered building systems / reroofing cycle

Business Development

  • LSI acquisition closed mid-January; commercial metal roofing clips/components/retrofit systems (OEM certified roof system engineering; high switching costs)
  • WAVE JV cited for strength; partner named: Armstrong
  • Customer/channel mitigation: partnered with retail customers through winter/seasonal product inventory positions

AI IconFinancial Highlights

  • GAAP EPS: $0.92 vs $0.79 prior year quarter
  • Adjusted EPS: $0.98 vs $0.91 prior year quarter (excluding restructuring/nonrecurring items)
  • Net sales: $379M, +24% YoY ($305M prior year); acquisitions contributed $32M net sales
  • Gross margin: 28.9% vs 29.3% YoY; contraction attributed to LSI purchase accounting inventory step-up
  • SG&A declined 70 bps as % of sales
  • Adjusted EBITDA: $85M vs $74M prior year quarter (+15% YoY); adjusted EBITDA margin 22.3% (22.4% referenced for trailing 12 months)
  • Consumer margin: adjusted EBITDA margin 22.9% vs 20.5% (+240 bps YoY)
  • Weather impact: storms caused delays and production-day losses in Northeast and a couple in Midwest; some expensive overtime to make up shipping; weather described as modest positive overall

AI IconCapital Funding

  • Capital expenditures: $14M in quarter (including $4M consumer facility modernization)
  • Dividends: $9M paid in quarter; declared quarterly dividend of $0.19/share payable June 2026
  • Share repurchase: $9M; repurchased 100,000 shares
  • Liquidity/leverage: net debt $306M; net debt / trailing adjusted EBITDA ~1x; $495M availability under revolving credit facility
  • Free cash flow: $48M in quarter; trailing 12-month free cash flow $164M; 95% conversion vs adjusted net earnings
  • Modernization spend remaining: ~$25M; modernization projects ~27M TTM; complete by mid-fiscal year 2027

AI IconStrategy & Ops

  • Automation/AI: AI embedded across applications; shifting focus to operational impact in specific workflows; continued investment in automation for efficiency
  • Transformation: 80/20 initiative progress cited as a driver of operating discipline
  • Integration: LSI integration ‘off to a good start’ / ‘early days’ but meeting expectations; only ~6 weeks contribution in Q3
  • Manufacturing capacity/tariff staffing: previously stated need to hire 40 more people to meet tariff-driven demand (referenced by analyst); management said it added manufacturing colleagues in December to meet demand

AI IconMarket Outlook

  • No Q4/next-quarter organic growth guidance provided; management declined to break out by Building Products vs Consumer/JVs
  • Data center demand visibility: ASME water business ‘probably triple’ this year; next year additional incremental growth; described as likely ‘several years’ not ‘a year or 2’
  • After modernization completion (mid-fiscal 2027), capex expected to return to more normalized levels to support ongoing free cash flow conversion

AI IconRisks & Headwinds

  • Tariffs unresolved: management still believes net benefit from announced/in-place tariffs but acknowledges negative impacts (commodity costs and overseas-manufactured consumer products)
  • Tariff mitigation steps (3 mitigants): (1) ask suppliers to partner/offset added costs, (2) use tools/take cost out of own supply chains, (3) contemplate pricing actions if needed
  • Gross margin headwind: modest contraction (28.9% vs 29.3%) primarily from LSI inventory step-up purchase accounting
  • JVs macro pressure: ClarkDietrich operating in ‘tough environment’; expected relatively flattish in Q4 vs improved sequentially in Q3; one more challenging comp then contribution to EBITDA growth expected into fiscal ’27
  • Weather disruptions: storm-related lost production days (Northeast and a couple Midwest) and potential conversion cost pressure; described as modest positive overall
  • Middle East / shipping risk: U.S.-Iran tensions created fluid conditions; current inability to ship to certain European LPG customers in the Middle East; mitigation via expectation that interruptions are inflationary (fuel/energy costs up) and stance to mitigate potential fuel price increases

Sentiment: POSITIVE

Note: This summary was synthesized by AI from the WOR Q3 2026 earnings transcript. Financial data is complex; please verify all metrics against official SEC filings before making investment decisions.

Loading financial data and tables...
📁

SEC Filings (WOR)

© 2026 Stock Market Info — Worthington Industries, Inc. (WOR) Financial Profile