W&T Offshore, Inc.

W&T Offshore, Inc. (WTI) Market Cap

W&T Offshore, Inc. has a market capitalization of $550.5M.

Price: $3.70

-0.40 (-9.76%)

Market Cap: 550.48M

NYSE · time unavailable

CEO: Tracy W. Krohn

Sector: Energy

Industry: Oil & Gas Exploration & Production

IPO Date: 2005-01-28

Website: https://www.wtoffshore.com

W&T Offshore, Inc. (WTI) - Company Information

Market Cap: 550.48M|Sector: Energy

Company Profile

W&T Offshore, Inc., an independent oil and natural gas producer, engages in the acquisition, exploration, and development of oil and natural gas properties in the Gulf of Mexico. The company sells crude oil, natural gas liquids, and natural gas. As of December 31, 2021, the company had working interests in 43 fields in federal and state waters; and under lease approximately 606,000 gross acres, including approximately 419,000 gross acres on the Gulf of Mexico Shelf, as well as approximately 187,000 gross acres in the Gulf of Mexico deepwater. W&T Offshore, Inc. was founded in 1983 and is headquartered in Houston, Texas.

Analyst Sentiment

92%
Strong Buy

From 2 Active Polls

Consensus Target Matrix

Data feed parsing pending...

Price & Moving Averages

Loading chart...

🎯 Wall Street Analyst Intelligence Report

1-Year structural target targets, chart projections, and sentiment maps.

Average 1Y Target
$3.89
▲ +5.00% Upside
Low Target
$2.78
-25% Risk
Median Target
$3.77
2% Mid
High Target
$4.63
25% Max
Consensus
Hold
6 / 15 Buys

Consensus Trend Projection

Trailing closures vs. 12-month metrics map.

Analyst Vote Distribution

Aggregate institutional coverage sentiment weights.

📊 Historical Valuation Multiples

Real-time Trailing Twelve Month (TTM) momentum side-by-side with discrete quarterly metrics.

Fiscal QuarterTTMQ1 2026Q4 2025Q3 2025Q2 2025Q1 2025Q4 2024Q3 2024Q2 2024
Period EndingTrailing 12MMar 31, 2026Dec 31, 2025Sep 30, 2025Jun 30, 2025Mar 31, 2025Dec 31, 2024Sep 30, 2024Jun 30, 2024
Market Cap ($M)550507243270244229245316322
Enterprise Value ($M)773729453498475475530584592
Price to Earnings Ratio (P/E)-3.88-5.63-2.23-0.95-2.92-1.87-2.62-2.14-5.23
Price/Earnings-to-Growth Ratio (PEG)-0.24-0.22-0.24-3.74
Price to Sales Ratio (P/S)1.063.381.992.121.991.762.032.612.25
Price to Book Ratio (P/B)-2.48-2.29-1.21-1.57-2.37-2.76-4.65-10.0464.30
Price to Free Cash Flow Ratio (P/FCF)11.67-63.9115.9157.106.94-22.07-13.2561.7910.49
Enterprise Value to Sales (EV/Sales)4.863.723.903.883.654.414.814.15
Enterprise Value to EBITDA (EV/EBITDA)7.3414.4721.9822.5338.9830.4616.90213.7616.81
Debt to Equity Ratio2.11-1.59-1.76-2.04-3.42-4.25-7.51-12.5178.60

WTI Growth Runway Model

Standard long term linear growth fade

Multi-Stage Discounted Cash Flow Sandbox

Market Price$3.70
Intrinsic Value$3.70
Market Alignment
Overvalued by 0.1%relative to calculated intrinsic value
9.00%
Exp: 4%4%
i

Growth runway slowdown

This value provides a time window for the growth rate to decline beyond Stage 1 toward the terminal rate. Longer windows are most useful for companies with high growth starting conditions or strong competitive advantages. This option stretches out the growth rate slowdown across 5, 10, or 15-year steps. A high-growth starting condition (exceeding a 25% initial growth rate) automatically applies a curve decay to simulate realistic, rapid market saturation.
i

Terminal growth rate

With long-term inflation between 3-5%, revenue must grow by that baseline to maintain flat real-world market share. This value sets the permanent terminal growth rate to factor into the valuation beyond the growth slowdown runway toward maturity.

3-Stage Financial Runway Horizon

🧠 Perpetuity Horizon Engine (Stage 3: Post-2035)

Terminal FCF Base$0.13B
Perpetuity TV Value$2.42B
Discounted TV (PV)$1.02B
TV Weighting %60.1%
⚠️
Financial Model Disclaimer & Risk Disclosure: This interactive scenario simulator is an educational sandbox provided strictly for informational and analytical research purposes. Core historical financial statements and consensus estimates are sourced directly via Financial Modeling Prep (FMP). All downstream outputs are entirely deterministic, hypothetical projections generated by combining automated mathematical formulas (including linear interpolation and Gaussian bell-curve decay models) with user-selected variables and third-party financial data inputs. Users assume all liability for trading decisions executed based on these sandbox calculations.

📘 Full Research Report

ℹ️

AI-Generated Research: This report is for informational purposes only.

📘 W AND T OFFSHORE INC (WTI) — Investment Overview

🧩 Business Model Overview

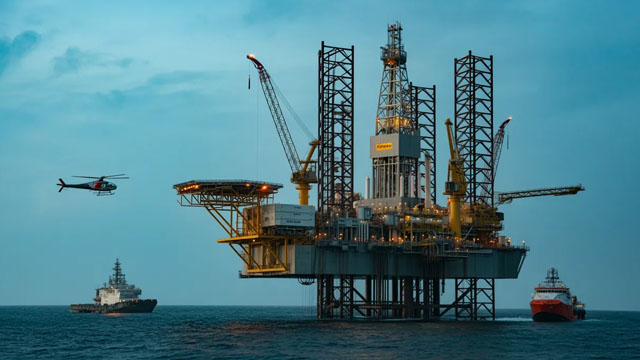
W&T Offshore produces hydrocarbons from U.S. Gulf of Mexico assets, monetizing oil, natural gas, and natural gas liquids extracted from a mix of fields tied to existing offshore infrastructure. The operating value chain runs from reservoir development (leasing, seismic interpretation, appraisal, and drilling) to field operations (production, well interventions, and safety/environmental compliance) and then to marketing and sales through established crude and gas offtake channels. Customer “stickiness” is not contractual; it is inherent to physical production—once wells and associated gathering/transport logistics are in place, volumes flow to market with continuity governed by reservoir performance and uptime rather than customer-specific switching costs.

💰 Revenue Streams & Monetisation Model

Revenue is predominantly commodity-driven: realized prices for crude oil, natural gas, and natural gas liquids net of royalties and transportation and processing. The monetization model is largely volume × realized price, with margin shaped by (1) lease-level operating costs (lifting costs, workover intensity, and offshore service costs), (2) depreciation and depletion reflecting the asset base and production decline, (3) transportation and gathering expenses tied to the local infrastructure network, and (4) hedging/derivative settlements that can dampen or amplify results depending on execution. Because production declines without reinvestment, the economic engine depends on replacement and deferral management—balancing drilling and well interventions against the natural decline curve.

🧠 Competitive Advantages & Market Positioning

W&T’s competitive positioning is best understood as an offshore geographic and infrastructure adjacency advantage paired with operational know-how concentrated in a specific basin.

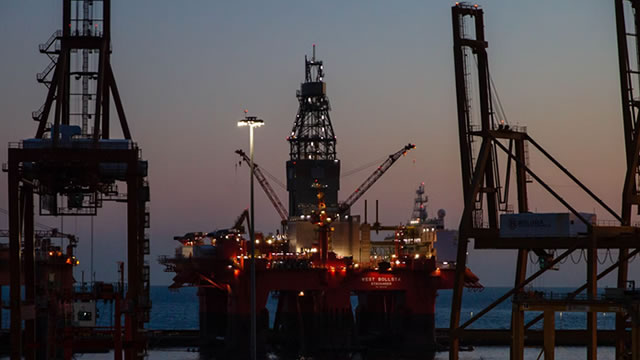
  • Geographic cost advantage (Gulf of Mexico focus): Operating in the U.S. Gulf places production near established offshore service networks, ports, and midstream connectivity. This proximity can reduce certain logistical frictions (fabrication/maintenance lead times, marine support coordination, and transportation routing) versus more remote basins.
  • Logistical infrastructure and field tie-in economics: Value is enhanced when incremental barrels are produced through existing platforms, subsea tie-backs, and nearby processing/transport systems. This tends to lower marginal development costs relative to building greenfield infrastructure.
  • Intangible operational capability: Deep basin knowledge—reservoir behavior, well design learnings, and execution discipline—improves the probability of sustained production through interventions, thereby supporting lower “learning curve” risk compared with less specialized operators.

Competitive benchmarking (primary offshore/public independents)

  • Murphy Oil: More diversified across projects and time horizons; competes for offshore acreage and services while emphasizing development throughput.
  • Talos Energy: Focuses on U.S. Gulf opportunities with a portfolio approach to exploration and development risk.
  • Shell / Chevron (majors): Larger balance-sheet capacity and project pipelines; typically operate at higher scale and pursue long-dated capital programs across the basin.

W&T’s differentiation versus these rivals is the concentration of operational expertise and portfolio execution within the U.S. Gulf of Mexico, often emphasizing optimization of existing assets and intervention-driven value rather than only frontier, high-exploration “optionality.” The moat is therefore less about brand or marketing and more about execution quality in a geographically bounded, infrastructure-connected operating theater.

🚀 Multi-Year Growth Drivers

  • Reinvestment to offset natural decline: Sustaining production over a 5–10 year horizon depends on an ongoing cycle of drilling, completion optimization, and well interventions. Growth emerges when the company can translate capital into reserves replacement and improved well productivity at acceptable risk-adjusted costs.
  • Cost discipline and service ecosystem management: Offshore margins are sensitive to labor, rig availability, vessel days, and supply chain volatility. A portfolio with established infrastructure access can provide room for margin stabilization even when industry costs rise.
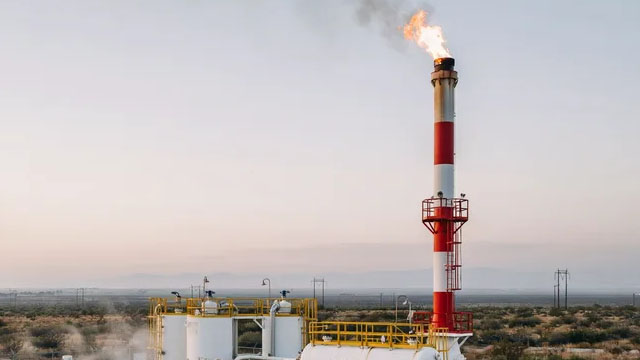
  • Gas value proposition from U.S. demand: Natural gas and natural gas liquids can benefit from durable North American consumption and petrochemical demand, with the Gulf positioned as a production region linked to established processing and export-related dynamics.
  • Targeted resource development: The basin’s mature geologic understanding enables continuous opportunity sets—appraisal, redevelopment, recompletions, and debottlenecking—supporting incremental reserves growth without requiring the same level of new infrastructure creation.

⚠ Risk Factors to Monitor

  • Commodity price and realized spread risk: Oil and gas prices drive cash flow directly; realized differentials and basis effects can vary by production point and gas market conditions.
  • Offshore operational and weather risk: Hurricanes, tropical storms, and equipment reliability affect uptime and repair timelines, with potential cost overruns and production deferment.
  • Regulatory, environmental, and decommissioning obligations: Compliance costs, potential changes to offshore permitting, and long-tail abandonment and site restoration requirements can create financial pressure, especially over distressed capital environments.
  • Capital access and balance-sheet risk: Offshore independents can face constrained financing during downturns. Tight capital can reduce the ability to replace reserves and maintain production.
  • Subsurface and execution risk: Reservoir uncertainty, well performance variability, and intervention outcomes can diverge from plan, affecting reserve replacement and per-unit economics.

📊 Valuation & Market View

Equity valuation in offshore E&P is typically anchored to resource value and cash flow durability, with emphasis on reserve metrics and capital efficiency rather than software-like recurring revenue multiples. Common frameworks include:

  • DCF / Net asset value (NAV) approaches using proved reserves and PV-10-style assumptions (risked by project/decline expectations).
  • EV/EBITDA or P/CF (where applied) driven by commodity assumptions, operating cost trends, and reinvestment needs.
  • Per-unit production and cost metrics that influence “quality” of earnings: operating cost per barrel of oil equivalent, sustaining capex, and reserve life/replace-rate indicators.

The valuation needle typically moves with sustained changes in realized commodity economics, unit operating costs, reserve replacement rates, and credible capital allocation that preserves balance-sheet flexibility through the cycle.

🔍 Investment Takeaway

W&T Offshore’s long-term investment case rests on basin-specific execution in the U.S. Gulf of Mexico, where geographic proximity to offshore infrastructure and field/tie-in economics can support competitive marginal economics. The key determinant of value over a multi-year horizon is not a marketing-led revenue advantage, but the ability to convert reinvestment into reliable reserve replacement and production stability while managing offshore operational risk and maintaining financial flexibility through commodity cycles.


⚠ AI-generated — informational only. Validate using filings before investing.

📰 Market News & Coverage

15 Stories Available

Real-time institutional reporting and market updates for WTI.

fxempire.com2026-06-05

Natural Gas, WTI Oil, Brent Oil Forecasts – Oil Retreats As Dollar Rallies After NFP Report

Oil markets are losing ground as traders prepare for the start of the rate hike cycle.

fxempire.com2026-06-05

Natural Gas and Oil Forecast: WTI Under $92 While Brent Tests $94 — Will NatGas Extend Gains?

One month-plus into the truce, supply-demand dynamics dominate as US production stays robust. WTI slides below $92 after channel violation, Brent defends $94.69 support, and Natural Gas maintains position at $3.327 with positive momentum.

fxempire.com2026-06-04

Natural Gas, WTI Oil, Brent Oil Forecasts – Oil Retreats As Israel And Lebanon Agree To Implement Ceasefire

Hezbollah, which is fighting against Israel, rejected the ceasefire deal.

fxempire.com2026-06-04

Natural Gas and Oil Forecast: 9 Weeks of Ceasefire – WTI & Brent Defend Floors, NatGas Eyes $3.25?

With geopolitical risk premium largely removed, oil benchmarks found support inside channels while natural gas maintained strength. WTI defended $95.53 with higher lows, Brent tested $97.18, and NatGas retested $3.231 after recent surge.

fxempire.com2026-06-03

Oil Price Forecast: WTI Eyes $100 as Iran Tensions Lift Brent

Oil prices remain supported as Iran tensions, Strait of Hormuz risks, and falling U.S. crude inventories keep WTI near a key breakout zone while Brent holds its bullish structure.

fxempire.com2026-06-03

Natural Gas, WTI Oil, Brent Oil Forecasts – Oil Rallies As Iran Attacks U.S. Bases In Bahrain And Kuwait

In turn, the U.S. attacked an empty oil tanker that was headed to Iran.

fxempire.com2026-06-03

Natural Gas and Oil Forecast: 9 Weeks of Ceasefire — WTI & Brent Defend Channels, NatGas Eyes $3.256?

With geopolitical risk premium largely removed, oil benchmarks found support inside channels while natural gas maintained strength. WTI defended $94.68 with higher lows, Brent held $96.93, and NatGas retested $3.161 after surge.

fxempire.com2026-06-02

Natural Gas, WTI Oil, Brent Oil Forecasts – Oil Gains Ground As Hopes Of Quick Iran Deal Fade

Oil markets are moving higher as President Trump said that he expected that memorandum of understanding with Iran would be ready over the next week.

fxempire.com2026-06-02

Oil Price Forecast: WTI and Brent Slide as Iran Talks Keep Hormuz Risk High

Crude oil prices remain volatile as U.S.-Iran peace talks, Strait of Hormuz risks, and tight supply conditions keep WTI and Brent trapped in broad consolidation ranges.

fxempire.com2026-06-02

Natural Gas and Oil Forecast: WTI Breakdown Below $92 While Brent Tests $94 — NatGas Holding Strong?

With geopolitical risk premium largely removed, oil benchmarks faced renewed selling pressure while natural gas showed resilience. WTI confirms bearish breakdown targeting $89.14, Brent tests channel floor at $94.06, and NatGas holds $3.169 after surge.

fxempire.com2026-06-01

Natural Gas, WTI Oil, Brent Oil Forecasts – Oil Rallies As Traders Worry That Iran Will Exit Negotiations

President Trump said that Israel and Hezbollah agreed to a ceasefire and added that talks with Iran continued, but traders wanted to see additional confirmation.

fxempire.com2026-06-01

Natural Gas and Oil Forecast: WTI & Brent Bounce, NatGas Breakout — More Upside Ahead?

With geopolitical risk premium largely removed, oil benchmarks found support inside ascending channels while natural gas delivered a powerful move. WTI defended $90.29 with higher lows, Brent bounced off channel floor, and NatGas broke higher targeting $3.473.

fxempire.com2026-05-29

Natural Gas, WTI Oil, Brent Oil Forecasts – Oil Prices Test New Lows As Traders Wait For Trump's Decision On Iran

Oil markets test new lows as traders wait for results of U.S. – Iran talks.

fxempire.com2026-05-29

Natural Gas and Oil Forecast: WTI Below $92 While Brent Tests $95 — NatGas Breakout in Play?

One month-plus into the truce, supply-demand dynamics dominate as US production stays robust. WTI plunges below $92 after channel violation, Brent defends $95.01 support, and Natural Gas holds steady near $2.995 with positive momentum.

proactiveinvestors.co.uk2026-05-29

Crude oil on track for second weekly loss amid Hormuz deal hopes

Brent crude and WTI, its US counterpart, are heading for a second consecutive weekly decline as traders bet that a diplomatic resolution to the US-Iran conflict will eventually reopen the Strait of Hormuz, even as hostilities continue to flare. Brent was trading around $91.53 per barrel on Friday, down roughly 5% on the week, while WTI was around $87.65, having shed more than 7% over the same period.

📊 AI Financial Analysis

Powered by StockMarketInfo
Earnings Data: Q Ending 2026-03-31

"WTI reported Q1 2026 revenue of $150.0M and net income of -$22.5M (EPS -$0.15). Revenue rose +9.3% QoQ (vs. $121.7M in 2025-Q4) and +15.4% YoY (vs. $129.9M in 2025-Q1). Net income improved slightly QoQ but deteriorated YoY: -$22.5M vs. -$27.1M in 2025-Q4 (QoQ improvement of +16.9%), and -$22.5M vs. -$30.6M in 2025-Q1 (YoY improvement of +26.3%). Profitability remains challenged but is stabilizing. Operating income turned positive in Q1 2026 (+$14.6M) after a weak Q4 2025 (-$19.1M), and the operating margin improved to 9.8% from -15.7% QoQ. However, the company still has negative net margins (-15.0%), largely driven by negative other income/expense (net -$34.5M). Cash flow quality is mixed: operating cash flow was positive at $2.6M, but free cash flow was also only $2.6M, with dividends paid of ~$1.5M. Balance-sheet resilience is uneven: total equity is negative (-$221.8M) but cash increased to $130.9M. Total shareholder return is likely strong given momentum: the stock is up +158.6% over 1 year, with a small dividend yield (~0.29%), implying capital appreciation is doing most of the work."

Revenue Growth

Good

Revenue increased +9.3% QoQ (Q1’26 vs Q4’25) and +15.4% YoY (vs Q1’25), showing a constructive top-line trend.

Profitability

Neutral

Operating income improved sharply QoQ (+$14.6M vs -$19.1M) and operating margin expanded to +9.8%. Net income is still negative (-$22.5M; -15.0% net margin), indicating earnings remain suppressed by other expenses.

Cash Flow Quality

Caution

Operating cash flow was slightly positive ($2.6M) with free cash flow also $2.6M, but coverage is modest and earnings are still loss-making. Dividends were paid (~$1.5M) despite losses.

Leverage & Balance Sheet

Fair

Cash rose QoQ ($140.6M to $130.9M after a decline from Q4) while total equity remains negative (-$221.8M). Liquidity ratios are near break-even (current ratio ~0.99), suggesting limited balance-sheet resilience.

Shareholder Returns

Strong

Strong 1-year price momentum (+158.6%) with a small dividend yield (~0.29%). Total return appears driven primarily by capital appreciation rather than earnings/dividend growth.

Analyst Sentiment & Valuation

Positive

No price target provided. Valuation metrics based on negative earnings are less reliable, but the stock’s strong momentum implies bullish market sentiment.

Disclaimer:This analysis is AI-generated for informational purposes only. Accuracy is not guaranteed and this does not constitute financial advice.

Fundamentals Overview

Loading fundamentals overview...

WTI’s Q1 2026 performance is highlighted by stronger-than-guided economics and cost control: production held flat at 36.2k boe/d while realized pricing jumped 26% to $45.08/boe. LOE fell 11% to $66M, driving adjusted EBITDA of $55M (best quarter since 2023) and $21M free cash flow. Management reiterated full-year capex of $20M–$25M and unchanged full-year LOE despite a planned Mobile Bay turnaround that should pressure Q2 output (-5% to ~34.3k boe/d) and lift Q2 LOE to $71M–$79M. Strategy remains capital-light and acquisition-driven: prioritize workovers, recompletions, and facility optimization over discretionary drilling, supported by probable-to-proved reserve conversion that enhances both reserves and borrowing capacity. Key ongoing overhangs are surety collateral litigation appeal and near-term operational disruption from the third-party facility turnaround. Net tone is positive with M&A re-engagement expectations contingent on market movement.

AI IconGrowth Catalysts

  • Ramp-up workovers and recompletions during late spring/summer (weather-driven), including moving activities in the Gulf to begin the process
  • Use of low-risk, high-rate-of-return workovers and facility optimization as primary reinvestment lever vs higher capex growth
  • Planned third-party Mobile Bay natural gas processing facility turnaround to temporarily impact NGL volumes, with management expecting full-year LOE guidance unchanged

Business Development

  • Ongoing pursuit of accretive Gulf of Mexico producing property acquisitions while remaining in data rooms for extended periods; specific assets/partners not named
  • Regulatory changes to supplemental financial assurance/bonding costs expected to encourage U.S. offshore production growth and potentially improve M&A conditions (no named counterparties)

AI IconFinancial Highlights

  • Q1 2026 realized price: $45.08/boe, +26% vs Q4 2025; March realized oil price: $88.61/bbl
  • Production: 36.2 thousand boe/d, toward the higher end of guidance and flat vs 2025 despite early-2026 adverse weather
  • LOE: down 11% to $66 million, below the midpoint of guidance; driver cited as lower base LOE spend reflecting prior Q4 2025 cost-saving initiatives materializing in 2026
  • Adjusted EBITDA: $55 million, highest quarterly number since 2023
  • Free cash flow: $21 million, significant improvement vs Q4 2025
  • Guidance reiterated: full-year capex $20M–$25M (excluding potential acquisitions); full-year LOE unchanged despite planned Q2 turnaround
  • Q2 2026 midpoint production: ~34.3 thousand boe/d, -5% vs full-year 2026 pace driven primarily by Mobile Bay turnaround
  • Q2 2026 LOE: $71M–$79M vs Q1 actual $66M, seasonal increase tied to Mobile Bay turnaround and additional planned workover/facility maintenance
  • Q2 transportation and production taxes: $7M–$8M vs $9M in Q1; benefit attributed to new pipeline installed for the West Delta 73 field

AI IconCapital Funding

  • End of 2026 (as stated in transcript): total debt $351M; net debt $220M
  • Liquidity: $175M
  • Capital expenditures in 2026: $7M reported for the year-to-date/quarterly figure; full-year capex forecast $20M–$25M excluding acquisitions
  • Asset retirement obligation (ARO) budget: $34M–$42M
  • Asset retirement settlement costs: $17M in the period
  • No explicit buyback authorization/amount, no explicit debt issuance/repayment details provided beyond debt/net debt and liquidity figures

AI IconStrategy & Ops

  • Management emphasizes capital-light model: spend less on capex and more on low-risk workovers and facility optimization to generate faster cash flow and preserve liquidity for acquisitions
  • Operational focus on integrating producing acquisitions into existing infrastructure, targeting production uplift via LOE-funded workovers/recompletions/upgrades
  • 2P-to-PDP conversion approach highlighted: probable reserves booked under SEC rules first drive cash flow and reserves, later converting to proved reserves over time
  • Surety collateral litigation: district court rejected surety attempt to require immediate collateral; company prevailed in virtually every respect re dismissal motion and filed amended lawsuit seeking damages (no quantifications provided in transcript)

AI IconMarket Outlook

  • Q2 2026 production midpoint forecast: ~34.3 thousand boe/d (-5% vs 2026 baseline) due to Mobile Bay turnaround
  • Q2 2026 LOE guidance: $71M–$79M
  • Q2 2026 transportation and production taxes: $7M–$8M (vs $9M in Q1)
  • Federal Register comment period for proposed Department of Interior financial assurance rollbacks expected to end May 15

AI IconRisks & Headwinds

  • Near-term NGL disruption risk: Mobile Bay third-party gas processing facility turnaround expected to impact NGL volumes and temporarily increase LOE (full-year LOE unchanged)
  • Seasonality risk: LOE expected to increase in Q2 due to workover/facility maintenance timing and warmer-weather work (lower wind) effects
  • Regulatory/bonding and surety litigation overhang: sureties appealing district court ruling; company states the case will continue
  • M&A environment uncertainty: management notes a dearth of significant Gulf transactions for several years but expects potential movement—timing not guaranteed
  • Macro/geo risk commentary in closing remarks: war in Iran referenced as making market outlook harder to assess

Q&A: Analyst Interest

  • 2P-to-PDP timing: Management explained that probable reserves are realized first as cash flow and later booked reserves under SEC mechanics, often becoming proved producing additions over time. The answer emphasized the “dual effect” of higher reserves and borrowing capacity, framed as normal operations rather than near-term drilling.
  • Capital-light production sustainability: Management stated that flat production vs low reinvestment is largely due to moving 2P/probable into PDP/proved reserves without incremental capex. They characterized activity as additions becoming producing over time, supported by reserve profile quirks, and referenced continued cash flow-focused management.
  • M&A purchase criteria and regulatory impact: Management said acquisitions are evaluated across the full reserve stack (not only 1P), with retirement obligations a key Gulf-of-Mexico factor. They highlighted expertise from over $1B decommissioning experience, and suggested regulatory changes could affect industry activity, while noting they are already in extensive data rooms.

Sentiment: POSITIVE

Note: This summary was synthesized by AI from the WTI Q1 2026 earnings transcript. Financial data is complex; please verify all metrics against official SEC filings before making investment decisions.

📋 Official Regulatory 10-K / 10-Q SEC Filings

Direct authenticated documentation links to audited SEC database reports for WTI.

SEC EDGAR Live Feed
Loading financial data and tables...
📁

SEC Filings (WTI)

© 2026 Stock Market Info — W&T Offshore, Inc. (WTI) Financial Profile