American Battery Technology Company Common Stock

American Battery Technology Company Common Stock (ABAT) Market Cap

American Battery Technology Company Common Stock has a market capitalization of $326.7M.

Price: $3.11

-0.60 (-16.17%)

Market Cap: 326.66M

NASDAQ · time unavailable

CEO: Ryan Mitchell Melsert

Sector: Basic Materials

Industry: Industrial Materials

IPO Date: 2016-02-24

Website: https://americanbatterytechnology.com

American Battery Technology Company Common Stock (ABAT) - Company Information

Market Cap: 326.66M|Sector: Basic Materials

Company Profile

American Battery Technology Company operates as a battery materials company. The company explores for resources of battery metals, such as such as lithium, nickel, cobalt, and manganese; and develops and commercializes technologies for the extraction of battery metals, as well as commercializes integrated process for the recycling of lithium-ion batteries. The company was formerly known as American Battery Metals Corporation. American Battery Technology Company was incorporated in 2011 and is headquartered in Reno, Nevada.

Analyst Sentiment

92%
Strong Buy

From 2 Active Polls

1Y Forecast: $6.00

▲ +92.9% Potential Upside

Consensus Target Metrics

Low Bound

$6

Median

$6

High Bound

$6

Average

$6

Price & Moving Averages

Loading chart...

🎯 Wall Street Analyst Intelligence Report

1-Year structural target targets, chart projections, and sentiment maps.

Average 1Y Target
$6.00
▲ +92.93% Upside
Low Target
$6.00
93% Risk
Median Target
$6.00
93% Mid
High Target
$6.00
93% Max

Consensus Trend Projection

Trailing closures vs. 12-month metrics map.

Analyst Vote Distribution

Aggregate institutional coverage sentiment weights.

Sentiment volume allocation data unavailable.

📊 Historical Valuation Multiples

Real-time Trailing Twelve Month (TTM) momentum side-by-side with discrete quarterly metrics.

Fiscal QuarterTTMQ1 2026Q4 2025Q3 2025Q2 2025Q1 2025Q4 2024Q3 2024Q2 2024
Period EndingTrailing 12MMar 31, 2026Dec 31, 2025Sep 30, 2025Jun 30, 2025Mar 31, 2025Dec 31, 2024Sep 30, 2024Jun 30, 2024
Market Cap ($M)327368432545148881857460
Enterprise Value ($M)289330384516149921807160
Price to Earnings Ratio (P/E)-6.45-2.72-11.63-13.24-3.65-1.91-3.46-1.59-0.64
Price/Earnings-to-Growth Ratio (PEG)-0.04-0.03-0.02-0.01-0.05
Price to Sales Ratio (P/S)20.0647.1090.72581.8053.4689.43557.32368.32175.58
Price to Book Ratio (P/B)3.643.263.635.682.101.342.621.250.98
Price to Free Cash Flow Ratio (P/FCF)-9.02-34.32-38.26-69.51-23.30-8.52-23.72-11.59-11.51
Enterprise Value to Sales (EV/Sales)42.2880.71549.9753.6693.75541.98352.54174.13
Enterprise Value to EBITDA (EV/EBITDA)-4.63-9.79-45.88-59.61-12.81-9.84-14.39-7.72-2.41
Debt to Equity Ratio0.600.000.000.000.110.110.150.040.11

ABAT Growth Runway Model

🟢 Initial high growth rate - forecast is based on a long term bell curve % growth rate

Multi-Stage Discounted Cash Flow Sandbox

Market Price$3.11
Intrinsic Value$3.11
Market Alignment
Overvalued by 0.1%relative to calculated intrinsic value
9.00%
Exp: 25%25%
i

Growth runway slowdown

This value provides a time window for the growth rate to decline beyond Stage 1 toward the terminal rate. Longer windows are most useful for companies with high growth starting conditions or strong competitive advantages. This option stretches out the growth rate slowdown across 5, 10, or 15-year steps. A high-growth starting condition (exceeding a 25% initial growth rate) automatically applies a curve decay to simulate realistic, rapid market saturation.
i

Terminal growth rate

With long-term inflation between 3-5%, revenue must grow by that baseline to maintain flat real-world market share. This value sets the permanent terminal growth rate to factor into the valuation beyond the growth slowdown runway toward maturity.

3-Stage Financial Runway Horizon

🧠 Perpetuity Horizon Engine (Stage 3: Post-2035)

Terminal FCF Base$0.02B
Perpetuity TV Value$0.29B
Discounted TV (PV)$0.12B
TV Weighting %68.0%
⚠️
Financial Model Disclaimer & Risk Disclosure: This interactive scenario simulator is an educational sandbox provided strictly for informational and analytical research purposes. Core historical financial statements and consensus estimates are sourced directly via Financial Modeling Prep (FMP). All downstream outputs are entirely deterministic, hypothetical projections generated by combining automated mathematical formulas (including linear interpolation and Gaussian bell-curve decay models) with user-selected variables and third-party financial data inputs. Users assume all liability for trading decisions executed based on these sandbox calculations.

📘 Full Research Report

ℹ️

AI-Generated Research: This report is for informational purposes only.

📘 AMERICAN BATTERY TECHNOLOGY COMPAN (ABAT) — Investment Overview

🧩 Business Model Overview

American Battery Technology Company operates in the battery recycling and recovery value chain: it sources spent lithium-ion batteries (and related battery waste streams), processes them through proprietary metallurgical/chemical pathways, and sells recovered “battery-grade” inputs such as cathode/anode-active materials and/or separable battery metals for reuse in new battery manufacturing. The economic linkage is direct: value is created by converting low-value, heterogeneous waste into higher-value, specification-constrained materials that battery producers can incorporate into manufacturing supply.

Customer stickiness tends to come less from “switching costs” in a software sense and more from the combination of (1) consistent material specs, (2) qualified offtake relationships, and (3) logistical capability to deliver reliable recovered feedstock into a domestic production footprint.

💰 Revenue Streams & Monetisation Model

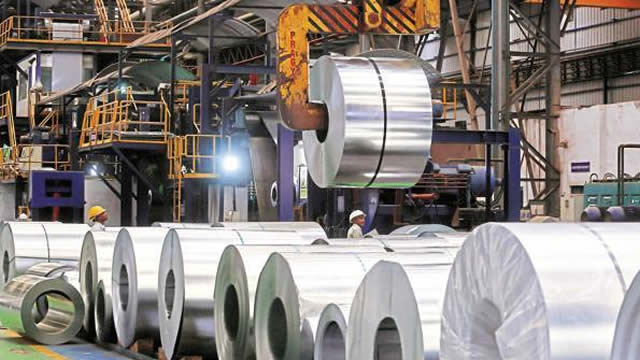
  • Recovered materials sales (primary monetisation): Revenue is generated by selling recovered battery inputs (battery-ready materials and/or separated metal streams). Margin depends on the yield, purity, and conversion efficiency relative to prevailing metal economics.
  • Recycling processing/treatment economics (secondary): Where feedstock arrangements structure the economics around processing capacity and recovery rates, profitability is driven by throughput, contamination handling, and process stability.
  • Contracted off-take vs. spot exposure: Material sales can be partially supported by offtake agreements with battery manufacturers or intermediaries, but economics often still fluctuate with metal price spreads and specification requirements.

The key margin drivers are (1) recovery yield and quality (lower losses and higher value per ton), (2) plant utilization and operating discipline, and (3) the net “spread” between feedstock acquisition economics and the realizable value of recovered outputs.

🧠 Competitive Advantages & Market Positioning

ABAT’s potential moat is primarily rooted in low-cost feedstock access and logistical/infrastructure readiness, supported by process know-how required to meet battery-grade specifications.

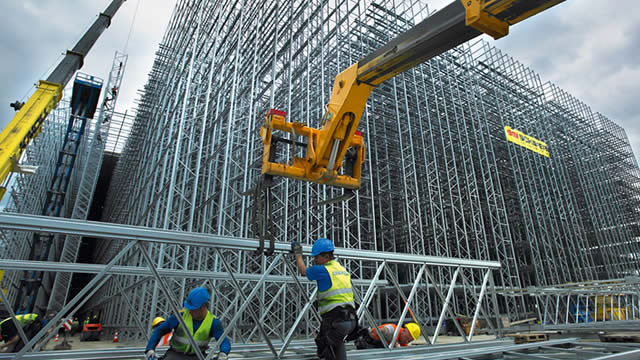
  • Low-Cost Feedstock (geographic + contractual sourcing): Battery recycling economics benefit from secure, durable access to spent cells and battery waste streams. A U.S.-anchored footprint can reduce cross-border transportation and help align with domestic feedstock availability.
  • Logistical Infrastructure: Recycling is constrained by collection, transport, and permitted processing capacity. Facility siting and throughput scale can improve delivered economics per ton and reduce effective working capital intensity.
  • Technical Process Capability (specification qualification): Delivering consistent recovered material grades supports off-take qualification and reduces buyer risk, which can be difficult for smaller competitors to replicate at scale.

Competitive benchmarking:

  • Li-Cycle: Focuses on large-scale lithium-ion battery recycling with a broader global operating posture.
  • Redwood Materials: Emphasizes integrated supply-chain development and material recovery scaling across battery manufacturing inputs.
  • Ascend Elements: Develops recycling capacity and material recovery pathways aimed at meeting battery supply requirements.

Compared with these peers, ABAT’s positioning emphasizes U.S. domestic recycling and recovery as a route to serve North American battery supply chains. In practice, competitive outcomes often hinge on who can achieve (a) stable feedstock supply, (b) qualified material output specs, and (c) scale-efficient processing at the lowest net cost per ton of recovered value.

🚀 Multi-Year Growth Drivers

  • EV and battery installed-base growth → scrap availability: The expanding installed base of lithium-ion batteries increases the future volume of end-of-life material for recovery, supporting a larger addressable recycling market over a multi-year horizon.
  • Regulatory pressure toward domestic recycling and traceability: Battery stewardship and sourcing rules increase the attractiveness of certified recycling streams and can improve off-take contracting visibility.
  • Supply-chain localization: Battery manufacturing concentration in North America creates demand for geographically proximate recovered materials to mitigate logistics and sourcing risk.
  • Cost-down through scale and process maturity: Recycling businesses typically see improving economics as yields rise, contamination handling improves, and plant utilization stabilizes.

⚠ Risk Factors to Monitor

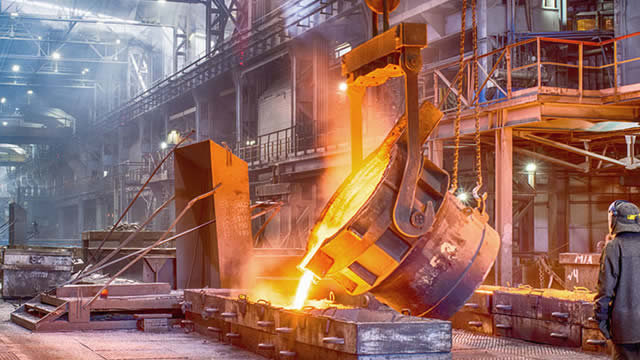
  • Execution and scale risk: Recycling economics are sensitive to throughput, recovery yield, uptime, and permitting. Capacity ramp delays can impair unit economics and financing needs.
  • Feedstock quality and supply volatility: Battery waste streams vary in chemistry and contamination. Weak recovery rates or inconsistent input quality can compress margins.
  • Commodity and spread risk: Recovered material pricing often tracks metal markets; profitability depends on the realized value after processing costs, losses, and purity adjustments.
  • Technology and qualification risk: Meeting battery-grade specifications at scale can take time. Off-take qualification failures or slower certification can limit revenue conversion.
  • Capital intensity and funding risk: Building and operating recycling capacity requires substantial capital. In adverse market conditions, additional financing can dilute equity holders.
  • Competitive scale pressure: Larger or better-capitalized competitors can drive down processing economics via scale and learning-curve advantages.

📊 Valuation & Market View

Markets often value battery recycling and recovered-material businesses using a mix of EV/EBITDA (when operating metrics are visible) and P/S or EV/ton-capacity-style frameworks (for development-stage companies). The valuation sensitivity typically centers on:

  • Unit economics visibility: Recovery yield, quality specs, and operating cost per ton.
  • Utilization and ramp credibility: Contracted throughput and plant stability.
  • Off-take terms: Pricing mechanisms (fixed vs. indexed), qualification timelines, and exclusivity.
  • Cost curve trajectory: Evidence that learning-by-doing reduces costs and increases margins.

Key “needle movers” in this sector are sustained improvements in process outcomes and the transition from development risk to repeatable, contract-backed cash generation.

🔍 Investment Takeaway

ABAT’s long-term investment case rests on the emergence of a U.S.-anchored recycling and recovered-material supply model with potential advantages in feedstock economics, logistical/infrastructure positioning, and process capability that supports battery-grade qualification. The principal diligence focus is whether execution delivers durable yield, qualified output, and scale-efficient cost structure—enabling resilience through commodity cycles and supporting profitable off-take relationships over a multi-year horizon.


⚠ AI-generated — informational only. Validate using filings before investing.

📰 Market News & Coverage

15 Stories Available

Real-time institutional reporting and market updates for ABAT.

seekingalpha.com2026-05-27

American Battery Technology: The First Positive Gross Margin Under The Dilution Treadmill

American Battery Technology (ABAT) achieved its first positive gross margin, signaling operational progress and a milestone since its Reno recycling plant began operations. ABAT's valuation appears attractive, trading below the estimated $617M–$957M EV range, with a Buy rating supported by milestones and options market positioning. Significant near-term revenue is driven by the Moss Landing contract, but sustainability beyond this event remains a key risk unless new contracts are secured.

seekingalpha.com2026-05-12

American Battery Technology Company (ABAT) Q3 2026 Earnings Call Prepared Remarks Transcript

American Battery Technology Company (ABAT) Q3 2026 Earnings Call Prepared Remarks Transcript

globenewswire.com2026-05-11

American Battery Technology Company Announces Record Breaking Revenue and First-Ever Positive Gross Margin in Third Quarter Fiscal 2026 Financial Results

Revenue growth of 64% quarter-over-quarter through ramp-up of critical mineral recycling facility, and significant advancements in development of critical mineral mine and refinery Revenue growth of 64% quarter-over-quarter through ramp-up of critical mineral recycling facility, and significant advancements in development of critical mineral mine and refinery

defenseworld.net2026-04-10

Analyzing American Battery Technology (NASDAQ:ABAT) & XCHG (NASDAQ:XCH)

American Battery Technology (NASDAQ: ABAT - Get Free Report) and XCHG (NASDAQ: XCH - Get Free Report) are both small-cap computer and technology companies, but which is the superior stock? We will contrast the two businesses based on the strength of their valuation, risk, dividends, institutional ownership, analyst recommendations, profitability and earnings. Profitability This table compares American

defenseworld.net2026-03-28

Analyzing American Battery Technology (NASDAQ:ABAT) and Preformed Line Products (NASDAQ:PLPC)

Preformed Line Products (NASDAQ: PLPC - Get Free Report) and American Battery Technology (NASDAQ: ABAT - Get Free Report) are both small-cap computer and technology companies, but which is the superior business? We will contrast the two companies based on the strength of their valuation, analyst recommendations, earnings, risk, institutional ownership, profitability and dividends. Profitability This table

defenseworld.net2026-03-28

China Sun Group High-Tech (OTCMKTS:CSGH) & American Battery Technology (NASDAQ:ABAT) Financial Survey

American Battery Technology (NASDAQ: ABAT - Get Free Report) and China Sun Group High-Tech (OTCMKTS:CSGH - Get Free Report) are both computer and technology companies, but which is the superior business? We will compare the two businesses based on the strength of their valuation, profitability, earnings, dividends, institutional ownership, analyst recommendations and risk. Profitability This table

seekingalpha.com2026-02-08

American Battery Technology: Another Good Quarter Under The Belt

American Battery Technology Company is progressing toward profitability, leveraging large-scale mineral deposits amid the U.S. electrification boom. ABAT benefits from Department of Energy support, including fast-track approvals and development grants, enhancing its strategic positioning. Q4 earnings showed net loss improvement from $13.4M to $9.3M year-on-year, with EPS loss narrowing from $0.18 to $0.07.

globenewswire.com2026-02-06

American Battery Technology Company Announces Record Breaking Revenue as it Ramps Manufacturing of Critical Minerals and Publishes its Second Quarter Fiscal 2026 Financial Results

Quarterly revenue increases over 1,300% YOY while total operating expenses decrease 24% YOY, as company continues to ramp and streamline operational efficiencies Quarterly revenue increases over 1,300% YOY while total operating expenses decrease 24% YOY, as company continues to ramp and streamline operational efficiencies

seekingalpha.com2026-02-05

American Battery Technology Company (ABAT) Q2 2026 Earnings Call Transcript

American Battery Technology Company (ABAT) Q2 2026 Earnings Call Transcript

globenewswire.com2026-02-05

American Battery Technology Company Hosts Second Quarter Fiscal Year 2026 Earnings Call Today

Reno, Nev., Feb. 05, 2026 (GLOBE NEWSWIRE) -- American Battery Technology Company (ABTC) (NASDAQ: ABAT), an integrated critical battery minerals company that is commercializing its internally-developed technologies for both primary battery critical minerals manufacturing and secondary critical minerals lithium-ion battery recycling, expects to release its second quarter fiscal year (FY) financial results on February 5, 2026, and the company will host an earnings call on Thursday, February 5, at 4:30 p.m. ET.

defenseworld.net2025-12-28

American Battery Technology (NASDAQ:ABAT) vs. ESS Tech (NYSE:GWH) Head to Head Review

ESS Tech (NYSE: GWH - Get Free Report) and American Battery Technology (NASDAQ: ABAT - Get Free Report) are both small-cap computer and technology companies, but which is the superior stock? We will compare the two companies based on the strength of their earnings, dividends, profitability, analyst recommendations, valuation, risk and institutional ownership. Institutional and Insider Ownership

seekingalpha.com2025-12-18

American Battery Technology: No News Is Good News

American Battery Technology Company (ABAT) offers exposure to U.S. battery metals and recycling, with significant lithium assets and DOE/EXIM government support as key catalysts. ABAT's Q3 revenues surged 364% to $937,000, but the company remains in investment mode, posting a $10.3M net loss and requiring further capital by mid-2026. Recent volatility followed the DOE's withdrawal of a $57.7M grant; reinstatement or EXIM loan approval could trigger a sharp stock rebound.

globenewswire.com2025-12-03

ABAT Investors Have Opportunity to Join American Battery Technology Company Fraud Investigation with the Schall Law Firm

LOS ANGELES, Dec. 03, 2025 (GLOBE NEWSWIRE) -- The Schall Law Firm, a national shareholder rights litigation firm, announces that it is investigating claims on behalf of investors of American Battery Technology Company (“American Battery” or “the Company”) (NASDAQ: ABAT) for violations of the securities laws. The investigation focuses on whether the Company issued false and/or misleading statements and/or failed to disclose information pertinent to investors.

globenewswire.com2025-11-26

ABAT Investors Have Opportunity to Join American Battery Technology Company Fraud Investigation with the Schall Law Firm

LOS ANGELES, Nov. 26, 2025 (GLOBE NEWSWIRE) -- The Schall Law Firm, a national shareholder rights litigation firm, announces that it is investigating claims on behalf of investors of American Battery Technology Company (“American Battery” or “the Company”) (NASDAQ: ABAT) for violations of the securities laws. The investigation focuses on whether the Company issued false and/or misleading statements and/or failed to disclose information pertinent to investors.

globenewswire.com2025-11-19

ABAT Investors Have Opportunity to Join American Battery Technology Company Fraud Investigation with the Schall Law Firm

LOS ANGELES, Nov. 19, 2025 (GLOBE NEWSWIRE) -- The Schall Law Firm, a national shareholder rights litigation firm, announces that it is investigating claims on behalf of investors of American Battery Technology Company (“American Battery” or “the Company”) (NASDAQ: ABAT) for violations of the securities laws. The investigation focuses on whether the Company issued false and/or misleading statements and/or failed to disclose information pertinent to investors.

📊 AI Financial Analysis

Powered by StockMarketInfo
Earnings Data: Q Ending 2026-03-31

"ABAT reported Q3’26 results with Revenue of $7.81M and Net Income of -$33.84M (EPS: -$0.26). On a YoY basis (vs Q3’25), Revenue grew sharply (+696.9%) while Net Income losses narrowed (Net Income improved from -$11.50M to -$33.84M is actually a worsening; i.e., losses expanded). On a QoQ basis (vs Q2’26), Revenue increased (+64.0%) but profitability deteriorated (Net Income from -$9.28M to -$33.84M). Profitability remains weak: the net margin was -4.33% in the latest quarter, improving relative to the prior year’s net margin (-11.73%) but not enough to generate positive earnings. Gross profit was $0.74M with a gross margin of ~9.4%, moving from negative gross profit in earlier quarters (evidence of some gross-level improvement), yet operating losses remain substantial due to high operating expenses. Cash flow was also pressured. Operating cash flow was -$2.67M and free cash flow was -$0.48M. The balance sheet is a key positive: cash-and-cash-equivalents rose to $37.7M, and total equity was $112.8M, indicating resilience despite accumulated retained losses. Total shareholder return appears strong given price momentum: the stock is up +217.8% over 1 year (dividends/buybacks are not evident in the data provided). Analyst consensus price target is $6 with the current price at $3.40, implying upside in valuation expectations."

Revenue Growth

Positive

Revenue rose QoQ from $4.76M to $7.81M (+64.0%) and surged YoY from $0.98M to $7.81M (+696.9%), indicating a strong top-line acceleration into the latest quarter.

Profitability

Neutral

Margins remain unprofitable. Net income worsened QoQ (-$9.28M to -$33.84M) and, while net margin improved vs YoY (-11.73% to -4.33%), the company is still generating large operating losses and negative EPS (EPS -$0.26).

Cash Flow Quality

Caution

Operating cash flow was negative (-$2.67M) and free cash flow was negative (-$0.48M). No dividend payments were recorded; cash burn is present but not catastrophically large versus the growing cash balance.

Leverage & Balance Sheet

Positive

Balance sheet resilience is a relative strength: cash increased to $37.7M and equity remains substantial at $112.8M, with very low debt (short-term debt and long-term debt are minimal; total debt ~ $0.09M).

Shareholder Returns

Positive

Strong capital appreciation signals market momentum: 1-year price change is +217.8% (well above the 20% threshold). Dividend yield is 0% in provided data, and buybacks are not evident in cash flow.

Analyst Sentiment & Valuation

Caution

Consensus target of $6 vs current ~$3.40 suggests potential upside, but valuation support is fragile given ongoing deep losses and negative operating cash flow.

Disclaimer:This analysis is AI-generated for informational purposes only. Accuracy is not guaranteed and this does not constitute financial advice.

Fundamentals Overview

Loading fundamentals overview...

Management is clearly upbeat on operational traction: the first recycling plant generated ~$4.8M product revenue plus ~$0.3M interest income (~$5.1M total) in the quarter ended December, nearly matching ~$4.9M cash expenses (and ~$6.4M including noncash items), which they frame as “passing breakeven” and enabling margin growth. Balance sheet strength is also emphasized—cash ~ $48.7M and “0 debt” after paying off convertible notes. However, the only explicit Q&A item was the $30M EPA cleanup agreement ramp-up tied to Moss Landing. Management answered that they’ve already received material since the end of summer and remain “on pace” for substantially more, but provided no quantified throughput ramp, timing, or risk mitigation beyond relying on additional feed sources (stationary BESS, automotive, consumer electronics). Overall tone is optimistic, but analyst pressure appears focused on execution timing for feed and regulatory-driven commercialization—areas where the transcript provides limited hard metrics.

AI IconGrowth Catalysts

  • Recycling plant ramp-up: generated about $4.8M product sales in the quarter ending December (plus $0.3M interest income)
  • Passing breakeven on the first recycling plant and targeting continued margin expansion as the plant scales
  • Increasing feed inflows from stationary grid BESS and automotive sectors (stationary share rising versus prior periods)
  • Regulatory/compliance milestone: received CERCLA certification enabling additional types of waste streams

Business Development

  • Named EPA cleanup agreement: $30 million EPA cleanup agreement tied to the Moss Landing project (Northern California)
  • FAST-41 Permitting Council liaison assigned to accelerate federal permits for Tonopah Flats Lithium Project
  • Partnership-driven closed-loop supply chain receiving waste streams/end-of-life material from partners across the economy

AI IconFinancial Highlights

  • Quarter ending December: ~$4.8M revenue (product sales) + ~$0.3M interest income = ~$5.1M total revenue & interest income highlighted
  • Operating costs: ~$4.9M cash expenses to operate the first recycling plant in the same corresponding period; ~$6.4M including noncash costs (depreciation + stock-based compensation)
  • Cash flow/breakeven positioning: revenue + interest income is described as “very close” to cash costs required to run the plant
  • Scale vs prior baseline: ramp generated more revenue in the December quarter than the previous 4 quarters combined (management states “more revenue generated in this quarter ending December than the previous 4 combined”)
  • Balance sheet: cash balance up to ~$48.7M by end of quarter in December; separately stated cash balance used to reflect investments up to about $47.9M
  • Leverage reset: paid off remaining debt/convertible notes and reports “0 debt” as of now

AI IconCapital Funding

  • Cash: ~$48.7M end of quarter in December (also referenced ~$47.9M after additional investments)
  • No debt / convertible notes remaining (0 debt reported)
  • Shareholder warrant exercises cited as a driver of cash increase (no dollar amount specified)

AI IconStrategy & Ops

  • First recycling facility: additional ramp-up operations and additional value-add processes planned as margins expand toward/after breakeven
  • Second recycling facility: design and construction underway in the Southeast U.S.; team members working with local partners/strategic partners
  • Tonopah Flats Lithium Project: progressing through Definitive Feasibility Study (DFS) after completing PFS; NEPA process underway with Department of Interior and Department of Energy
  • Federal permitting acceleration: FAST-41 priority project status with weekly liaison/meetings to drive permits forward

AI IconMarket Outlook

  • Guidance numbers/dates: none provided in the transcript
  • Timing signal: DFS “published shortly” (management expectation, no specific date given)
  • EPA cleanup material ramp: still on pace to receive substantially more material from Moss Landing

AI IconRisks & Headwinds

  • Operational hurdle (implied, not quantified): ramp-up feed dependency across multiple sources (Moss Landing plus stationary/automotive/consumer electronics) suggests supply continuity is critical
  • Regulatory/permitting dependency: progress contingent on NEPA and federal permit advancement through FAST-41 and relevant agencies

Sentiment: MIXED

Note: This summary was synthesized by AI from the ABAT Q2 2026 earnings transcript. Financial data is complex; please verify all metrics against official SEC filings before making investment decisions.

📋 Official Regulatory 10-K / 10-Q SEC Filings

Direct authenticated documentation links to audited SEC database reports for ABAT.

SEC EDGAR Live Feed
Loading financial data and tables...
📁

SEC Filings (ABAT)

© 2026 Stock Market Info — American Battery Technology Company Common Stock (ABAT) Financial Profile