Aehr Test Systems

Aehr Test Systems (AEHR) Market Cap

Aehr Test Systems has a market capitalization of $3.10B.

Price: $98.45

-18.13 (-15.55%)

Market Cap: 3.10B

NASDAQ · time unavailable

CEO: Gayn Erickson

Sector: Technology

Industry: Semiconductors

IPO Date: 1997-08-15

Website: https://www.aehr.com

Aehr Test Systems (AEHR) - Company Information

Market Cap: 3.10B|Sector: Technology

Company Profile

Aehr Test Systems provides test systems for burning-in and testing logic, optical, and memory integrated circuits worldwide. It offers products, such as the ABTS and FOX-P families of test and burn-in systems and FOX WaferPak Aligner, FOX-XP WaferPak Contactor, FOX DiePak Carrier, and FOX DiePak Loader. The ABTS system is used in production and qualification testing of packaged parts for lower power and higher power logic devices, as well as various common types of memory devices. The FOX-XP and FOX-NP systems are wafer contact and singulated die/module test and burn-in systems used for burn-in and functional test of complex devices, such as memories, digital signal processors, microprocessors, microcontrollers, systems-on-a-chip, and integrated optical devices. The FOX-CP system is a single-wafer compact test and reliability verification solution for logic, memory, and photonic devices. The WaferPak Contactor contains a unique full wafer probe card capable of testing wafers up to 300mm that enables IC manufacturers to perform test and burn-in of full wafers on Aehr Test FOX systems. The DiePak Carrier is a reusable, temporary package that enables IC manufacturers to perform final test and burn-in of bare die and modules. Aehr Test Systems was incorporated in 1977 and is headquartered in Fremont, California.

Analyst Sentiment

60%
Buy

From 4 Active Polls

1Y Forecast: $62.00

▼ -37.0% Potential Upside

Consensus Target Metrics

Low Bound

$56

Median

$62

High Bound

$68

Average

$62

Price & Moving Averages

Loading chart...

🎯 Wall Street Analyst Intelligence Report

1-Year structural target targets, chart projections, and sentiment maps.

Average 1Y Target
$62.00
▼ -37.02% Upside
Low Target
$56.00
-43% Risk
Median Target
$62.00
-37% Mid
High Target
$68.00
-31% Max
Consensus
Hold
1 / 3 Buys

Consensus Trend Projection

Trailing closures vs. 12-month metrics map.

Analyst Vote Distribution

Aggregate institutional coverage sentiment weights.

📊 Historical Valuation Multiples

Real-time Trailing Twelve Month (TTM) momentum side-by-side with discrete quarterly metrics.

Fiscal QuarterTTMQ1 2026Q4 2025Q3 2025Q2 2025Q1 2025Q4 2024Q3 2024Q2 2024
Period EndingTrailing 12MFeb 27, 2026Nov 28, 2025Aug 29, 2025May 30, 2025Feb 28, 2025Nov 29, 2024Aug 30, 2024May 31, 2024
Market Cap ($M)3,0971,149690747285287353443333
Enterprise Value ($M)3,0701,122670734270263326412290
Price to Earnings Ratio (P/E)-264.71-89.67-53.42-89.56-24.54-111.44-85.76167.703.49
Price/Earnings-to-Growth Ratio (PEG)-20.66-3.09-33.690.03
Price to Sales Ratio (P/S)68.42111.4069.8368.0620.1915.6626.2133.7520.08
Price to Book Ratio (P/B)21.778.285.286.102.322.312.863.612.99
Price to Free Cash Flow Ratio (P/FCF)-267.57-392.52-372.50-446.25-55.57-87.90-56.93202.80282.89
Enterprise Value to Sales (EV/Sales)108.8067.7466.9619.1714.3624.2331.3717.49
Enterprise Value to EBITDA (EV/EBITDA)-226.31-265.32-150.67-251.11-137.397513.00-926.16298.2683.06
Debt to Equity Ratio1.980.070.080.090.090.050.050.050.06
⚠️

Valuation Model Suspended

API Payload Error: Inverted or negative baseline Free Cash Flow margin detected (-5.1%).

Troubleshooting Notice: The upstream financial data supplier has uploaded corrupted or inverted baseline metrics for AEHR. The server sandbox cannot calculate an intrinsic value path from negative cash generation baselines.

📘 Full Research Report

ℹ️

AI-Generated Research: This report is for informational purposes only.

📘 AEHR TEST SYSTEMS (AEHR) — Investment Overview

🧩 Business Model Overview

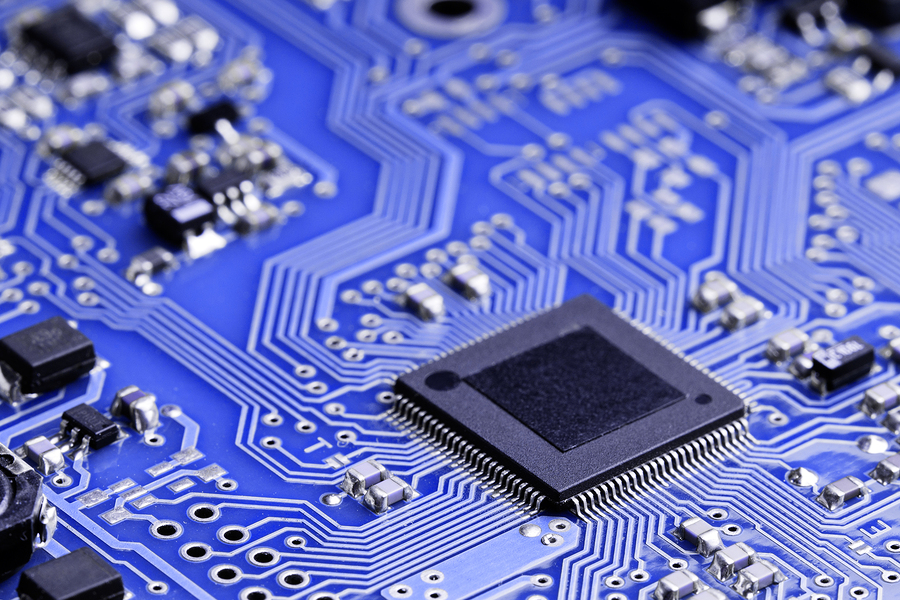
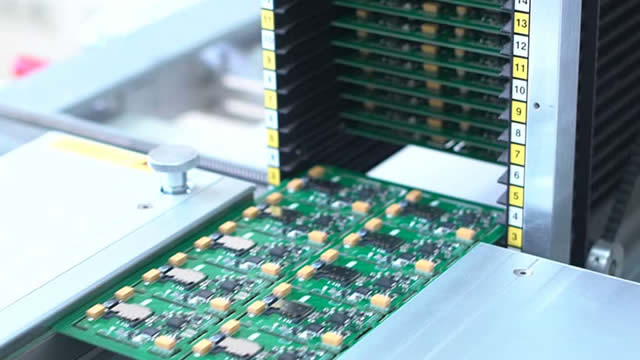
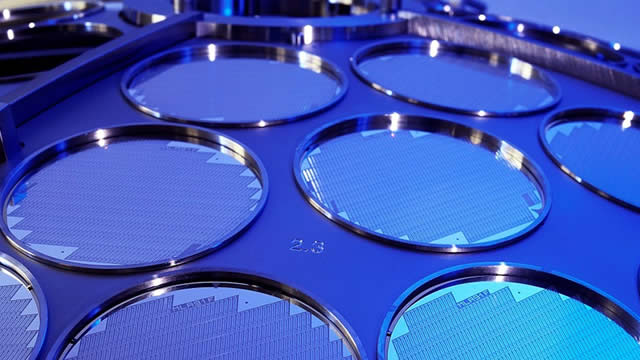
AEHR Test Systems designs and manufactures automated test systems used in semiconductor device verification, including reliability-focused workflows such as burn-in and high-speed production testing. The company sells complex, application-specific platforms to semiconductor manufacturers and outsourced semiconductor assembly & test (OSAT) providers. In practice, AEHR’s value chain spans (1) engineering-led system design aligned to device characteristics and test requirements, (2) hardware and control-system integration, (3) installation and qualification with customer processes, and (4) ongoing service/support and system upgrades. Customer adoption tends to be “stickier” than typical standalone industrial equipment because test systems must be integrated into a customer’s characterization flow, software environment, and manufacturing controls.

💰 Revenue Streams & Monetisation Model

AEHR’s monetisation primarily comes from:
  • System sales (transactional): One-time revenue tied to new test capacity, technology transitions, and qualification cycles.
  • Service and maintenance (more recurring): Support, preventive maintenance, spares, and maintenance programs that sustain uptime and protect test performance.
  • Upgrades / engineering add-ons (opportunistic recurring component): Enhancements to match evolving device requirements, higher throughput needs, or reliability/test coverage improvements.
Margin drivers: System gross margins are influenced by product mix, complexity of the application engineering, and manufacturing leverage. Service and maintenance typically carry comparatively steadier contribution margins due to installed-base coverage, making the installed base an important driver of earnings quality over time.

🧠 Competitive Advantages & Market Positioning

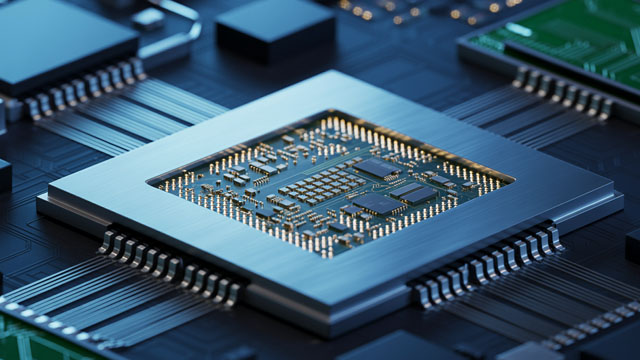
AEHR’s most tangible moat is high switching costs driven by integration and qualification requirements, combined with technical know-how embedded in custom test system configurations.
  • High switching costs (test program + process integration): Once a platform is qualified for a specific device family and production flow, customers incur meaningful costs to validate new systems—both in engineering time and in manufacturing disruption risk.
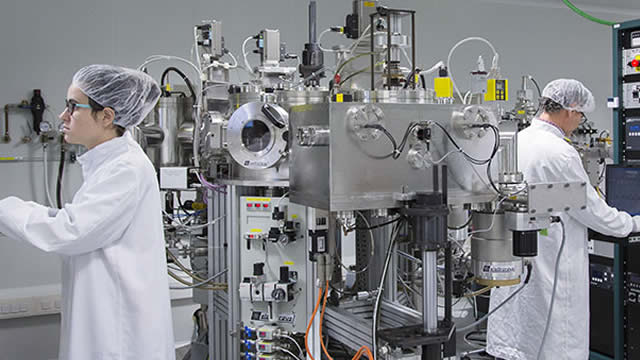
  • Installed-base learning and know-how: AEHR’s repeated deployment across device/test types supports iterative improvements in throughput, reliability workflows, and system configuration efficiency.
  • IP and engineering barriers: Test systems rely on specialized architecture and control/measurement methods; these create friction for entrants attempting to match performance across multiple device generations.
Competitive benchmarking:
  • Teradyne: Broad ATE portfolio across multiple semiconductor end markets, often competing on scale and platform breadth.
  • Advantest: Large-scale tester platforms with extensive coverage across wafer sort and production test use cases.
  • FormFactor: While not a direct “system” peer for AEHR’s specific reliability/test platform niche, it competes for critical test-adjacent subsystems (notably probe-related technologies), reflecting how competitors can influence the testing stack.
Positioning contrast: AEHR generally emphasizes tailored test systems for demanding reliability/production needs where integration, speed-to-qualification, and application-specific performance matter. Larger ATE players often compete more aggressively where customers want broad platform consolidation; AEHR’s differentiation tends to be most visible when device characteristics and test throughput/reliability requirements favor a specialized solution with faster engineering iteration and lower integration risk.

🚀 Multi-Year Growth Drivers

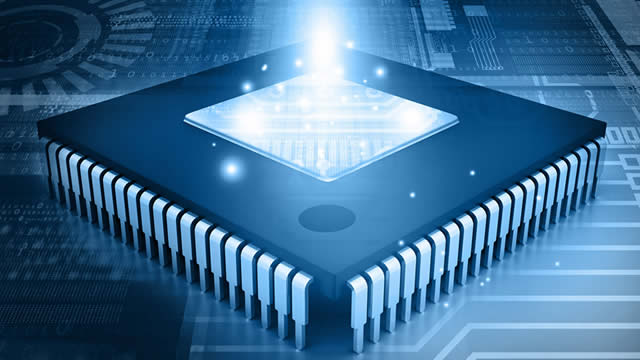
Key secular drivers that can expand AEHR’s addressable market over a 5–10 year horizon include:
  • Semiconductor content growth and device complexity: More sophisticated memory and logic designs increase the amount and complexity of test and reliability validation per unit.
  • Reliability and burn-in intensity: As feature sizes and operating conditions become more demanding, ensuring stable performance increases the importance of structured reliability workflows.
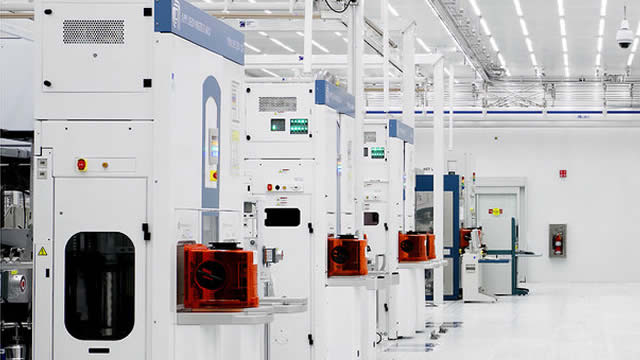
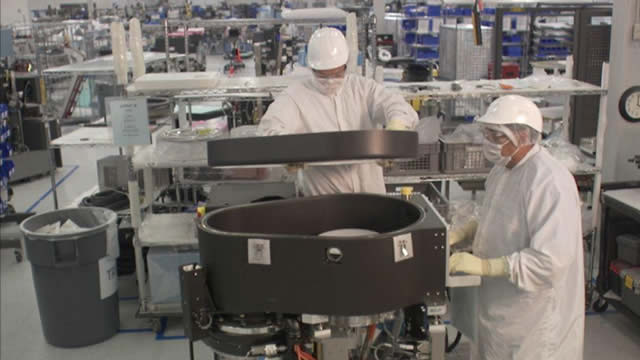
  • Outsourcing and capacity dispersion: OSAT participation and regional manufacturing strategies can require incremental test capacity, new system qualifications, and upgrades.
  • Technology transitions and throughput upgrades: Device generation changes and process shrinks typically trigger test-system requalification and performance upgrades, supporting the services and upgrade revenue stream.
The practical implication: AEHR’s TAM expands not only with semiconductor volume, but also with the frequency of device transitions that require new or upgraded test capability.

⚠ Risk Factors to Monitor

  • Semiconductor equipment cyclicality: Test system purchases are tied to customer capex cycles; demand can weaken when memory/logic investment budgets compress.
  • Qualification timelines and backlog quality: System revenue depends on customer engineering acceptance and factory readiness; delays can shift revenue recognition even when demand exists.
  • Technological evolution in test requirements: Changes in device physics, test coverage expectations, or measurement approaches may require continuous engineering investment and platform updates.
  • Competitive pressure from larger ATE providers: Competitors with broader installed bases may offer bundled solutions or aggressive pricing when customers pursue platform consolidation.
  • Concentration risk: Exposure to a limited set of major customer programs can increase volatility in system demand and service utilization.

📊 Valuation & Market View

AEHR is typically valued by equity markets as a semiconductor capital equipment and service-enabled industrial technology company. Common approaches include:
  • EV/EBITDA for assessing operating leverage once utilization improves, driven by gross margin stability and operating expense discipline.
  • P/S for capturing platform growth expectations where profitability is impacted by cycle-related volume swings.
Drivers that move the needle: investor focus generally centers on backlog visibility, conversion of backlog to recognized revenue, gross margin durability across system mix, and the resilience/expansion of service-related revenue linked to the installed base.

🔍 Investment Takeaway

AEHR’s long-term investment appeal rests on integration-driven switching costs and engineering-led specialization in high-demand reliability/production test workflows. While end-market cyclicality is a structural feature of semiconductor equipment, the installed base supports a pathway for steadier service and upgrade contribution, and qualification-driven adoption can provide durability versus competitors offering more generalized platforms.

⚠ AI-generated — informational only. Validate using filings before investing.

📰 Market News & Coverage

15 Stories Available

Real-time institutional reporting and market updates for AEHR.

benzinga.com2026-06-03

These ETFs Owned Russell 2000's Biggest Winners Before They Soared 400%+ In 2026

Investors searching for the biggest stock winners of 2026 may be surprised to learn they already own some of them through small-cap ETFs.

zacks.com2026-06-01

Are Computer and Technology Stocks Lagging Aehr Test Systems (AEHR) This Year?

Here is how Aehr Test Systems (AEHR) and Cisco Systems (CSCO) have performed compared to their sector so far this year.

accessnewswire.com2026-05-28

Aehr Test Systems to Present at William Blair 46th Annual Growth Stock Conference on June 2

FREMONT, CA / ACCESS Newswire / May 28, 2026 / Aehr Test Systems (NASDAQ:AEHR), a leading provider of test and burn-in solutions for semiconductor devices used in artificial intelligence (AI), silicon photonics, data center, automotive, and industrial applications, today announced that that President and CEO Gayn Erickson and CFO Chris Siu will be presenting at the William Blair 46th Annual Growth Stock Conference in Chicago on Tuesday, June 2 at 4:40pm CT (2:40pm PT)and will be meeting with institutional investors throughout the day. You may register to access a live or replay audio webcast of the presentation via a link posted to the investor relations section of Aehr's website at www.aehr.com or by clicking here.

fool.com2026-05-26

Here's Why Aehr Test Systems Popped Higher Today

The AI infrastructure sector received more good news today, which reads well for Aehr Test Systems.

accessnewswire.com2026-05-21

Aehr Test Systems to Participate in the 23rd Annual Craig-Hallum Institutional Investor Conference on May 28

FREMONT, CA / ACCESS Newswire / May 21, 2026 / Aehr Test Systems (NASDAQ:AEHR), a leading provider of test and burn-in solutions for semiconductor devices used in artificial intelligence (AI), silicon photonics, data center, automotive, and industrial applications, today announced that CFO Chris Siu will be participating in one-on-one meetings with institutional investors at the 23rd Annual Craig-Hallum Institutional Investor Conference taking place Thursday, May 28, 2026 at the Depot Renaissance Hotel in Minneapolis. For additional information, or to schedule a meeting with Aehr Test Systems, please contact your Craig-Hallum representative, or Aehr's investor relations firm, PondelWilkinson, Inc., at jbyers@pondel.com.

zacks.com2026-05-15

Is Aehr Test Systems (AEHR) Stock Outpacing Its Computer and Technology Peers This Year?

Here is how Aehr Test Systems (AEHR) and Cisco Systems (CSCO) have performed compared to their sector so far this year.

gurufocus.com2026-05-13

A Look at Aehr Test Systems (AEHR) After 6.8% Gain -- GF Value $13.57 vs Price $103.23

On May 13, 2026, Aehr Test Systems (AEHR) shares rose 6.8% today, bringing the current price to $103.23. The stock has seen a remarkable price performance, rang

fool.com2026-05-08

Meet the Super Semiconductor Stock Obliterating Nvidia, AMD, and Broadcom Right Now

Aehr Test Systems stock is up some 327% year to date.

fool.com2026-05-05

How Aehr Test Systems Stock Rose 144% Last Month

Aehr's unfilled orders nearly doubled year over year to $38.7 million by the end of Q3. A record $41 million order from an unnamed hyperscale AI customer added fuel to the rally.

zacks.com2026-04-30

Are You Looking for a Top Momentum Pick? Why Aehr Test Systems (AEHR) is a Great Choice

Does Aehr Test Systems (AEHR) have what it takes to be a top stock pick for momentum investors? Let's find out.

fool.com2026-04-29

Is Aehr Test Systems Stock a Buy or Sell After Hedge Fund Halter Ferguson Dumped Shares Worth $20 Million?

Aehr Test Systems delivers proprietary test and burn-in solutions to semiconductor manufacturers worldwide.

fool.com2026-04-27

Aehr Test Systems Founder Sold Shares Worth $1.8 Million. Should Investors Avoid the Stock?

This semiconductor test equipment provider, up over 1,000% in a year, just reported a notable insider sale in its latest SEC filing.

marketbeat.com2026-04-22

Aehr Test Systems: Small AI Stock Sees Record AI Hyperscaler Order

The small semiconductor stock Aehr Test Systems NASDAQ: AEHR is generating increasing interest from customers and investors alike in 2026. On the year, Aehr has now soared more than 350%, making it one of the best performers in the entire U.S. stock market.

fool.com2026-04-19

An Aehr Test Systems Director Sold 8,000 Shares. Here's What That Means for Investors.

Director Fariba Danesh sold 8,000 shares for a transaction value of approximately ~$661K on April 16, 2026. The transaction represented 37.8% of Danesh's direct holdings, reducing direct ownership from 21,143 to 13,143 shares.

defenseworld.net2026-04-19

Fariba Danesh Sells 8,000 Shares of Aehr Test Systems (NASDAQ:AEHR) Stock

Aehr Test Systems (NASDAQ: AEHR - Get Free Report) Director Fariba Danesh sold 8,000 shares of the business's stock in a transaction on Thursday, April 16th. The stock was sold at an average price of $82.63, for a total value of $661,040.00. Following the sale, the director owned 13,143 shares in the company, valued at approximately

📊 AI Financial Analysis

Powered by StockMarketInfo
Earnings Data: Q Ending 2026-02-27

"AEHR reported Revenue of $10.31M and Net Income of -$3.20M (EPS -0.10) in the latest quarter. On a QoQ basis, Revenue increased from $9.88M to $10.31M (+4.3%), while the loss slightly improved from -$3.23M to -$3.20M (net income margin roughly -31% vs. ~-33%). However, over the broader 4-quarter window, Revenue has been volatile and generally lower than the peak quarter (down from $14.09M in 2025-05-30 to $10.31M in 2026-02-27). Profitability remains weak: losses persist and EPS stays negative throughout, with no sustained margin expansion—net margins improved versus 2025-11-28 but are far from breakeven. Cash flow is consistently negative. Free Cash Flow was -$3.55M in the latest quarter, down from -$1.85M QoQ, indicating deterioration in near-term cash generation. On the balance sheet, Total Assets rose QoQ (to $157.0M) and Equity increased to $138.8M, supporting resilience. Net Debt remains negative (net cash position improved to -$26.9M). Total shareholder returns are exceptionally strong: the stock is up +782.2% over 1 year, which materially boosts the overall score despite fundamental cash burn. Analyst targets (consensus ~$62) are below the current price (~$73.22), implying limited upside unless operating momentum improves."

Revenue Growth

Fair

QoQ Revenue rose +4.3% (from $9.88M to $10.31M). Over the 4-quarter span, Revenue is volatile and below the prior peak ($14.09M in 2025-05-30). YoY growth could not be computed from the provided data because the same quarter last year is not included.

Profitability

Neutral

Net income remains negative in all quarters. Latest net margin is ~-31% and slightly improved vs. the prior quarter (from ~-33%), but margins are not on a clear improving trajectory across the 4-quarter period.

Cash Flow Quality

Neutral

Free Cash Flow is negative each quarter; latest FCF worsened to -$3.55M vs. -$1.85M QoQ. No dividends or buybacks are indicated.

Leverage & Balance Sheet

Positive

Total Assets and Equity increased QoQ (assets: $148.7M to $157.0M; equity: $130.8M to $138.8M). Net Debt remains negative (net cash), improving to -$26.9M.

Shareholder Returns

Excellent

Strong price momentum: +782.2% 1-year change, with no dividend support required. Capital appreciation dominates total return.

Analyst Sentiment & Valuation

Caution

Consensus target (~$62) is below the current price ($73.22), suggesting the stock is trading above analyst expectations absent renewed fundamental momentum.

Disclaimer:This analysis is AI-generated for informational purposes only. Accuracy is not guaranteed and this does not constitute financial advice.

Fundamentals Overview

Loading fundamentals overview...

AEHR delivered a step-change in near-term demand visibility in Q3 FY26, highlighted by $37.2M bookings and record effective backlog of $50.9M (Q3 backlog $38.7M plus $12.2M captured in the first 5 weeks of Q4). Revenue was still $10.3M and down 44% YoY due to delayed shipments and weaker wafer-level FOX/WaferPak volume, which also drove gross margin to 36.5% from 42.7%. Offsetting the quarter’s accounting softness, management secured multiple production and follow-on wins: a $14M FOX-XP follow-on for an AI accelerator customer, a major hyperscale silicon photonics customer order scheduled to ship by the fiscal quarter ending May 29, 2026, and additional silicon photonics FOX-XP automation upgrades; plus continued GaN partner momentum and a new Taiwan silicon carbide (EV) qualification/production order. Outlook tightens around higher second-half bookings ($60M–$80M high side) and FY26 revenue $45M–$50M high end, with gross margin improvement expected as manufacturing scales (Sonoma capacity +>20 systems/month). Key execution watch items include WaferPak redesign timing for benchmark evaluations and adoption variability across device types.

AI IconGrowth Catalysts

  • Wafer-level burn-in momentum for AI/data center infrastructure; book-to-bill >3.5x
  • Received $14M follow-on production order from lead wafer-level AI accelerator processor customer for multiple fully automated FOX-XP wafer-level burn-in systems
  • Major silicon photonics customer win: initial order for multiple high-power FOX-XP wafer-level burn-in systems (engineering qualification + high-volume production) with shipments scheduled in fiscal fourth quarter ending May 29, 2026
  • Follow-on silicon photonics order for high-power FOX-XP system plus upgrade of an existing system to latest high-power fully automated configuration (lights-out operation with customer autonomous-guided robots)
  • GaN partnership continuation; working with lead GaN production customer on new devices with wafer-level burn-in on silicon
  • New silicon carbide customer win (Taiwan-based) for qualification + production on small configured FOX-XP system

Business Development

  • Lead wafer-level AI accelerator processor customer: $14M follow-on production order for FOX-XP + WaferPak auto-aligners and FOX WaferPak full wafer contactors
  • Major new silicon photonics customer (hyperscale data center optical interconnect): initial order for multiple high-power FOX-XP systems + FOX-NP systems + WaferPak auto-aligners/contactors; additional forecast for XP production systems into next calendar year
  • Lead silicon photonics customer: follow-on order for new high-power FOX-XP system + upgrade to latest fully automated configuration
  • Lead GaN production customer: ongoing partnership; wafer-level burn-in for qualification and production
  • Silicon carbide customer in Taiwan (EV-focused; greater China EV market): small configured FOX-XP system order for qualification and production

AI IconFinancial Highlights

  • Bookings: $37.2M in Q3 vs $6.2M in Q2 (and vs $6.2M in prior period cited by CFO); book-to-bill ratio exceeded 3.5x; effective backlog record $50.9M (Q3 backlog $38.7M plus $12.2M bookings in first 5 weeks of Q4)
  • Q3 revenue: $10.3M, in line with internal expectations but slightly below consensus; down 44% YoY from $18.3M (delay-driven shipments)
  • Revenue mix: Contactor revenues (includes WaferPaks) $3.0M = 29% of total revenue vs $5.9M or 32% in Q3 prior year
  • Non-GAAP gross margin: 36.5% vs 42.7% prior year (YoY decline from lower sales volume and less favorable mix; prior year had higher proportion of high-margin WaferPak revenue)
  • Non-GAAP operating expenses: $6.3M flat YoY
  • Tax: recorded $0.8M income tax benefit; effective tax rate 19.9%
  • Non-GAAP net loss: $1.5M or -$0.05 diluted/share; compared to net income $2.0M or $0.07 diluted/share in Q3 FY25; exceeded consensus by $0.02
  • Q3 operating cash flow: -$3.7M; cash/cash equivalents/restricted cash ended $37.1M (up from $31M at Q2) primarily from ATM proceeds

AI IconCapital Funding

  • ATM equity program: raised $10.5M gross proceeds in Q3 via ~269k shares; raised another $19.5M gross since Q3 via ~477k shares; used $40M available under ATM; sold >1.13M shares at average price $35.38
  • No debt level or buyback disclosed in provided transcript

AI IconStrategy & Ops

  • Manufacturing scale-up: begin shipping Sonoma systems from a current contract manufacturer adding capacity of >20 additional Sonoma systems per month (effective described as 'this quarter')
  • Terminology shift: management attempting to reframe 'packaged part burn-in' to 'package-level burn-in'
  • Wafer-level AI benchmark/memory: continuing investment; wafer-level burn-in WaferPak clock-configuration misunderstanding caused delays—redesigning WaferPaks and collecting device data on current and improved designs over coming months
  • Automation detail: silicon photonics customer uses autonomous-guided robots to carry 300mm FOUPs for fully lights-out operation; included WaferPak auto-aligners and integrated auto-aligner configuration

AI IconMarket Outlook

  • Fiscal 2026 revenue guidance: high end of $45M to $50M (restated); non-GAAP net loss per diluted share between -$0.13 and -$0.09
  • Second-half bookings guidance (restated): high side of $60M to $80M
  • Expected return to non-GAAP profitability in Q4 FY26
  • Management expects fiscal year ending May 29, 2026 to exit with strong backlog enabling significant FY27 revenue growth
  • Additional wafer-level burn-in/FOX systems shipping timing: silicon photonics systems scheduled to ship in fiscal fourth quarter ending May 29, 2026
  • Investor events: Craig Hallum Institutional Investor Conference May 28 (Minneapolis); William Blair 46th Annual Growth Conference June 2 (Chicago)
  • Fiscal calendar change: fiscal 2027 begins June 27, 2026 and ends June 25, 2027 (4-4-5 calendar); transition month May 30–June 26, 2026 will be reported as a transition period

AI IconRisks & Headwinds

  • Benchmark evaluation delay: WaferPak design issues due to clock-configuration misunderstanding; redesigning and providing additional data over next several months
  • Conservative stance on silicon carbide revenue timing: not yet counting on significant revenue return yet despite EV OEM ramp catalysts
  • Q3 revenue softness due to delayed orders; shipment-driven decline (down 44% YoY)
  • Gross margin pressure YoY: 36.5% vs 42.7% from lower volume and less favorable mix
  • Non-benchmark production burn-in adoption varies by device/SKU: management estimates much of market still not doing production burn-in (ASICs ~5% by unit/SKU; AI accelerators maybe ~half), implying adoption is uneven

Sentiment: POSITIVE

Note: This summary was synthesized by AI from the AEHR Q3 2026 (fiscal quarter ended ~Mar 2026; call dated 2026-04-07) earnings transcript. Financial data is complex; please verify all metrics against official SEC filings before making investment decisions.

📋 Official Regulatory 10-K / 10-Q SEC Filings

Direct authenticated documentation links to audited SEC database reports for AEHR.

SEC EDGAR Live Feed
No recent 10-K available.
No recent 10-Q available.
Loading financial data and tables...
📁

SEC Filings (AEHR)

© 2026 Stock Market Info — Aehr Test Systems (AEHR) Financial Profile