Alamo Group Inc.

Alamo Group Inc. (ALG) Market Cap

Alamo Group Inc. has a market capitalization of $1.82B.

Price: $149.37

-2.31 (-1.52%)

Market Cap: 1.82B

NYSE · time unavailable

CEO: Robert Hureau

Sector: Industrials

Industry: Agricultural - Machinery

IPO Date: 1993-03-19

Website: https://www.alamo-group.com

Alamo Group Inc. (ALG) - Company Information

Market Cap: 1.82B|Sector: Industrials

Company Profile

Alamo Group Inc. designs, manufactures, distributes, and services vegetation management and infrastructure maintenance equipment for governmental, industrial, and agricultural uses worldwide. Its Vegetation Management Division segment offers hydraulically-powered and tractor-mounted mowers, other cutters and replacement parts for heavy-duty and intensive uses and heavy duty applications, tractor- and truck-mounted mowing and vegetation maintenance equipment, and replacement parts. This segment also provides rotary and finishing mowers, flail and disc mowers, front-end loaders, backhoes, rotary tillers, posthole diggers, scraper blades and replacement parts, zero turn radius mowers, cutting parts, plain and hard-faced replacement tillage tools, disc blades, and fertilizer application components; aftermarket agricultural parts, heavy-duty mechanical rotary mowers, snow blowers, rock removal equipment, replacement parts, tractor attachments, agricultural implements, hydraulic and boom-mounted hedge and grass cutters, tractor attachments and implements, hedgerow cutters, industrial grass mowers, agricultural seedbed preparation cultivators, self-propelled sprayers and multi-drive load-carrying vehicles, cutting blades, and hydraulic and mechanical boom mowers. The company's Industrial Equipment Division segment offers truck-mounted air vacuum, mechanical broom, and regenerative air sweepers, pothole patchers, leaf collection equipment and replacement brooms, parking lot and street sweepers, excavators, catch basin cleaners, and roadway debris vacuum systems, as well as truck-mounted vacuum machines, combination sewer cleaners, and hydro excavators. This segment also offers ice control products, snowplows and heavy duty snow removal equipment, hitches, attachments, and graders; and public works and runway maintenance products, parts, and services, and high pressure cleaning systems and trenchers. The company was founded in 1955 and is headquartered in Seguin, Texas.

Analyst Sentiment

89%
Strong Buy

From 4 Active Polls

1Y Forecast: $189.00

▲ +26.5% Potential Upside

Consensus Target Metrics

Low Bound

$188

Median

$189

High Bound

$190

Average

$189

Price & Moving Averages

Loading chart...

🎯 Wall Street Analyst Intelligence Report

1-Year structural target targets, chart projections, and sentiment maps.

Average 1Y Target
$189.00
▲ +26.53% Upside
Low Target
$188.00
26% Risk
Median Target
$189.00
27% Mid
High Target
$190.00
27% Max
Consensus
Buy
7 / 10 Buys

Consensus Trend Projection

Trailing closures vs. 12-month metrics map.

Analyst Vote Distribution

Aggregate institutional coverage sentiment weights.

📊 Historical Valuation Multiples

Real-time Trailing Twelve Month (TTM) momentum side-by-side with discrete quarterly metrics.

Fiscal QuarterTTMQ1 2026Q4 2025Q3 2025Q2 2025Q1 2025Q4 2024Q3 2024Q2 2024
Period EndingTrailing 12MMar 31, 2026Dec 31, 2025Sep 30, 2025Jun 30, 2025Mar 31, 2025Dec 31, 2024Sep 30, 2024Jun 30, 2024
Market Cap ($M)1,8181,9882,0172,2962,6252,1372,2272,1572,005
Enterprise Value ($M)1,9132,0831,9282,2612,6362,1532,2572,2422,180
Price to Earnings Ratio (P/E)17.7917.0332.5122.6221.1016.8019.8319.6817.70
Price/Earnings-to-Growth Ratio (PEG)1.4697.812.9311.50
Price to Sales Ratio (P/S)1.124.775.405.476.265.475.785.384.82
Price to Book Ratio (P/B)1.531.691.762.032.352.022.192.122.05
Price to Free Cash Flow Ratio (P/FCF)16.42-70.9528.8743.26166.69260.8030.5524.4169.66
Enterprise Value to Sales (EV/Sales)4.995.165.386.295.515.865.595.24
Enterprise Value to EBITDA (EV/EBITDA)7.7636.6824.6642.8944.7336.7943.7741.6238.27
Debt to Equity Ratio0.390.250.190.180.190.210.220.220.30

ALG Growth Runway Model

Standard long term linear growth fade

Multi-Stage Discounted Cash Flow Sandbox

Market Price$149.37
Intrinsic Value$150.24
Market Alignment
Undervalued by 0.6%relative to calculated intrinsic value
9.00%
Exp: -0%-0%
i

Growth runway slowdown

This value provides a time window for the growth rate to decline beyond Stage 1 toward the terminal rate. Longer windows are most useful for companies with high growth starting conditions or strong competitive advantages. This option stretches out the growth rate slowdown across 5, 10, or 15-year steps. A high-growth starting condition (exceeding a 25% initial growth rate) automatically applies a curve decay to simulate realistic, rapid market saturation.
i

Terminal growth rate

With long-term inflation between 3-5%, revenue must grow by that baseline to maintain flat real-world market share. This value sets the permanent terminal growth rate to factor into the valuation beyond the growth slowdown runway toward maturity.

3-Stage Financial Runway Horizon

🧠 Perpetuity Horizon Engine (Stage 3: Post-2035)

Terminal FCF Base$0.15B
Perpetuity TV Value$2.85B
Discounted TV (PV)$1.20B
TV Weighting %57.5%
⚠️
Financial Model Disclaimer & Risk Disclosure: This interactive scenario simulator is an educational sandbox provided strictly for informational and analytical research purposes. Core historical financial statements and consensus estimates are sourced directly via Financial Modeling Prep (FMP). All downstream outputs are entirely deterministic, hypothetical projections generated by combining automated mathematical formulas (including linear interpolation and Gaussian bell-curve decay models) with user-selected variables and third-party financial data inputs. Users assume all liability for trading decisions executed based on these sandbox calculations.

📘 Full Research Report

ℹ️

AI-Generated Research: This report is for informational purposes only.

📘 ALAMO GROUP INC (ALG) — Investment Overview

🧩 Business Model Overview

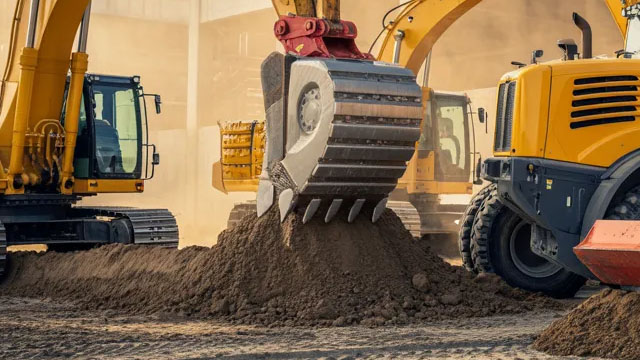
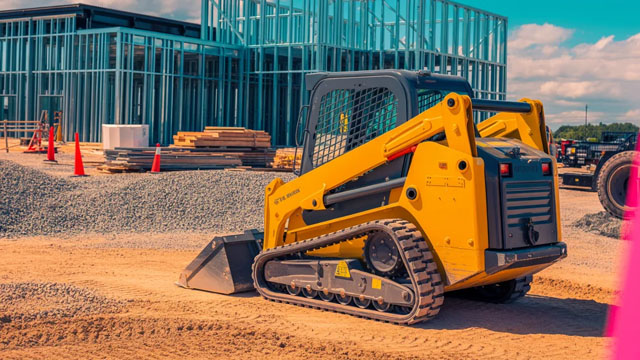
ALAMO GROUP INC designs and manufactures specialized equipment used in grounds maintenance and, more importantly for the investment case, in construction and infrastructure-related applications (notably trenching, compacting, and road/utility support equipment). The value chain is largely industrial: engineered product development → manufacturing and component sourcing → sales through equipment channels (including dealers) → installation/application support and a long tail of replacement parts and service.

The business model benefits from a “fleet-based” customer lifecycle. Customers buy capital equipment, then operate it for years, requiring consumables, wear-part replacements, and periodic servicing. This creates structural demand that is less dependent on each individual equipment purchase cycle and more tied to the size and age of installed equipment.

💰 Revenue Streams & Monetisation Model

Revenue is driven primarily by (1) new equipment sales and (2) aftermarket parts and services. Equipment sales are typically cyclical and linked to construction activity, municipal/utility spending, and contractor investment behavior. Aftermarket revenue tends to be comparatively steadier because it scales with the installed base and the wear-and-replacement cadence of heavy equipment.

Margin drivers are usually anchored in product mix (specialized, higher value-added offerings), manufacturing efficiency, and the aftermarket contribution. Parts and service generally support higher and more stable margins than new equipment, improving the consolidated earnings profile when aftermarket demand holds up through industry downturns.

🧠 Competitive Advantages & Market Positioning

Primary moat: Switching costs and installed-base lock-in (aftermarket dependency).

Once a customer standardizes on a specific equipment fleet, operational and maintenance routines—operator familiarity, spare parts stocking, and service practices—create practical switching costs. This does not imply exclusivity, but it tends to make replacement and repair behavior more path-dependent and favors vendors with dense dealer/service coverage and a robust parts ecosystem.

Secondary moat: Application-specific engineering + distributor/dealer reach. ALAMO’s products are designed for demanding field conditions where uptime matters. Competitors may match certain specifications, but consistently matching field-proven performance, durability, and support infrastructure is harder—especially at scale across a broad product catalog.

  • Vermeer — trenching and material handling equipment focus. Vermeer competes directly in relevant infrastructure applications; the differentiation is frequently product line breadth and the effectiveness of dealer/service support for contractor fleets.
  • Wirtgen Group — road and asphalt machinery and related infrastructure equipment. Wirtgen tends to emphasize road construction equipment; ALAMO competes more on the specialized workflow steps tied to utilities/earthmoving and maintenance execution where fleet uptime and parts availability matter.
  • Toro (The Toro Company) — grounds maintenance equipment. Toro’s overlap is more concentrated in landscaping/municipal mowing and turf-related use-cases; ALAMO’s positioning skews toward heavier, contractor-grade infrastructure equipment where installed-base aftermarket needs can be deeper.

Industry focus contrast: While competitors often organize around a narrower equipment theme (road machinery vs. trenching vs. turf), ALAMO spans specialized equipment categories where customers deploy large fleets that require sustained aftermarket support and dependable performance in regulated, high-uptime environments.

🚀 Multi-Year Growth Drivers

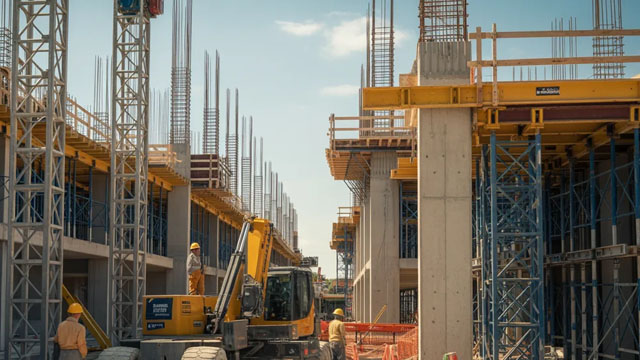
1) Infrastructure renewal cycle: Continued spending on roads, bridges, and utility networks supports long-duration demand for specialized construction and maintenance equipment. The demand profile benefits from both project activity and ongoing replacement of worn assets.

2) Utility buildout and maintenance: Grid modernization, underground work, and expansion of utility infrastructure sustain the need for trenching/compaction and related workflow equipment. Even when project volumes fluctuate, the installed-base replacement cycle tends to persist.

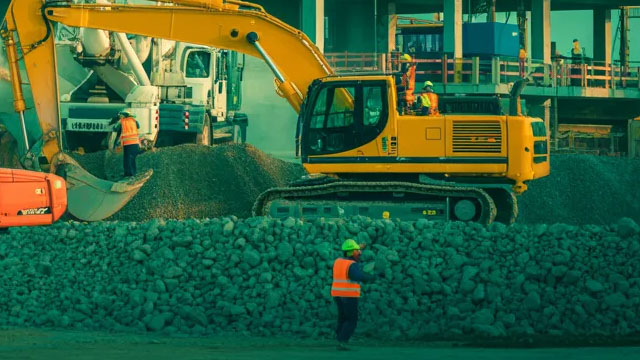
3) Fleet age and replacement cadence: Contractors and municipalities regularly replace equipment when utilization, maintenance costs, and downtime risks rise. Vendors with strong aftermarket capabilities can participate throughout the cycle because service and parts scale with existing fleets.

4) Aftermarket share capture: As customers seek uptime and cost control, they allocate more spend toward parts and service rather than fully replacing fleets. Vendors that offer breadth in wear parts and service support can maintain aftermarket resilience.

⚠ Risk Factors to Monitor

  • Industrial cyclicality: Equipment demand is sensitive to construction, municipal budgets, and contractor capex cycles. Downturns can pressure order volumes and inventory dynamics.
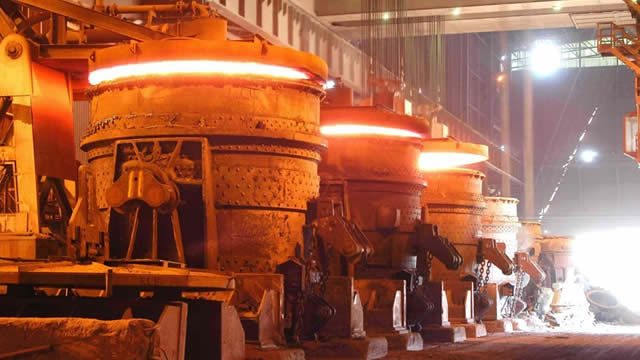
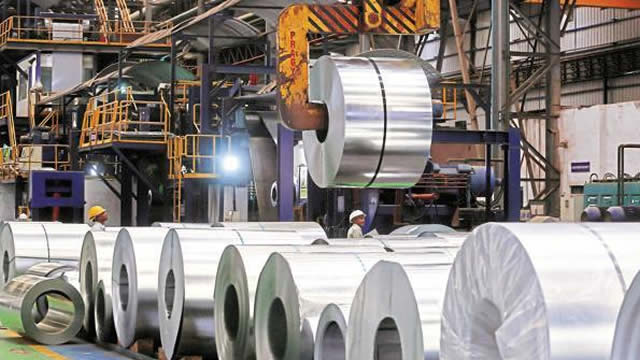
  • Input cost and supply chain pressure: Metals and components can affect manufacturing margins. Persistent cost inflation without pricing power can compress profitability.
  • Competitive intensity in specialized equipment: Competitors can increase promotional activity, expand product breadth, or leverage dealer relationships—particularly when end-market demand weakens.
  • Dealer/inventory risk: Channel inventory corrections can temporarily delay sell-through or shift timing of purchases.
  • Regulatory and technology shifts: Emissions and operational requirements for certain equipment categories can require engineering investment; failure to execute on compliant designs can create margin and demand risk.

📊 Valuation & Market View

The market typically values ALAMO Group as an industrial equipment and aftermarket business. Multiples often hinge on (1) earnings durability through the cycle, (2) the share and margin quality of aftermarket revenue, and (3) management’s ability to sustain pricing discipline and manufacturing efficiency.

Key valuation variables commonly include EV/EBITDA and earnings-based multiples, with the aftermarket contribution and margin trajectory acting as primary “multiple support” factors. When investors expect stable parts/service demand and credible cost control, the downside multiple compression tends to be moderated; when aftermarket strength is doubted or equipment volumes weaken structurally, valuation tends to compress.

🔍 Investment Takeaway

ALAMO Group’s investment case centers on a practical, installed-base moat: specialized equipment creates fleet-dependent switching costs, supporting a meaningful aftermarket and service revenue stream. Over a full cycle, durability is reinforced when aftermarket resilience offsets equipment cyclicality. The long-term opportunity is tied to continued infrastructure renewal, ongoing utility work, and the replacement cadence of heavy equipment fleets—while the primary risks remain industrial downturn sensitivity and execution around costs, supply, and product compliance.


⚠ AI-generated — informational only. Validate using filings before investing.

📰 Market News & Coverage

15 Stories Available

Real-time institutional reporting and market updates for ALG.

zacks.com2026-05-12

4 Farm Equipment Stocks Worth Watching Despite Industry Challenges

The Manufacturing - Farm Equipment industry stocks DE, CNH, AGCO and ALG are set to gain from improving farm equipment demand and investment in technology.

zacks.com2026-05-11

ALG vs. DE: Which Stock Is the Better Value Option?

Investors interested in Manufacturing - Farm Equipment stocks are likely familiar with Alamo Group (ALG) and Deere (DE). But which of these two companies is the best option for those looking for undervalued stocks?

seekingalpha.com2026-05-05

Alamo Group Inc. (ALG) Q1 2026 Earnings Call Transcript

Alamo Group Inc. (ALG) Q1 2026 Earnings Call Transcript

zacks.com2026-05-04

Alamo Group (ALG) Q1 Earnings and Revenues Top Estimates

Alamo Group (ALG) came out with quarterly earnings of $2.56 per share, beating the Zacks Consensus Estimate of $2.15 per share. This compares to earnings of $2.65 per share a year ago.

prnewswire.com2026-05-04

ALAMO GROUP ANNOUNCES FINANCIAL RESULTS FOR THE FIRST QUARTER 2026

SEGUIN, Texas, May 4, 2026 /PRNewswire/ -- Alamo Group Inc. (NYSE: ALG) today reported results for the first quarter 2026. Highlights: Net sales were $417.1 million, up 6.7% compared to the first quarter of 2025 Net income was $29.2 million and adjusted net income was $31.1 million Fully diluted EPS was $2.41 per share and adjusted fully diluted EPS was $2.56 per share Adjusted EBITDA of $59.3 million was 14.2% of net sales, up 1.8% compared to the first quarter of 2025 Net sales in the Industrial Equipment Division increased 6.5% compared to the first quarter of 2025 Net sales in the Vegetation Management Division increased 7.0% compared to the first quarter of 2025 Successfully closed the Petersen acquisition and commenced work on synergy realization Debt, net of cash, was $95.2 million at the end of first quarter of 2026 Robert Hureau, Alamo Group's President, and Chief Executive Officer commented, "We are pleased with the financial results for the first quarter and we believe there is good momentum across many of our key initiatives aimed at creating long-term value for our employees and shareholders.

zacks.com2026-04-29

New Strong Sell Stocks for April 29th

SKFRY, AKZOY and ALG have been added to the Zacks Rank #5 (Strong Sell) List on April 29, 2026.

zacks.com2026-04-28

New Strong Sell Stocks for April 28th

EADSY, AKBA and AMTB have been added to the Zacks Rank #5 (Strong Sell) List on April 28, 2026.

seekingalpha.com2026-04-24

Dividend Champion, Contender, And Challenger Highlights: Week Of April 26

A weekly summary of dividend activity for Dividend Champions, Contenders, and Challengers. Companies which changed their dividends. Companies with upcoming ex-dividend dates.

prnewswire.com2026-04-21

ALAMO GROUP INC. ANNOUNCES FIRST QUARTER 2026 EARNINGS CONFERENCE CALL

SEGUIN, Texas, April 21, 2026 /PRNewswire/ -- Alamo Group Inc. (NYSE: ALG) today announced that it will release financial results for the first quarter of 2026 after the market closes on Monday, May 4, 2026. The Company will host a conference call to discuss the results on Tuesday, May 5, 2026, at 10:00 a.m.

zacks.com2026-04-20

New Strong Sell Stocks for April 20th

ALG, LEU and MLKN have been added to the Zacks Rank #5 (Strong Sell) List on April 20th, 2026.

zacks.com2026-04-07

New Strong Sell Stocks for April 7th

ALG, BBSI and CPAC have been added to the Zacks Rank #5 (Strong Sell) List on April 7, 2026.

prnewswire.com2026-04-01

ALAMO GROUP INC. DECLARES REGULAR QUARTERLY DIVIDEND

SEGUIN, Texas, April 1, 2026 /PRNewswire/ -- Alamo Group Inc. (NYSE: ALG) announced today that its Board of Directors has declared its quarterly dividend of $0.34 per share. Payment of the April dividend will be made on April 29, 2026, to shareholders of record at the close of business on April 15, 2026.

zacks.com2026-03-30

New Strong Sell Stocks for March 30th

AIRRY, ALG and CTRA have been added to the Zacks Rank #5 (Strong Sell) List on March 30th, 2026.

newsfilecorp.com2026-03-25

Moving iMage Secures Three Year DCS Cinema Loudspeaker Commitment with Alamo Drafthouse Cinema and Launches Auditorium Upgrades at Two Locations

Fountain Valley, California and Austin, Texas--(Newsfile Corp. - March 25, 2026) - Moving iMage Technologies, Inc. (NYSE American: MITQ) ("MiT"), a leading provider of advanced out-of-home entertainment technology and services for cinemas, stadiums, arenas, esports, and immersive venues worldwide, today announced a three-year strategic agreement with Alamo Drafthouse Cinema. Under the agreement, Alamo Drafthouse will deploy MiT's DCS-branded cinema loudspeaker systems across its circuit, further enhancing its reputation for delivering premium, guest-focused theatrical experiences.

defenseworld.net2026-03-23

Brokerages Set Alamo Group, Inc. (NYSE:ALG) Target Price at $225.00

Alamo Group, Inc. (NYSE: ALG - Get Free Report) has been assigned an average rating of "Moderate Buy" from the six brokerages that are presently covering the stock, MarketBeat.com reports. One equities research analyst has rated the stock with a sell recommendation, two have issued a hold recommendation, two have assigned a buy recommendation and one

📊 AI Financial Analysis

Powered by StockMarketInfo
Earnings Data: Q Ending 2026-03-31

"ALG reported Q1’26 revenue of $417.1M and net income of $29.2M (EPS $2.42). On a QoQ basis, revenue rose +11.6% (vs. $373.7M in Q4’25) while net income increased +88.0% (vs. $15.5M). Versus Q1’25, revenue is up +6.7% (vs. $391.0M) and net income is down -8.2% (vs. $31.8M). Margins were volatile: gross margin improved to 25.1% (from 22.7% in Q4’25) but net margin eased to 7.0% from 8.1% in Q1’25, indicating profitability pressure year-over-year. Cash flow weakened materially in the quarter. Operating cash flow was -$23.5M and free cash flow was -$28.0M, driven by a large working-capital and other non-cash drag; this contrasts sharply with Q4’25’s strong operating cash flow of $75.1M. Balance sheet liquidity declined: cash fell to $195.2M (from $309.7M), while total assets grew to $1.73B from $1.61B. Despite cash decline, equity increased to $1.17B, supporting resilience. Total shareholder returns appear modest: the stock is $172.11 with only +3.14% over 1 year (no >20% momentum boost). With a consensus price target of $190, the valuation setup suggests limited upside alongside a small dividend yield (~0.21%)."

Revenue Growth

Positive

QoQ revenue +11.6% (Q1’26 vs Q4’25) and YoY revenue +6.7% (Q1’26 vs Q1’25), showing a generally constructive top-line trend despite some softness year-over-year.

Profitability

Fair

Net income rose strongly QoQ (+88.0%) to $29.2M, but YoY net income declined -8.2%. Net margin improved QoQ (from 4.2% in Q4’25 to 7.0% in Q1’26) yet is below Q1’25 (8.1%), implying margin normalization with YoY pressure.

Cash Flow Quality

Neutral

Operating cash flow swung to -$23.5M and free cash flow to -$28.0M in Q1’26, versus Q4’25 operating cash flow of +$75.1M. This indicates a temporary cash-generation issue (working-capital/other non-cash effects).

Leverage & Balance Sheet

Positive

Total assets increased to $1.73B and equity strengthened to $1.17B. Cash dropped to $195M and net debt remains positive ($95.2M), but leverage ratios are not showing a destabilizing move across the recent quarters.

Shareholder Returns

Fair

1-year price change is +3.14% (no strong momentum). Dividend yield is low (~0.21%). Buybacks occurred (Q1’26 repurchase -$1.40M), but total return support appears limited.

Analyst Sentiment & Valuation

Neutral

Consensus price target is $190 vs. price $172.11 (~10% implied upside). Valuation multiples are elevated (notably P/E ~17 in the most recent ratio set), suggesting sentiment is supportive but not deeply discounted.

Disclaimer:This analysis is AI-generated for informational purposes only. Accuracy is not guaranteed and this does not constitute financial advice.

Fundamentals Overview

Loading fundamentals overview...

ALG delivered solid top-line growth in Q1 2026 ($417.1m, +6.7% YoY) with improving sequential performance in Vegetation Management, but profitability mixed. Gross margin fell 118 bps YoY to 25.1%, driven by municipal mowing weakness and manufacturing facility ramp-up inefficiencies, partially offset by meaningful sequential vegetation margin progress. Adjusted EBITDA rose to $59.3m, yet as a percent of sales declined to 14.2% from 14.9% (-70 bps), consistent with integration, inflation, and mix impacts. Cash flow was negative in Q1 (-$23.5m operating) despite strong sequential sales, reflecting working-capital dynamics. Petersen integration is early but characterized as “smooth,” with validated commercial and operational synergies (chassis leverage, dealer expansion). Guidance signals a flattish 2026 for Industrial ex-acquisitions as order growth normalizes, while Vegetation stabilizes sequentially but with macro-driven caution. Tariff impact appears steady at ~0.8%-0.9% of sales overall.

AI IconGrowth Catalysts

  • Vegetation Management operational ramp-up and manufacturing efficiency improvements driving sequential margin and first YOY quarterly net sales increase in 9 quarters
  • Industrial Equipment growth supported by Petersen and Ring-O-Matic acquisitions; Petersen integration progressing with expected operational and commercial synergies
  • Hybrid sweepers: smaller NiteHawk in commercial production with significant customer interest; larger Schwarze smashing testing standards ahead of planned second-half 2026 commercial launch
  • Snow: Wide Wing System extendable side wing clearing capacity up to 27 feet (~80% greater than standard large plows), patent-protected in US and Canada

Business Development

  • Petersen Industries acquisition (closed earlier in Q1 2026) integrated with new leader from Alamo group
  • Ring-O-Matic acquisition (closed mid-2025) contributing to Industrial Equipment base

AI IconFinancial Highlights

  • Net sales $417.1m (+6.7% YoY); gross profit $104.8m vs $102.8m YoY
  • Gross margin 25.1%, down 118 bps YoY; decline attributed to Vegetation Management municipal mowing weakness and manufacturing facilities ramping for efficient throughput
  • SG&A $57.8m (+6.3% YoY); SG&A as % of sales 13.8% vs 13.9% (about -10 bps YoY)
  • Adjusted EBITDA $59.3m (14.2% of sales) vs $58.3m (14.9% of sales) (roughly -70 bps YoY); sequential improvement to $44.8m (12% of sales) in Q4 2025
  • Adjusted EPS $2.56 vs $2.70 YoY; $1.70 in Q4 2025
  • Effective tax rate 25.3% in line with expectations
  • Acquisition/integration/restructuring expenses $2.5m during Q1 (noted: $0.6m Petersen acquisition/integration and $1.9m restructuring; $1.6m in SG&A and $0.9m in cost of sales)
  • Operating cash flow negative $23.5m in Q1 driven by strong sequential Vegetation Management sales growth (+$36.7m or +26.4% QoQ)

AI IconCapital Funding

  • Petersen acquisition funding: $120m draw on revolver plus approximately $50m cash on hand
  • As of Mar 31, 2026: gross debt $290.5m; cash $195.2m; net leverage ratio less than 1x
  • Board approved quarterly dividend of $0.34 per share

AI IconStrategy & Ops

  • Industrial Equipment snow: shifted sales strategy to emphasize quality of earnings (not chasing every dollar of upfit/outsource work), resulting in top-line pressure but improved profitability trajectory
  • Vegetation Management: plant consolidation/manufacturing efficiency work improving sequentially by quarter-end; still work to improve but margins roughly in-line with expectation in Q1
  • Production ramping in U.S. ag and tree care tied to efficiency improvements, enabling delivery against backlog rather than full end-market recovery
  • Procurement/lean/automation roadmap reiterated as core margin levers (procurement savings project in Phase 1; robotics/automation and footprint optimization; parts/sales mix improvement)

AI IconMarket Outlook

  • Industrial Equipment: outlook for 2026 ex-acquisitions described as flattish to up very low single digits; acquisition growth adds on top
  • Industrial Equipment: order pattern expected to slow in 2026 due to transition off unusually strong prior-year growth (~17%-19% YoY over nearly 8 quarters)
  • Vegetation end markets: rate of decline expected to slow in 2026; guidance framing indicates end markets likely flattish (still down a little) with sequential improvement, but management is more cautious due to macro signals
  • Tariffs: expects aggregate tariff impact on a 12-month basis slightly short of ~1% of sales; updated view cited around 0.8%-0.9% of sales overall despite rolling-off and new rules

AI IconRisks & Headwinds

  • Gross margin headwind (-118 bps YoY) from Vegetation weakness in municipal mowing and ongoing manufacturing facility ramp-up inefficiencies
  • Municipal mowing dealer/state DOT customers remain cautious navigating fiscal budgets (Q1 municipal mowing down YoY)
  • Vegetation macro caution: rising fertilizer and freight costs; retail tractor sales in 40-100 horsepower range declining in recent months
  • U.S. housing market weakness affecting tree care end markets; net orders in tree care soft
  • Tariffs remain a margin headwind year-over-year in Q1 2026 vs no tariffs in Q1 2025; magnitude expected but could vary by manufacturing country and new rules

Q&A: Analyst Interest

  • Topic: Industrial organic growth deceleration—what drives “flattish to low single digits” 2026 ex-acquisitions. Management response: Management linked the 2026 slowdown to a transition away from extraordinary 17%-19% YoY order growth over prior quarters, expecting slower order patterns in 2026 and therefore flattish net sales, with end markets constructive long-term.
  • Topic: Vegetation margin outlook and how to model 2026 given plant consolidation progress and macro caution. Management response: Management said margins were roughly in-line with expectations in Q1, with meaningful progress but “more work to do.” They expect vegetation end markets to decline more slowly in 2026 (sequentially improving), yet acknowledged higher fertilizer/freight inflation and weaker retail tractors requiring greater caution.
  • Topic: Snow order timing vs strategy change—are delayed orders strategic selectivity or budgeting issues? Management response: Management clarified snow sales decline reflects reduced “chasing” of every revenue dollar, stopping outsourcing/upfitting that lowers margin profile. Order intake was described as strong and healthy; lead times remain competitive, so backlog growth was not concerning despite timing-driven revenue pressure.

Sentiment: MIXED

Note: This summary was synthesized by AI from the ALG Q1 2026 earnings transcript. Financial data is complex; please verify all metrics against official SEC filings before making investment decisions.

📋 Official Regulatory 10-K / 10-Q SEC Filings

Direct authenticated documentation links to audited SEC database reports for ALG.

SEC EDGAR Live Feed
Loading financial data and tables...
📁

SEC Filings (ALG)

© 2026 Stock Market Info — Alamo Group Inc. (ALG) Financial Profile