Ambiq Micro, Inc.

Ambiq Micro, Inc. (AMBQ) Market Cap

Ambiq Micro, Inc. has a market capitalization of $1.59B.

Price: $74.49

-10.51 (-12.36%)

Market Cap: 1.59B

NYSE · time unavailable

CEO: Fumihide Esaka

Sector: Technology

Industry: Semiconductors

IPO Date: 2025-07-30

Website: https://ambiq.com

Ambiq Micro, Inc. (AMBQ) - Company Information

Market Cap: 1.59B|Sector: Technology

Company Profile

Ambiq Micro, Inc. develops ultra-low-power integrated circuits for power-sensitive applications. It develops subthreshold power-optimized technology based on ultra-low-power real-time clock and microcontroller products for application in wearables, smart cards, wireless sensors, and Internet-of-Things (IoT) products. The company's flagship products include Apollo, a system on a chip for edge AI devices with host processors capable of software-based AI computations and Atomiq, targeting AI applications to provide AI acceleration along with new memory innovations. The company also offers technical support services. It offers products through sales representatives. Ambiq Micro, Inc. was formerly known as Cubiq Microchip, Inc. and changed its name to Ambiq Micro, Inc. in October 2012. The company was incorporated in 2010 and is based in Austin, Texas with additional offices in Shanghai and Shenzhen, China; Hsinchu, Taiwan; and Singapore.

Analyst Sentiment

58%
Buy

From 5 Active Polls

1Y Forecast: $49.67

▼ -33.3% Potential Upside

Consensus Target Metrics

Low Bound

$35

Median

$44

High Bound

$70

Average

$50

Price & Moving Averages

Loading chart...

🎯 Wall Street Analyst Intelligence Report

1-Year structural target targets, chart projections, and sentiment maps.

Average 1Y Target
$49.67
▼ -33.32% Upside
Low Target
$35.00
-53% Risk
Median Target
$44.00
-41% Mid
High Target
$70.00
-6% Max
Consensus
Buy
1 / 2 Buys

Consensus Trend Projection

Trailing closures vs. 12-month metrics map.

Analyst Vote Distribution

Aggregate institutional coverage sentiment weights.

📊 Historical Valuation Multiples

Real-time Trailing Twelve Month (TTM) momentum side-by-side with discrete quarterly metrics.

Fiscal QuarterTTMQ1 2026Q4 2025Q3 2025Q2 2025Q1 2025Q4 2024Q3 2024Q2 2024
Period EndingTrailing 12MMar 31, 2026Dec 31, 2025Sep 30, 2025Jun 30, 2025Mar 31, 2025Dec 31, 2024Sep 30, 2024Jun 30, 2024
Market Cap ($M)1,59251852237368052470314524
Enterprise Value ($M)1,390316382227633464643
Price to Earnings Ratio (P/E)-39.62-12.74-12.22-10.36-20.00-15.83-17.24-0.37-12.33
Price/Earnings-to-Growth Ratio (PEG)-0.61-0.86-6.34-1.47-47.85-5.35-0.37
Price to Sales Ratio (P/S)19.4620.6825.1620.5338.0233.3334.540.6925.89
Price to Book Ratio (P/B)6.462.203.212.209.596.698.19
Price to Free Cash Flow Ratio (P/FCF)-44.52-44.08-121.49-65.02-48.611808.25-5054.71-0.84-160.36
Enterprise Value to Sales (EV/Sales)12.6018.4312.5135.4129.5031.59
Enterprise Value to EBITDA (EV/EBITDA)-39.18-31.81-37.05-27.41-91.17-55.38-62.36
Debt to Equity Ratio5.710.010.000.000.010.010.01
⚠️

Valuation Model Suspended

API Payload Error: Inverted or negative baseline Free Cash Flow margin detected (-56.7%).

Troubleshooting Notice: The upstream financial data supplier has uploaded corrupted or inverted baseline metrics for AMBQ. The server sandbox cannot calculate an intrinsic value path from negative cash generation baselines.

📘 Full Research Report

ℹ️

AI-Generated Research: This report is for informational purposes only.

📘 AMBIQ MICRO INC (AMBQ) — Investment Overview

🧩 Business Model Overview

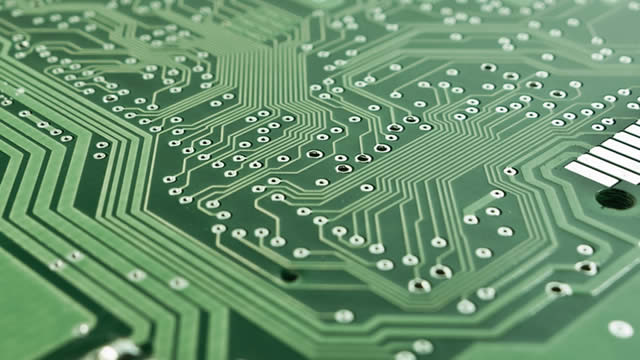
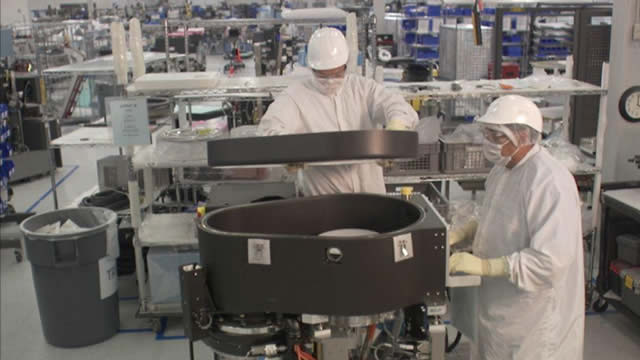
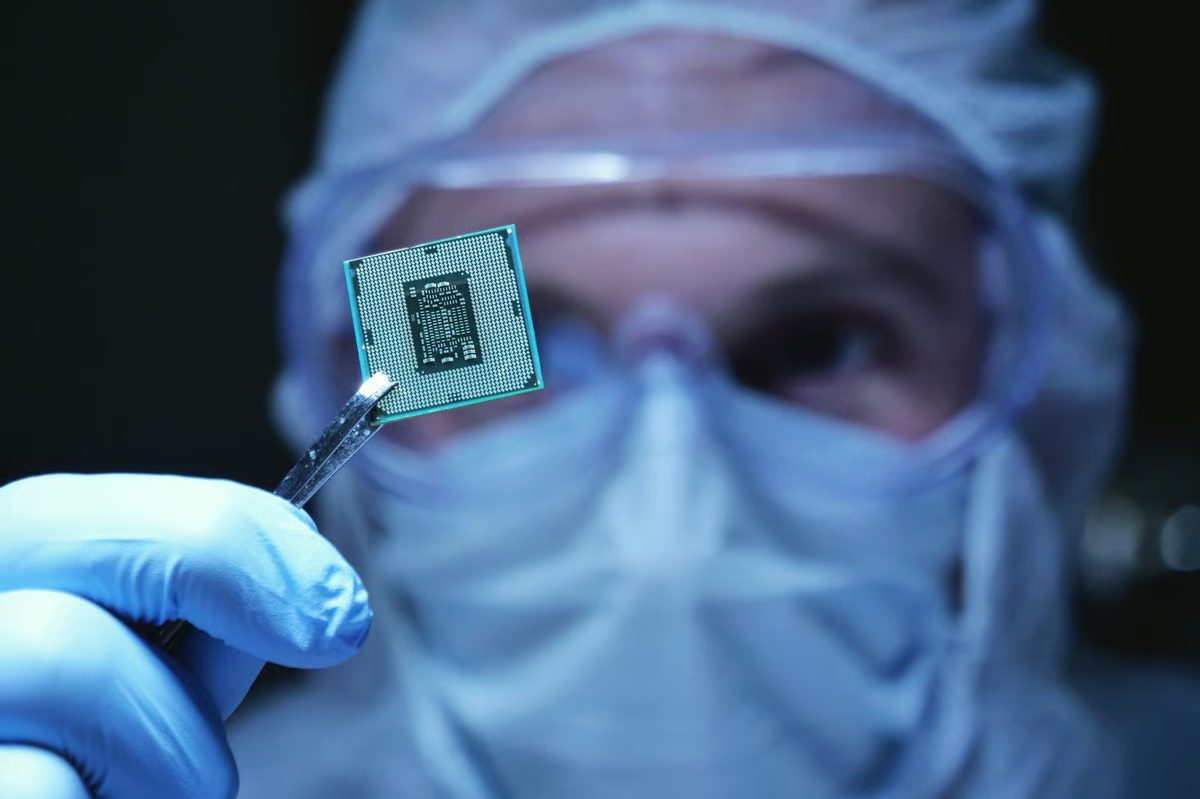
AMBIQ MICRO INC designs and sells ultra-low-power microcontrollers (MCUs) and related SoCs used in battery-powered end markets such as wearables, health devices, smart accessories, and industrial/edge IoT. The company’s value chain centers on (1) semiconductor R&D and platform development, (2) fabrication/assembly through external foundry and packaging partners, and (3) product delivery to customers (OEMs, ODMs, and module/system integrators) who embed AMBIQ silicon into final products. A meaningful portion of the commercial process is “design-in” driven: once a chipset is selected for an architecture, subsequent volumes depend on whether software ecosystems, power-performance targets, and reliability expectations continue to be met across product lifecycles.

💰 Revenue Streams & Monetisation Model

Revenue is primarily generated through product sales of chips (MCUs/SoCs), with monetisation tied to unit volumes and product mix. Monetisation dynamics are shaped by:

  • Product mix and power-performance tiering: higher-end SoCs and more feature-rich configurations typically carry better average selling prices and support improved gross margin through platform leverage.
  • Lifecycle “re-buy” behavior: after a design-in decision, future shipments often follow customer product refresh cycles, creating a quasi-recurring element to what is otherwise hardware revenue.
  • Channel/distributor throughput: sales can flow through distribution depending on customer purchasing patterns, but ultimate monetisation still depends on the embedded design selection in end products.

Operating profitability is largely driven by gross margin (product mix vs. wafer/assembly/packaging economics) and operating leverage from scaling platform development over larger unit volumes.

🧠 Competitive Advantages & Market Positioning

AMBIQ’s moat is primarily based on cost of switching and platform integration plus performance-led power efficiency, which translates into customer stickiness for battery-life-driven designs.

  • High switching costs (design-in / engineering lock-in): Once an OEM selects an MCU/SoC, changing suppliers typically requires redesigning hardware/firmware integration, re-validating low-power states, reworking peripherals, and retesting for functional safety and thermal/power behavior—activities that are costly and schedule-sensitive.
  • Platform-level “power architecture” capability: Customers value predictable sleep/wake behavior and system-level efficiency. AMBIQ’s differentiation is tied to low-power design expertise and integration that reduces total system battery drain, not only headline microcontroller specs.
  • Intangible assets (engineering know-how and ecosystem): Tooling, firmware support, reference designs, and validated low-power use cases support faster development and lower time-to-market, reinforcing stickiness over successive product generations.

Competitive benchmarking:

  • STMicroelectronics (ST): Broad MCU portfolio with strong presence in industrial and consumer applications. AMBIQ’s positioning emphasizes ultra-low-power specialization, creating a narrower but deeper fit for battery-critical designs.
  • Nordic Semiconductor: Strong in wireless-centric MCU solutions (Bluetooth/Thread/Zigbee). AMBIQ competes where ultra-low-power power budgeting and platform-level efficiency matter more than a wireless-only focus.
  • Texas Instruments (TI) (and related MCU lines): Large installed base and wide application coverage. AMBIQ’s differentiation targets designs where power efficiency and low-energy system behavior are primary selection criteria, raising migration friction once integrated.

🚀 Multi-Year Growth Drivers

The multi-year growth opportunity for AMBIQ is anchored in secular trends that expand the addressable market for ultra-low-power computing:

  • Wearables and medical-adjacent devices: Continued demand for longer battery life and more always-on sensing increases the value of low-power MCUs/SoCs.
  • Industrial and edge IoT: Sensor nodes and gateway peripherals benefit from extended uptime and reduced maintenance when power consumption is minimized.
  • Smart home and accessory ecosystems: Low-energy operation supports always-connected or event-driven devices without frequent charging or battery swaps.
  • Energy efficiency expectations: Product and sustainability goals increasingly prioritize power reduction, strengthening demand for specialized ultra-low-power semiconductors.

Over a 5–10 year horizon, TAM expansion is supported by both unit growth (more battery-powered endpoints) and share shifts within endpoints toward more capable low-power platforms, where power-performance improvements justify higher-value silicon selections.

⚠ Risk Factors to Monitor

  • Competitive intensity and price/mix pressure: Larger MCU vendors can compete via bundling, channel leverage, or broader portfolio discounting, potentially compressing margins.
  • Design-win execution risk: Semiconductor revenues are sensitive to customer qualification timelines and product adoption rates; missing design cycles can create revenue volatility.
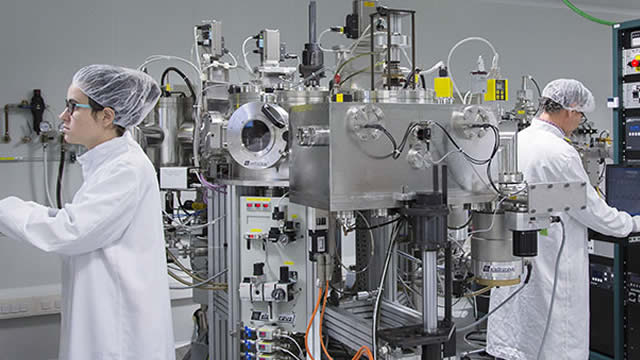
  • Supply chain and packaging dependency: Reliance on external fabrication/assembly partners introduces risks related to capacity constraints, lead times, and cost fluctuations—particularly for advanced packaging and low-power-optimized processes.
  • Customer concentration and platform transitions: Exposure to a limited set of large programs can increase downside during qualification changes or end-market softness; platform transitions also carry qualification rework risk.
  • Technology and software ecosystem expectations: Low-power differentiation must be sustained through continued R&D and robust firmware/tool support; gaps can reduce switching friction and accelerate customer migration.

📊 Valuation & Market View

The market for specialized semiconductors typically values companies using a combination of P/S (growth and platform adoption) and EV/EBITDA (operating leverage potential). For AMBIQ-type businesses, valuation sensitivity usually concentrates on:

  • Gross margin trajectory: product mix, yield/cost improvements, and favorable packaging/fabrication economics.
  • Evidence of sustained design-in momentum: pipeline strength translating into higher recurring-like shipment behavior over product lifecycles.
  • Operating leverage: the ability to scale R&D and overhead while maintaining competitive differentiation.
  • Inventory normalization and end-demand durability: semiconductor cycles affect reported results, but durable design wins can mitigate the magnitude of volatility.

In underwriting, investors typically look for a credible pathway from design adoption to improved mix, with margin resilience supported by differentiated low-power performance and reduced switching by integrated customers.

🔍 Investment Takeaway

AMBIQ’s investment case rests on a specialized ultra-low-power positioning that creates high switching costs for customers once designs are qualified, supported by platform integration and engineering know-how. The core long-term thesis is that demand growth in wearables and edge IoT—driven by battery-life and energy-efficiency needs—can convert into sustained silicon adoption, enabling operating leverage if the company maintains product differentiation and execution through supply chain and competitive pressure.


⚠ AI-generated — informational only. Validate using filings before investing.

📰 Market News & Coverage

15 Stories Available

Real-time institutional reporting and market updates for AMBQ.

fool.com2026-05-22

Ambiq Micro's CFO Sold Company Shares Worth $1.8 Million. Here's What That Means for Investors.

This ultra-low-power semiconductor firm for IoT and AI devices reported a notable insider sale in its latest SEC filing.

fool.com2026-05-19

Meet the Small-Cap Chip Stock That Is a Tiny Fraction of Nvidia's Valuation and That Just Posted 59% Revenue Growth Due to AI-Driven Demand

Ambiq Micro is a provider of semiconductor solutions for edge AI, and demand has been taking off recently.

benzinga.com2026-05-12

Ambiq Micro Shares Soar 40% On Q1 Beat And Bullish AI Outlook

Shares of Ambiq Micro Inc (NYSE:AMBQ) are surging Tuesday afternoon following the release of strong first-quarter financial results. The rally was further bolstered by analysts at Needham, who maintained a Buy rating and raised their price target for the stock to $70.

marketbeat.com2026-05-12

Ambiq Micro Q1 Earnings Call Highlights

Ambiq Micro NYSE: AMBQ said first-quarter 2026 results exceeded its expectations as demand for edge artificial intelligence accelerated across its customer base, with management pointing to strong product launch ramps, a new customer entering production and expanding use cases beyond wearables.

seekingalpha.com2026-05-12

Ambiq Micro, Inc. (AMBQ) Q1 2026 Earnings Call Transcript

Ambiq Micro, Inc. (AMBQ) Q1 2026 Earnings Call Transcript

zacks.com2026-05-12

Ambiq Micro, Inc. (AMBQ) Reports Q1 Loss, Tops Revenue Estimates

Ambiq Micro, Inc. (AMBQ) came out with a quarterly loss of $0.25 per share versus the Zacks Consensus Estimate of a loss of $0.36. This compares to a loss of $18.96 per share a year ago.

businesswire.com2026-05-12

Ambiq Reports First Quarter 2026 Financial Results

AUSTIN, Texas--(BUSINESS WIRE)---- $AMBQ #AI--Ambiq Micro, Inc. (“Ambiq”) (NYSE: AMBQ), a technology leader in ultra-low-power semiconductor solutions for edge AI, today announced financial results for the first quarter 2026. First Quarter 2026 Highlights Exceptional start to 2026 with accelerating demand momentum: Delivered strong first quarter net sales, increasing year-over-year and sequentially. This reflects strong demand for edge AI solutions, expanding customer adoption of Ambiq products and upgrades.

zacks.com2026-05-11

Ambiq Micro, Inc. (AMBQ) Stock Jumps 16.3%: Will It Continue to Soar?

Ambiq Micro, Inc. (AMBQ) witnessed a jump in share price last session on above-average trading volume. The latest trend in earnings estimate revisions for the stock suggests that there could be more strength down the road.

zacks.com2026-05-05

Will Ambiq Micro, Inc. (AMBQ) Report Negative Earnings Next Week? What You Should Know

Ambiq Micro, Inc. (AMBQ) doesn't possess the right combination of the two key ingredients for a likely earnings beat in its upcoming report. Get prepared with the key expectations.

businesswire.com2026-04-29

Ambiq compressionKIT Cuts Edge AI Memory and Power by Up to 20x

AUSTIN, Texas--(BUSINESS WIRE)---- $AMBQ #AI--Ambiq Micro, Inc. (“Ambiq®“), a technology leader in ultra-low power semiconductor solutions for edge AI, today announced compressionKIT™, a next-generation AI-based codec in beta release, proven to substantially reduce the power and memory costs of handling continuous sensor data in wearable and edge devices. As always-on devices—from medical wearables to smart home and industrial sensors—generate continuous data streams, storing and transmitting that data has b.

businesswire.com2026-04-28

Ambiq Micro to Report First Quarter 2026 Financial Results

AUSTIN, Texas--(BUSINESS WIRE)---- $AMBQ #AI--Ambiq Micro, Inc. (NYSE: AMBQ), a technology leader in ultra-low-power semiconductor solutions for edge AI, today announced that it will report its first quarter 2026 financial results on Tuesday, May 12, 2026 before the market opens. The Company will host a conference call at 7:30 a.m. Central Time (8:30 a.m. Eastern Time) to discuss the results. Analysts and investors are invited to join the live conference call using the following information: Date: Tuesday, M.

defenseworld.net2026-04-07

Ambiq Micro (NYSE:AMBQ) General Counsel Michele Kim Connors Sells 811 Shares

Ambiq Micro, Inc. (NYSE: AMBQ - Get Free Report) General Counsel Michele Kim Connors sold 811 shares of Ambiq Micro stock in a transaction on Thursday, April 2nd. The stock was sold at an average price of $26.15, for a total value of $21,207.65. Following the transaction, the general counsel owned 60,554 shares in the company,

defenseworld.net2026-04-07

Linkers Industries (NASDAQ:LNKS) versus Ambiq Micro (NYSE:AMBQ) Head to Head Survey

Linkers Industries (NASDAQ: LNKS - Get Free Report) and Ambiq Micro (NYSE: AMBQ - Get Free Report) are both small-cap manufacturing companies, but which is the superior stock? We will contrast the two companies based on the strength of their profitability, dividends, valuation, institutional ownership, analyst recommendations, earnings and risk. Earnings and Valuation This table compares Linkers

defenseworld.net2026-03-21

Comparing Linkers Industries (NASDAQ:LNKS) & Ambiq Micro (NYSE:AMBQ)

Ambiq Micro (NYSE: AMBQ - Get Free Report) and Linkers Industries (NASDAQ: LNKS - Get Free Report) are both small-cap manufacturing companies, but which is the superior investment? We will compare the two businesses based on the strength of their profitability, valuation, risk, earnings, analyst recommendations, dividends and institutional ownership. Profitability This table compares Ambiq Micro and

defenseworld.net2026-03-19

Critical Comparison: Linkers Industries (NASDAQ:LNKS) and Ambiq Micro (NYSE:AMBQ)

Ambiq Micro (NYSE: AMBQ - Get Free Report) and Linkers Industries (NASDAQ: LNKS - Get Free Report) are both small-cap manufacturing companies, but which is the better investment? We will contrast the two businesses based on the strength of their dividends, profitability, risk, earnings, analyst recommendations, institutional ownership and valuation. Profitability This table compares Ambiq Micro and

📊 AI Financial Analysis

Powered by StockMarketInfo
Earnings Data: Q Ending 2026-03-31

"AMBQ reported Q1 2026 revenue of $25.06M and net income of -$10.17M (EPS not meaningful; data shows eps = 0). YoY (Q1’26 vs Q1’25), revenue rose ~+59.2% ($25.06M vs $15.73M), but net income deteriorated (less favorable) by about -22.9% in absolute terms (from -$8.28M to -$10.17M). QoQ (Q4’25 to Q1’26), revenue increased ~+20.9% ($20.74M to $25.06M), while losses remained in a similar range (-$10.68M to -$10.17M). Profitability is not stabilizing: gross margin improved to ~43.5% in Q1’26 from ~11.9% in Q4’25, yet operating margin and net margin are still deeply negative (net margin ~-40.6%). Operating expenses remain heavy, with R&D at $12.83M and total operating expenses of $22.58M. Operating cash flow was -$11.17M and free cash flow was -$11.76M, indicating the quarter’s earnings losses are still consuming cash. Balance sheet resilience is strong for a pre-profitable company: cash and equivalents rose to $204.5M (vs $140.3M in Q4’25), and total assets grew to $259.5M. Shareholder returns appear driven by price momentum that is not strong: price is $34.76, with 1y_change of -9.78% and no stated dividends or buybacks in the cash flow."

Revenue Growth

Positive

Revenue grew +20.9% QoQ (Q4’25 $20.74M -> Q1’26 $25.06M) and +59.2% YoY (Q1’25 $15.73M -> Q1’26 $25.06M).

Profitability

Neutral

Despite gross margin improvement to ~43.5% in Q1’26 (from ~11.9% in Q4’25), net margin remains deeply negative at ~-40.6%. Net loss widened YoY (from -$8.28M to -$10.17M).

Cash Flow Quality

Caution

Operating cash flow was -$11.17M and free cash flow -$11.76M in Q1’26. Losses continue to consume cash even as cash balances increased (likely financing-related).

Leverage & Balance Sheet

Good

Balance sheet is liquid: cash and equivalents rose to $204.5M and net debt remains negative (netDebt -$202.4M). Total assets increased to $259.5M and equity improved to $235.2M.

Shareholder Returns

Neutral

No dividends were paid in Q1’26 and buybacks are not shown. Price performance is negative over 1Y (-9.78%), so total shareholder return momentum is weak.

Analyst Sentiment & Valuation

Neutral

Consensus target is $40.67 vs current $34.76 (~+17% upside). However, the stock’s trailing 1Y change is still negative and valuation metrics are distorted by losses.

Disclaimer:This analysis is AI-generated for informational purposes only. Accuracy is not guaranteed and this does not constitute financial advice.

Fundamentals Overview

Loading fundamentals overview...

AMBQ delivered a strong Q1 2026 start, with net sales of $25.1M (+59.3% YoY) and non-GAAP gross margin at 46.2% (down 90 bps YoY due to a Q1 2025 nonrecurring credit; underlying margin improved +210 bps). Demand momentum appears supported by edge AI adoption: >80% of units running AI algorithms, more expedited requests, and improving customer concentration (top 3 down to ~71% from 86%). Q2 guidance calls for $31M-$32M sales (~75% YoY growth) and 45%-46% gross margin, driven by yield progress and Apollo 5 scaling. However, management tempered profitability timing, noting profitability requires ~ $47M quarterly revenue given current ~$21M quarterly opex at ~46% margin; breakeven could shift from mid-2028 toward early 2028/2H 2027 via Apollo 110 and 340 ramp pull-in. Key risks center on industry substrate/piece-part cost inflation and supply/lead-time constraints under heavy expedited demand.

AI IconGrowth Catalysts

  • Apollo 5 customer upgrade driving next-generation edge AI while maintaining ultra-low power
  • Order ramps for upcoming customer product launches and a new major customer entering production during the quarter
  • Increase in non-wearables growth: non-wearables pipeline ~25% and Q1 non-wearables revenue growth 100%
  • Multi-form-factor expansion (display-less bands, smart eyewear, rings) and ongoing diversification across wearables plus medical/industrial/smart home & buildings
  • Software tools/compression kit combined with ultra-low power hardware to enable multi-day battery life with large raw physical data storage and edge anomaly detection

Business Development

  • New scaled global customer expected to enter mass production in 2026
  • New customer entered production during Q1 2026 (explicitly noted as a major customer; potential to exceed 10% of revenues this year)
  • Largest customer design win for a next-generation product line expected to enter production in 2027
  • Several potential Alpha customers engaged for Atomic 120 with strong interest specifically from smart glasses programs
  • Partnerships with TSMC and OSAT partners referenced to support front- and back-end manufacturing capacity for expedited demand

AI IconFinancial Highlights

  • Net sales: $25.1M, +59.3% YoY; exceeded guidance (no explicit consensus figure provided)
  • Non-GAAP gross profit: +56.2% YoY to $11.6M; Non-GAAP gross margin 46.2% (down 90 bps YoY due to a Q1 2025 nonrecurring credit)
  • Excluding onetime item, Non-GAAP gross margin increased 210 bps YoY
  • Q2 net sales guidance: $31M-$32M (implies ~75% YoY growth)
  • Q2 non-GAAP gross margin: 45%-46%, attributed to yield improvements and Apollo 5 scaling
  • Q1 non-GAAP R&D: $10.1M (+43.3% YoY) driven by accelerated investments for Apollo and Atomic
  • Q1 non-GAAP SG&A: $8.1M (+31.8% YoY) driven by go-to-market and public company infrastructure
  • Q1 ended with no debt and $204.5M cash/cash equivalents
  • Non-GAAP EPS: -$0.25 in Q1 2026
  • Q2 non-GAAP EPS guidance: -$0.29 to -$0.23 (weighted average shares: 21.38M)
  • Margin outlook: gross margins roughly flat YoY; yield improvements offset by broader industry cost dynamics

AI IconCapital Funding

  • No debt as of Q1 2026; cash and cash equivalents of $204.5M
  • No buyback activity mentioned in the transcript
  • Annual operating expense target: ~$85M for 2026, including $7M-$10M of IP purchases necessary for product development

AI IconStrategy & Ops

  • Pipeline diversification: non-wearables are ~1/4 of the pipeline; Q1 non-wearables growth 100%
  • Apollo 340: meaningful customer interest based on compelling price-to-value; sampling/design progression disclosed elsewhere in Q&A
  • Atomic 110: on track for tape-out by end of 2026; initial customer ramp late 2027
  • Atomic 120: actively engaged with Alpha customers; strong interest in smart glasses
  • Compression kit software: temporarily restricted to work with Ambiq products (longer-term pairing with other products possible)
  • Expedited requests increasing; management states supply can be constrained only when lead times are shorter than normal—otherwise expected to support quarter after quarter
  • Revenue concentration improving: top 3 customers were 86% of Q1 2025 sales, reduced to ~71% in Q1 2026

AI IconMarket Outlook

  • Q2 2026 net sales guidance: $31M-$32M (~75% YoY growth)
  • Q2 2026 gross margin: 45%-46%
  • Q2 2026 non-GAAP operating expense: $21M-$22M, including $1.7M related to IP purchases
  • 2026 full-year expectations: gross margins roughly flat YoY; operating expense about ~$85M
  • 2026 second-half YoY growth expected to be similar to first-half pace: management referenced Q1/H1 context and confirmed similar ~65% YoY type growth (analyst interpretation) for H2

AI IconRisks & Headwinds

  • Gross margin pressure risk from industry-wide substrate and piece-part cost dynamics that can negate yield improvements
  • Supply/lead-time mismatch risk: some expedited demand cannot be met when lead time is shorter than normal
  • Opex and profitability timing risk: heavy investment in Apollo 5/Atomic roadmaps implies cash flow/P&L breakeven pushed out near 2027-2028 unless revenue ramps accelerate
  • Customer concentration still elevated: top 3 customers ~71% of Q1 2026 sales (diversification progress but remaining concentration risk)

Q&A: Analyst Interest

  • Topic: Profitability timing vs revenue run-rate and operating expense cadence: Management explained that at ~$21M quarterly operating expense with ~46% margin, revenues need ~ $47M per quarter for profitability; Q2 guidance sits below that level. They argued investments (notably 110 and 340) should pull forward cash flow breakeven and P&L profitability from mid-2028 toward early 2028 or potentially 2H 2027.
  • Topic: Margin outlook drivers and pass-through ability amid input cost inflation: Management attributed flattish gross margins to offsetting yield improvements (especially Apollo 5) versus industry cost pressures (substrates and piece parts). They stated pricing/ASP uplift is strategic and selective; they can potentially monetize expediting costs as customers seek higher volumes, but must stay competitive, implying partial pass-through rather than full offset.
  • Topic: Apollo 340 and partner ecosystem details: Management described compression kit as restricted to Ambiq products for now. For Apollo 340, they provided a timeline: design in progress, sampling in 1H next year, initial ramps toward end of next year, and meaningful revenue in 2028, emphasizing broader customer diversity (medical, industrial, smart grid/sensors, plus wearables such as smart rings).

Sentiment: MIXED

Note: This summary was synthesized by AI from the AMBQ Q1 2026 earnings transcript. Financial data is complex; please verify all metrics against official SEC filings before making investment decisions.

📋 Official Regulatory 10-K / 10-Q SEC Filings

Direct authenticated documentation links to audited SEC database reports for AMBQ.

SEC EDGAR Live Feed
Loading financial data and tables...
📁

SEC Filings (AMBQ)

© 2026 Stock Market Info — Ambiq Micro, Inc. (AMBQ) Financial Profile