Alpha Metallurgical Resources, Inc.

Alpha Metallurgical Resources, Inc. (AMR) Market Cap

Alpha Metallurgical Resources, Inc. has a market capitalization of $2.57B.

Price: $202.38

β–Ό -12.83 (-5.96%)

Market Cap: 2.57B

NYSE Β· time unavailable

CEO: Charles Andrew Eidson

Sector: Energy

Industry: Coal

IPO Date: 2021-02-08

Website: https://www.alphametresources.com

Alpha Metallurgical Resources, Inc. (AMR) - Company Information

Market Cap: 2.57B|Sector: Energy

Company Profile

Alpha Metallurgical Resources, Inc., a mining company, produces, processes, and sells met and thermal coal in Virginia and West Virginia. As of December 31, 2021, it operated twenty active mines and eight coal preparation and load-out facilities. The company was formerly known as Contura Energy, Inc. and changed its name to Alpha Metallurgical Resources, Inc. in February 2021. Alpha Metallurgical Resources, Inc. was incorporated in 2016 and is headquartered in Bristol, Tennessee.

Analyst Sentiment

35%
Underperform

From 3 Active Polls

1Y Forecast: $189.50

β–Ό -6.4% Potential Upside

Consensus Target Metrics

Low Bound

$185

Median

$190

High Bound

$194

Average

$190

Price & Moving Averages

Loading chart...

🎯 Wall Street Analyst Intelligence Report

1-Year structural target targets, chart projections, and sentiment maps.

Average 1Y Target
$189.50
β–Ό -6.36% Upside
Low Target
$185.00
-9% Risk
Median Target
$189.50
-6% Mid
High Target
$194.00
-4% Max
Consensus
Hold
1 / 4 Buys

Consensus Trend Projection

Trailing closures vs. 12-month metrics map.

Analyst Vote Distribution

Aggregate institutional coverage sentiment weights.

πŸ“Š Historical Valuation Multiples

Real-time Trailing Twelve Month (TTM) momentum side-by-side with discrete quarterly metrics.

Fiscal QuarterTTMQ1 2026Q4 2025Q3 2025Q2 2025Q1 2025Q4 2024Q3 2024Q2 2024
Period EndingTrailing 12MMar 31, 2026Dec 31, 2025Sep 30, 2025Jun 30, 2025Mar 31, 2025Dec 31, 2024Sep 30, 2024Jun 30, 2024
Market Cap ($M)2,5732,6272,5722,1361,4691,6342,6063,0754,275
Enterprise Value ($M)2,2682,3222,2291,7321,0251,1912,1302,5973,947
Price to Earnings Ratio (P/E)-66.81-59.54-37.23-96.81-74.12-12.04-305.96202.0618.14
Price/Earnings-to-Growth Ratio (PEG)β€”-68.64β€”β€”-21.53β€”β€”β€”β€”
Price to Sales Ratio (P/S)1.215.004.944.052.673.074.224.585.32
Price to Book Ratio (P/B)1.711.731.661.340.911.011.581.862.60
Price to Free Cash Flow Ratio (P/FCF)114.77-226.08-257.4083.9479.01-100.45191.9119.4655.50
Enterprise Value to Sales (EV/Sales)β€”4.424.283.291.862.243.453.864.91
Enterprise Value to EBITDA (EV/EBITDA)16.0365.2699.2846.5922.171844.0543.6657.9035.77
Debt to Equity Ratio-2.160.010.020.000.000.000.000.000.01

⚑ AMR Growth Runway Model

Standard long term linear growth fade

Multi-Stage Discounted Cash Flow Sandbox

Market Price$202.38
Intrinsic Value$524.99
Market Alignment
Undervalued by 159.4%relative to calculated intrinsic value
9.00%
Exp: 6%6%
i

Growth runway slowdown

This value provides a time window for the growth rate to decline beyond Stage 1 toward the terminal rate. Longer windows are most useful for companies with high growth starting conditions or strong competitive advantages. This option stretches out the growth rate slowdown across 5, 10, or 15-year steps. A high-growth starting condition (exceeding a 25% initial growth rate) automatically applies a curve decay to simulate realistic, rapid market saturation.
i

Terminal growth rate

With long-term inflation between 3-5%, revenue must grow by that baseline to maintain flat real-world market share. This value sets the permanent terminal growth rate to factor into the valuation beyond the growth slowdown runway toward maturity.

3-Stage Financial Runway Horizon

🧠 Perpetuity Horizon Engine (Stage 3: Post-2035)

Terminal FCF Base$0.49B
Perpetuity TV Value$9.26B
Discounted TV (PV)$3.91B
TV Weighting %60.9%
⚠️
Financial Model Disclaimer & Risk Disclosure: This interactive scenario simulator is an educational sandbox provided strictly for informational and analytical research purposes. Core historical financial statements and consensus estimates are sourced directly via Financial Modeling Prep (FMP). All downstream outputs are entirely deterministic, hypothetical projections generated by combining automated mathematical formulas (including linear interpolation and Gaussian bell-curve decay models) with user-selected variables and third-party financial data inputs. Users assume all liability for trading decisions executed based on these sandbox calculations.

πŸ“˜ Full Research Report

ℹ️

AI-Generated Research: This report is for informational purposes only.

πŸ“˜ ALPHA METALLURGICAL RESOURCE INC (AMR) β€” Investment Overview

🧩 Business Model Overview

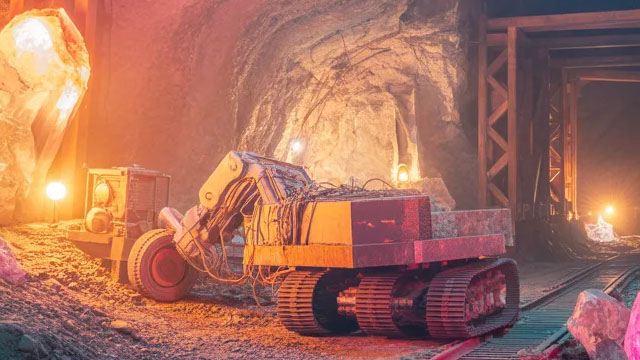
AMR participates in the metallurgical coal value chain by producing premium coking coal used to make coke, a critical input for blast-furnace steelmaking. The value creation mechanism is straightforward: high-quality coal is mined from owned/controlled reserves, processed to meet cokemaking specifications, and delivered to steel mills and coke producers that require consistent blend performance. Because steelmaking processes are specification-driven, customers typically qualify suppliers based on coal chemistry, sizing, and coke quality outcomes, which supports customer stickiness and longer-term contracting behavior.

πŸ’° Revenue Streams & Monetisation Model

Revenue is primarily generated from the sale of metallurgical coal. Monetisation is driven by two key economic levers:

  • Quality and specification premium: When coal chemistry and blending properties align with cokemaking targets, pricing can reflect a premium versus lower-spec alternatives.
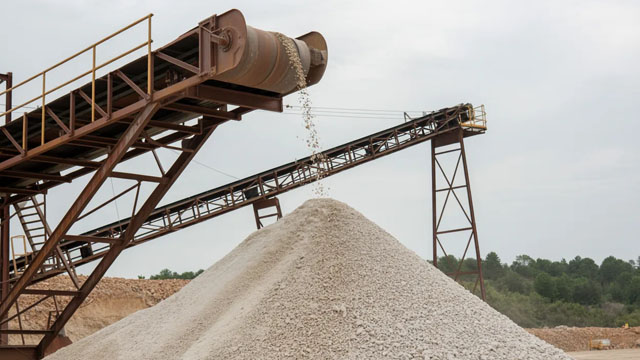
  • Operating cost leverage: Unit costs (mining/processing, logistics, and maintenance) influence margin resilience across cycles, especially for producers with favorable cost curves.

While sales are transactional rather than subscription-like, the industry’s supply qualification norms function similarly to recurring economics: qualified supply relationships tend to persist, and volumes are often influenced by contracted or semi-structured procurement practices tied to blend reliability and coke performance.

🧠 Competitive Advantages & Market Positioning

AMR’s moat is anchored in Low-Cost Feedstock (quality-adjusted cost position from Appalachia) and Logistical Infrastructure (access to established rail and regional transportation routes), supported by Switching Costs stemming from metallurgical specification qualification.

  • Low-cost, high-quality feedstock: Cokemaking outcomes depend on coal characteristics; producers with reliably premium properties can command better terms and face higher substitution friction.
  • Logistics and delivery reliability: Proximity to industrial demand centers and established transportation channels reduce delivery uncertainty and support stable customer operations.
  • Customer switching costs: Steelmakers and coke producers must validate coal blends to ensure coke strength and metallurgical performance; qualification cycles and process risk raise the cost of changing suppliers.

Competitive benchmarking (primary peers):

  • Warrior Met Coal: A major U.S. metallurgical coal producer competing for similar domestic blast-furnace and coke supply needs, but with different seam characteristics and cost/quality profiles.
  • Peabody Energy: A broader mining platform with a mix of commodity exposures; competition varies by segment and by met coal availability versus other feedstocks.
  • Glencore: A global, multi-origin met coal supplier; contrasts with AMR’s more focused geographic/asset base and the operational emphasis on dependable blend quality from U.S. sources.

Compared with these rivals, AMR’s positioning emphasizes consistency of metallurgical performance, supply reliability, and cost discipline for premium coking coal rather than broad-based commodity diversification.

πŸš€ Multi-Year Growth Drivers

Over a 5–10 year horizon, AMR’s growth outlook is shaped less by unit demand expansion alone and more by sustaining a favorable β€œquality-adjusted supply” position:

  • Steelmaking resiliency and coke dependence: Blast-furnace routes remain a large share of global steel production; coke requirements continue to underpin demand for coking coal, especially where EAF penetration is limited by scrap availability and process economics.
  • Quality-driven procurement: Even when steel volumes fluctuate, mills must maintain coke quality and blast-furnace performance, supporting ongoing need for qualified coal blends.
  • Supply discipline and constrained effective capacity: Met coal is sensitive to development timelines, permitting constraints, and capital allocation discipline; incremental supply often lags demand growth, benefiting producers with operational readiness.
  • TAM shift within steelmaking: Regions expanding industrial capacity can require coking coal supplies; AMR’s ability to serve qualified demand from a mature mining and logistics footprint can support volume retention when procurement cycles rotate.

⚠ Risk Factors to Monitor

  • Commodity and quality spread risk: Metallurgical coal economics depend on coking coal spreads, realized pricing, and blending alternatives that can compress margins during downcycles.
  • Energy transition and process substitution: Growth in electric arc furnace steelmaking, increased scrap use, and alternative ironmaking pathways can reduce long-term blast-furnace intensity and coking coal demand.
  • Regulatory and permitting risk: Environmental regulation affecting coal mining, methane/air emissions, waste handling, and water management can increase sustaining capital and constrain supply.
  • Operational and logistics risk: Mining safety, equipment reliability, and transportation disruptions can affect delivery continuity and customer confidence.
  • Counterparty and contracting dynamics: Procurement strategies, including more aggressive spot buying or specification shifts by steelmakers, can alter pricing power.

πŸ“Š Valuation & Market View

The market typically values metallurgical coal producers on enterprise value and cash generation metrics rather than earnings quality alone, because earnings are strongly tied to commodity cycles. Common valuation frameworks include EV/EBITDA and cash flow yield approaches, supported by asset-specific indicators such as cost curve positioning, reserve quality/life, and throughput sustainability.

Key valuation drivers moving the needle for this group include: (1) unit-cost competitiveness, (2) quality premium durability, (3) logistics effectiveness, and (4) supply-demand balance for premium coking coal versus substitutable inputs.

πŸ” Investment Takeaway

AMR presents a cycle-sensitive but structurally supported investment thesis built around premium metallurgical feedstock, logistics and delivery reliability, and customer switching costs driven by specification qualification in blast-furnace coke and steelmaking. The long-term opportunity rests on maintaining a favorable position in premium coking coal supply while navigating regulatory and energy-transition headwinds.


⚠ AI-generated β€” informational only. Validate using filings before investing.

πŸ“° Market News & Coverage

15 Stories Available

Real-time institutional reporting and market updates for AMR.

marketbeat.comβ€’2026-05-09

Alpha Metallurgical Resources Shareholders Approve All Proposals at Annual Meeting

Alpha Metallurgical Resources NYSE: AMR held its 2026 annual meeting of stockholders via live webcast, with shareholders approving all three proposals presented at the meeting, according to company officials.

marketbeat.comβ€’2026-05-09

Alpha Metallurgical Resources Q1 Earnings Call Highlights

Alpha Metallurgical Resources NYSE: AMR reported a modest sequential increase in adjusted EBITDA for the first quarter of 2026, while management said lower shipment volumes and inflation tied to the war in Iran pushed costs higher during the period.

seekingalpha.comβ€’2026-05-08

Alpha Metallurgical Resources, Inc. (AMR) Q1 2026 Earnings Call Transcript

Alpha Metallurgical Resources, Inc. (AMR) Q1 2026 Earnings Call Transcript

zacks.comβ€’2026-05-08

Alpha Metallurgical (AMR) Reports Q1 Loss

Alpha Metallurgical (AMR) came out with a quarterly loss of $0.86 per share in line with the Zacks Consensus Estimate. This compares to a loss of $2.6 per share a year ago.

prnewswire.comβ€’2026-05-08

Alpha Releases First Quarter 2026 Financial Results

Reports first quarter net loss of $11.0 million Posts Adjusted EBITDA of $30.0 million for the quarter BRISTOL, Tenn., May 8, 2026 /PRNewswire/ -- Alpha Metallurgical Resources, Inc. (NYSE:Β AMR), a leading U.S. supplier of metallurgical products for the steel industry, today reported financial results for the first quarter ending March 31, 2026.

zacks.comβ€’2026-05-04

New Strong Sell Stocks for May 4th

AMR, ABR and AMAL have been added to the Zacks Rank #5 (Strong Sell) List on May 4, 2026.

zacks.comβ€’2026-05-01

Alpha Metallurgical (AMR) Earnings Expected to Grow: What to Know Ahead of Next Week's Release

Alpha Metallurgical (AMR) doesn't possess the right combination of the two key ingredients for a likely earnings beat in its upcoming report. Get prepared with the key expectations.

seekingalpha.comβ€’2026-04-24

Alpha Metallurgical Resources: Cyclical Opportunity, India-Linked Demand Tailwinds

Alpha Metallurgical Resources (AMR) is the leading US producer of premium coking coal, with a strong export orientation and virtually debt-free. AMR exported around ~39% to India over last five years, while India also emerging as an important demand source for metallurgical coal with over 85% percent procured by imports. AMR has significantly reduced its sharecount, by ~30% post buyback start program, returning significant amounts via buybacks while also increasing the earnings attributable to holding shareholders.

prnewswire.comβ€’2026-04-24

Alpha Releases Preliminary Results for First Quarter 2026

BRISTOL, Tenn., April 24, 2026 /PRNewswire/ -- Alpha Metallurgical Resources, Inc. (NYSE: AMR), a leading U.S. supplier of metallurgical products for the steel industry, today announced preliminary financial results for the first quarter ending MarchΒ 31, 2026.

gurufocus.comβ€’2026-04-10

Alpha Metallurgical Resources Inc (AMR) Stock Up 4.0% but GF Value Says Overvalued -- GF Score: 84/100

On April 10, 2026, Alpha Metallurgical Resources Inc (AMR) shares rose 4.0%, closing at $192.52. This movement comes amid a 52-week range of $97.41 to $253.82,

defenseworld.netβ€’2026-04-06

Alpha Metallurgical Resources (NYSE:AMR) and Lifezone Metals (NYSE:LZM) Financial Survey

Alpha Metallurgical Resources (NYSE: AMR - Get Free Report) and Lifezone Metals (NYSE: LZM - Get Free Report) are both basic materials companies, but which is the superior business? We will contrast the two companies based on the strength of their dividends, valuation, earnings, profitability, analyst recommendations, risk and institutional ownership. Analyst Recommendations This is a summary

prnewswire.comβ€’2026-04-03

Miner Suffers Fatal Accident at Horse Creek Eagle Mine

BRISTOL,Β Tenn., April 3, 2026 /PRNewswire/ -- A miner at Horse Creek Eagle Mine in Raleigh County, W.Va.

fool.comβ€’2026-03-27

Alpha Metallurgical Insider Purchase Worth $2 Million Comes Just Weeks Before 20% Rally

A director of Alpha Metallurgical Resources reported buying 10,000 shares for $1.87 million on March 11, 2026. This transaction represented 1.17% of Kenneth S.

fool.comβ€’2026-03-25

Alpha Metallurgical Stock Up 66% as Director Buys Up $1.5 Million in Shares

A director of Alpha Metallurgical Resources reported the purchase of about 8,000 shares for a total of $1.53 million, at a weighted average purchase price of $191.07 per share on March 12, 2026. The transaction increased direct holdings by 0.92% relative to pre-trade levels, with direct post-transaction ownership at 874,537 shares.

defenseworld.netβ€’2026-03-16

Insider Buying: Alpha Metallurgical Resources (NYSE:AMR) Director Buys $1,868,700.00 in Stock

Alpha Metallurgical Resources, Inc. (NYSE: AMR - Get Free Report) Director Kenneth Courtis bought 10,000 shares of the company's stock in a transaction dated Wednesday, March 11th. The stock was purchased at an average price of $186.87 per share, with a total value of $1,868,700.00. Following the completion of the transaction, the director directly owned 866,537

πŸ“Š AI Financial Analysis

Powered by StockMarketInfo
Earnings Data: Q Ending 2026-03-31

"AMR reported Q1 2026 revenue of $525.0M and EPS of -$0.86, with net income of -$11.0M (net margin -2.1%). On a year-ago comparison, Q1 2026 revenue decreased slightly (-1.3% YoY vs. $532.0M in Q1 2025), and net income improved to -$11.0M from -$33.9M (about +67.5% YoY improvement in losses). Sequentially, revenue rose marginally (+0.9% QoQ vs. $520.5M in Q4 2025), while net losses narrowed to -$11.0M from -$17.3M (losses improved ~36% QoQ). Profitability remains volatile: operating income stayed negative, but the trajectory improved versus Q4 (operating income -$1.6M vs. -$21.3M). Net margin improved materially from Q4 (-3.3%) to Q1 (-2.1%). Cash flow showed a modest reboundβ€”operating cash flow was +$29.0M and free cash flow was -$11.6M (capex of -$40.7M), though cash utilization eased QoQ as the quarter’s operating cash generation was higher than Q4. Balance sheet resilience is supported by substantial liquidity (cash & short-term investments $366.9M) and net cash (net debt -$305.0M). Total shareholder returns look strong: the stock is up +61.8% over 1Y, which should materially support the valuation and sentiment despite current earnings weakness. The consensus analyst target ($189.5) is slightly below the current price ($191.7)."

Revenue Growth

Fair

Q1 2026 revenue was $525.0M: +0.9% QoQ vs. $520.5M (Q4 2025) and -1.3% YoY vs. $532.0M (Q1 2025). Growth is modest and slightly negative on a YoY basis.

Profitability

Neutral

Net margin improved to -2.1% in Q1 2026 from -3.3% in Q4 2025. YoY losses narrowed meaningfully: net income improved from -$33.9M (Q1 2025) to -$11.0M (Q1 2026). Operating income also improved sequentially but remains negative.

Cash Flow Quality

Fair

Operating cash flow turned positive at +$29.0M (vs. +$18.97M in Q4). However, free cash flow was still negative at -$11.6M due to -$40.7M capex, indicating cash burn persists despite improving operating performance.

Leverage & Balance Sheet

Good

AMR ended Q1 2026 with $366.9M cash & short-term investments and net cash position (net debt -$305.0M). Total assets were $2.28B and total equity $1.52B, showing reasonable balance-sheet resilience with no near-term leverage pressure.

Shareholder Returns

Strong

Strong momentum supports shareholder returns: +61.8% over 1Y (well above the 20% threshold). Dividend payments were $0 and buybacks were modest (common stock repurchased -$22.9M in Q1), so returns are primarily price-driven.

Analyst Sentiment & Valuation

Caution

Consensus target ($189.5) is slightly below the current price ($191.7). Valuation signals should be tempered by continued profitability headwinds (negative EPS/net income), despite improved sequential trends.

Disclaimer:This analysis is AI-generated for informational purposes only. Accuracy is not guaranteed and this does not constitute financial advice.

Fundamentals Overview

Loading fundamentals overview...

AMR’s Q1 2026 showed solid realization recovery (+$9/ton QoQ average realization to $124.39/ton) driven by stronger Aussie-linked low-vol index levels, partially offset by weaker incidental thermal pricing within the met segment ($69.41/ton vs $77.80/ton). Profitability was pressured by higher costs: met cost of coal sales rose to $107.98/ton from $101.43/ton, with management attributing the move primarily to diesel and other supply/repair inflation. Liquidity declined to $476.2M (from $524.3M), but leverage remained manageable with no ABL borrowings. Management maintained a 2026 cost guidance posture of $95–$101/ton, with conditional upward risk if Iranian-conflict inflation persists. Market dynamics remain bifurcated: low-vol improved on Aussie shortages and index divergence, while high-vol discounts widened due to oversupply from new longwall tonnage and freight-sensitive economics. Q&A emphasized diesel cost cadence, shipment bell-curve timing, and structural drivers behind widening high-vol spreads.

AI IconGrowth Catalysts

  • Improved realizations QoQ led by higher low-vol index levels post-Australia flooding (Australian PLV up to $236.80/mt by Mar 31; $239.8/mt as of May 7).
  • Planning and mitigation of a potential four-week March outage at Dominion Terminal by leveraging Hampton Roads terminal capacity beyond DTA to keep coal moving.
  • Committed/priced tonnage base with midpoint 2026 met segment pricing of $132.03/ton for 48% committed and priced; thermal byproduct fully committed and priced at $74.53/ton (midpoint).

Business Development

  • Dominion Terminal Alliance (DTA) and Hampton Roads terminal partners: coordinated equipment maintenance/upgrades during March outage risk to preserve shipment flow.
  • Ongoing sales allocation/placement into Asian markets (medium-/low-vol) where Aussie-linked pricing can be used for netback optimization; higher-vol into Asia described as discounted heavily.

AI IconFinancial Highlights

  • Adjusted EBITDA of $30.0M vs $28.5M in 2025; sold 3.6M tons vs 3.8M tons.
  • Average realization improved to $124.39/ton in Q1 from $115.31/ton in Q4; export met $110.32/ton vs $106.01/ton; Australian-indexed export coal $144.09/ton vs $114.96/ton.
  • Met segment realization up to $128.40/ton from $118.10/ton; incidental thermal in met down to $69.41/ton from $77.80/ton.
  • Cost of coal sales (met) increased to $107.98/ton from $101.43/ton, driven primarily by higher diesel and other supply/repair costs.
  • SG&A (excluding noncash stock comp and nonrecurring) increased to $13.5M from $10.9M in Q4.
  • Liquidity down to $476.2M (from $524.3M at Dec 31); unrestricted cash down to $317.2M (from $366.0M).
  • Guidance posture: management still targets full-year cost of coal sales within $95–$101/ton top end, but flagged potential upward adjustment if Iranian conflict inflation persists.

AI IconCapital Funding

  • No buyback disclosed in the transcript.
  • ABL facility: no borrowings; $184.3M unused availability at quarter end, partially offset by $75M minimum required liquidity.
  • Letters of credit: $40.7M outstanding as of Mar 31, 2026.
  • CapEx: $40.7M in Q1 vs $29.0M in Q4.
  • Operating cash flow: $29.0M in Q1 vs $19.0M in Q4.

AI IconStrategy & Ops

  • Diesel cost cadence: diesel added β€œa couple of dollars/ton” with late-Feb/Mar impact; management expects full-quarter carry but also expects fixed cost per ton to improve as Q2 productive activity increases and costs spread over more tons (quantum β€œtoo early to tell”).
  • Index spread monitoring: management highlighted unusual divergences in low-vol vs high-vol index relationships and evaluates whether spreads normalize versus persist when aligning portfolio productive capacity to market needs.
  • Freight structure: most sales FOB vessel; chartering/trucking exposure acknowledged with freight rates up materially, implying partial buyer/seller freight sharing depending on spot vs term business.

AI IconMarket Outlook

  • Shipment cadence: management expects a β€œnormal year” bell curve with Q1/Q4 lightest, Q2/Q3 strongest; likely makeup happens in the middle two quarters with tail-off into year-end holidays.
  • 2026 cost guidance reaffirmed with conditional upside risk: finish year within $95–$101/ton cost range if not worsened by Iranian-conflict inflation; otherwise adjust upward.
  • Index trajectory reference points: Aussie PLV rose from $218 (Jan 2) to $236.80/mt (Mar 31), then $239.8/mt as of May 7; US EC Low Vol flat at $195/mt at quarter end and May 7.
  • Pricing commitment (midpoint): met segment 48% committed & priced at $132.03/ton; 43% committed but unpriced; thermal byproduct fully committed & priced at $74.53/ton.

AI IconRisks & Headwinds

  • Diesel and transportation-related inflation: direct diesel plus indirect embedded impacts via delivery and supply/maintenance costs; freight inflation exacerbates spot market economics.
  • High-vol market oversupply: management described high-vol discounts widening due to new longwall high-vol production entering the marketplace (approx. 11M tons new longwall high-vol production cited; Central App incremental 1M–2M tons offline/released), with demand below prior years.
  • Index divergence risk: Australian PLV vs US EC Low Vol β€œgap” currently $45/mt (+23%) and low-to-high-vol A spread $36/mt (+23%); uncertainty whether spreads normalize or persist affects portfolio optimization.
  • Geopolitical/energy volatility: war in Iran cited as driving volatility and potential inflationary impacts; also affects freight rates.

Q&A: Analyst Interest

  • Topic: Q2 cost cadence and diesel carryover: Management said diesel contributed β€œa couple of dollars a ton” due to late-Feb/Mar timing, but indirect diesel impacts show up in delivery, supplies, and maintenance. They expect some improvement in Q2 as activity rises and fixed costs spread, though the exact quantum is β€œtoo early to tell.”
  • Topic: Freight exposure, FOB vs CFR, and what lifts high-vol spot pricing: Management reiterated most business is FOB vessel; chartered freight rose about 40%. They expect spot to need both demand improvement and β€œcontinued supply discipline,” noting oversupply is significant and that higher freight can limit value-aligned blending for distant shipments.
  • Topic: Why high-vol discounts widened vs low-vol strength: Management separated the PLV linkage (Australian index) from high-vol pricing mechanics. They argued East Coast Low Vol is too far below Aussie PLV during shortages, while high-vol behaves differently, depressed by supply/demand and oversupplied new tonnage. They also cited the East Coast High Vol A vs Low Vol differential rising from $5 (early 2025) to $38.

Sentiment: MIXED

Note: This summary was synthesized by AI from the AMR Q1 2026 earnings transcript. Financial data is complex; please verify all metrics against official SEC filings before making investment decisions.

πŸ“‹ Official Regulatory 10-K / 10-Q SEC Filings

Direct authenticated documentation links to audited SEC database reports for AMR.

SEC EDGAR Live Feed
Loading financial data and tables...
πŸ“

SEC Filings (AMR)

Β© 2026 Stock Market Info β€” Alpha Metallurgical Resources, Inc. (AMR) Financial Profile