APA Corporation

APA Corporation (APA) Market Cap

APA Corporation has a market capitalization of $13.19B.

Price: $37.32

0.99 (2.73%)

Market Cap: 13.19B

NASDAQ · time unavailable

CEO: John J. Christmann

Sector: Energy

Industry: Oil & Gas Exploration & Production

IPO Date: 1979-05-15

Website: https://apacorp.com

APA Corporation (APA) - Company Information

Market Cap: 13.19B|Sector: Energy

Company Profile

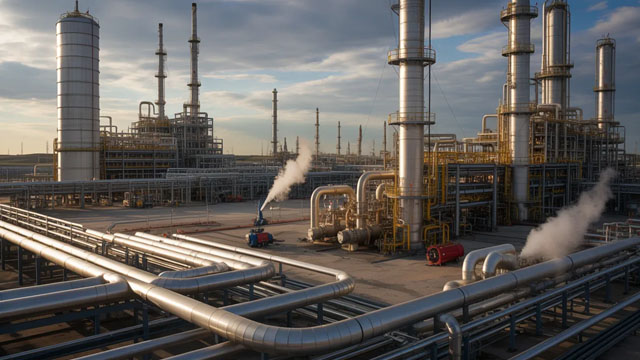
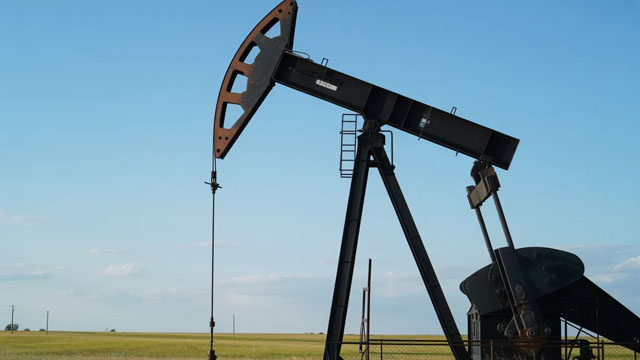
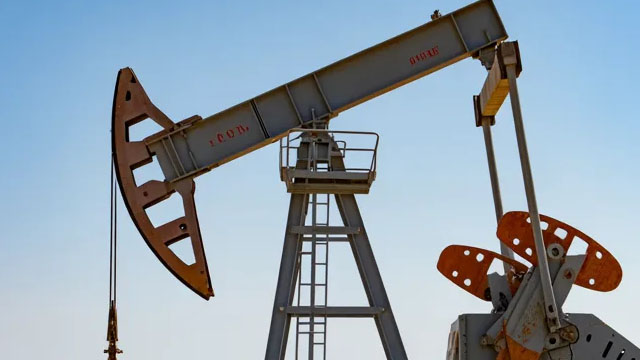
APA Corporation operates in the upstream segment of the oil and natural gas industry, utilizing its various subsidiaries to explore for, develop, and produce hydrocarbon assets. The company maintains significant operational presences in the United States, Egypt, and the United Kingdom, while also conducting exploration activities offshore Suriname. Furthermore, APA Corporation manages critical gathering, processing, and transmission infrastructure within West Texas and holds ownership interests in four major pipelines connecting the Permian Basin to the Gulf Coast. Established in 1954, the company is headquartered in Houston, Texas.

Analyst Sentiment

58%
Buy

From 25 Active Polls

1Y Forecast: $41.22

▲ +10.5% Potential Upside

Consensus Target Metrics

Low Bound

$36

Median

$40

High Bound

$50

Average

$41

Price & Moving Averages

Loading chart...

🎯 Wall Street Analyst Intelligence Report

1-Year structural target targets, chart projections, and sentiment maps.

Average 1Y Target
$41.22
▲ +10.45% Upside
Low Target
$36.00
-4% Risk
Median Target
$40.00
7% Mid
High Target
$50.00
34% Max
Consensus
Hold
20 / 52 Buys

Consensus Trend Projection

Trailing closures vs. 12-month metrics map.

Analyst Vote Distribution

Aggregate institutional coverage sentiment weights.

📊 Historical Valuation Multiples

Real-time Trailing Twelve Month (TTM) momentum side-by-side with discrete quarterly metrics.

Fiscal QuarterTTMQ1 2026Q4 2025Q3 2025Q2 2025Q1 2025Q4 2024Q3 2024Q2 2024
Period EndingTrailing 12MMar 31, 2026Dec 31, 2025Sep 30, 2025Jun 30, 2025Mar 31, 2025Dec 31, 2024Sep 30, 2024Jun 30, 2024
Market Cap ($M)13,19215,0248,6838,7656,6217,6518,5209,05010,993
Enterprise Value ($M)17,43519,26712,97712,88111,17813,07514,05715,45617,679
Price to Earnings Ratio (P/E)8.708.427.7410.652.745.536.01-10.195.07
Price/Earnings-to-Growth Ratio (PEG)0.500.840.17
Price to Sales Ratio (P/S)1.536.464.364.143.042.903.143.584.32
Price to Book Ratio (P/B)2.052.331.431.471.121.411.611.772.03
Price to Free Cash Flow Ratio (P/FCF)8.881251.9839.8311.8312.8825.0024.9119.1790.85
Enterprise Value to Sales (EV/Sales)8.286.526.095.134.965.186.116.95
Enterprise Value to EBITDA (EV/EBITDA)3.1011.5811.0411.056.878.7610.5143.4210.93
Debt to Equity Ratio0.750.700.790.770.791.011.171.271.26

📘 Full Research Report

ℹ️

AI-Generated Research: This report is for informational purposes only.

📘 APA CORP (APA) — Investment Overview

🧩 Business Model Overview

APA Corporation is an upstream energy company that explores for, develops, and produces crude oil, natural gas, and natural gas liquids (NGLs). The business converts subsurface resources into cash flows through a repeatable cycle: (1) identify and appraise drilling opportunities, (2) execute large-scale drilling and completion programs, and (3) gather and transport production to market via owned/contracted midstream and contracted transportation capacity. Margin realization depends on both production efficiency (finding and development costs, decline rates, uptime) and logistics (basis differentials, takeaway constraints, and the ability to access premium regional pricing).

💰 Revenue Streams & Monetisation Model

Revenue is primarily driven by the sale of hydrocarbons: oil, natural gas, and NGLs. Monetisation is largely transactional (commodity price multiplied by volumes), but with economic support from operational consistency and, where applicable, midstream/transport arrangements that reduce netback volatility. Key margin drivers include:

  • Netback quality: realized prices versus benchmark curves, influenced by regional basis differentials.
  • Cost structure: lifting costs and capital efficiency (cost per incremental barrel of oil equivalent).
  • Production mix: the relative contribution of oil and NGLs versus dry gas, given different pricing and margin characteristics.

Overall profitability is most sensitive to production volumes, realized commodity pricing, and unit costs—areas where operational execution and infrastructure positioning matter materially.

🧠 Competitive Advantages & Market Positioning

APA’s competitive positioning is rooted in upstream “geography + logistics” economics—an operational moat that can be durable when paired with high-quality acreage, efficient development, and access to favorable takeaway. The main sources of durability are:

  • Geographic cost advantage (low-cost development economics): focus on resource basins with established infrastructure and learnings from dense development, supporting repeatability in drilling and completions.
  • Logistical infrastructure and market access: ability to connect production to pipeline networks and processing/transport routes that minimize basis penalties and reduce downtime.
  • Operational learning curve: scale in core areas supports efficiencies in drilling, completions, maintenance, and supply-chain execution.

Competitive benchmarking (primary peers): Devon Energy and Pioneer Natural Resources are major US E&P competitors with significant positions in liquids-rich plays and intensive drilling programs. Occidental Petroleum also competes for capital in large-scale unconventional resource development. Compared with these peers, APA’s emphasis is on building and sustaining production in core regions where logistical access and basin-specific development economics can support stronger netbacks, rather than relying solely on marginal lease additions. The competitive distinction tends to show up in net realized pricing (basis/outlet access) and unit-cost discipline relative to the commodity cycle.

🚀 Multi-Year Growth Drivers

Over a 5–10 year horizon, the growth outlook for APA is best framed around controllable drivers (capital allocation and operational execution) and structural market drivers (supply-demand balance and gas infrastructure needs). Key factors include:

  • Development in resource plays with repeatable well economics: continuing to convert drilling inventory into production while sustaining productivity through engineering and operational optimization.
  • Production mix and NGL capture: maximizing liquids and NGL-related economics through development plans that favor higher-value gradients and better fractionation/processing access.
  • Infrastructure and takeaway monetisation: prioritizing projects that improve netback by reducing basis exposure and enhancing access to higher-demand markets.
  • Natural gas and NGL demand support: gas and NGL end-markets benefit from ongoing industrial and power generation needs, with regional constraints often shaping realized spreads and investment requirements.

Importantly, upstream “growth” in this context is not only about volume growth; it is also about sustaining per-unit returns through disciplined capital budgeting, decline management, and logistics-enabled netback optimization.

⚠ Risk Factors to Monitor

  • Commodity price cyclicality: oil and gas realizations can swing profitability rapidly, and capital plans may require adjustment to maintain returns.
  • Operational execution risk: well performance variability, downtime, and supply-chain constraints can pressure volumes and unit costs.
  • Infrastructure and basis risk: pipeline capacity constraints, processing limitations, or adverse basis movements can reduce realized prices even with stable benchmark curves.
  • Regulatory and environmental exposure: permitting, emissions requirements, water management, and asset-specific compliance costs can affect timelines and economics.
  • Capital intensity and financing conditions: unconventional development remains capital-demanding; access to capital and balance sheet flexibility influence strategic optionality.

📊 Valuation & Market View

Market valuation for upstream E&P companies typically centers on metrics that connect cash generation to reserves and development quality. Common valuation frameworks include:

  • EV/EBITDA and EV/Production-based measures: sensitive to commodity prices, hedging discipline, and operating cost control.
  • Cash flow yield and free cash flow durability: investors focus on the ability to sustain distributions or reinvest while maintaining balance sheet resilience.
  • Reserve quality and implied value of acreage: emphasis on reserve replacement economics, resource longevity, and development scalability.

Key valuation “needle movers” typically include sustained unit-cost performance, improvement in netbacks through logistics, reserve life/quality, and credible capital allocation that preserves optionality through commodity cycles.

🔍 Investment Takeaway

APA’s long-term investment case rests on an operational and infrastructure-driven moat: developing resources in basins where geographic economics and logistics can support favorable netbacks, paired with repeatable execution that helps maintain unit-cost discipline. The primary swing factors remain commodity prices and infrastructure/basis realizations, but disciplined capital allocation and operational learning offer a pathway to consistently attractive returns relative to peers when market conditions stabilize.


⚠ AI-generated — informational only. Validate using filings before investing.

📰 Market News & Coverage

15 Stories Available

Real-time institutional reporting and market updates for APA.

gurufocus.com2026-07-31

EnerCom Announces SM Energy as a Keynote Speaker at the 31st EnerCom Denver - The Energy Investment Conference, on August 19, 2026, in Denver, Colorado

EnerCom Announces SM Energy as a Keynote Speaker at the 31st EnerCom Denver - The Energy Investment Conference, on August 19, 2026, in Denver, C

zacks.com2026-07-30

APA Corp Gears Up to Report Q2 Earnings: Here's How It Will Fare

APA heads into Q2 earnings with lower revenue expectations as production and pricing pressures weigh, though reduced costs could help support results.

gurufocus.com2026-07-29

A Look at APA Corp (APA) After 5.0% Gain -- GF Value $25.67 vs Price $36.71

On July 29, 2026, APA Corp (APA) shares rose by 5.0%, bringing the current price to $36.71. This price is significantly higher than the 52-week low of $17.87 bu

zacks.com2026-07-29

APA (APA) Earnings Expected to Grow: Should You Buy?

APA (APA) doesn't possess the right combination of the two key ingredients for a likely earnings beat in its upcoming report. Get prepared with the key expectations.

gurufocus.com2026-07-27

APA Corp (APA) Shares Fall 3.9% -- GF Value Says Still Overvalued

On July 27, 2026, APA Corp (APA) shares fell 3.9%, closing at $34.74. The stock has experienced a 52-week range of $17.87 to $45.66, indicating a significant le

zacks.com2026-07-27

APA (APA) Stock Declines While Market Improves: Some Information for Investors

In the closing of the recent trading day, APA (APA) stood at $34.74, denoting a -3.9% move from the preceding trading day.

defenseworld.net2026-07-23

D.A. Davidson & CO. Decreases Stock Position in APA Corporation $APA

D.A. Davidson and CO. lessened its stake in shares of APA Corporation (NASDAQ: APA) by 57.7% in the undefined quarter, according to its most recent 13F filing with the Securities and Exchange Commission. The fund owned 31,904 shares of the company's stock after selling 43,596 shares during the period. D.A. Davidson and CO.'s

defenseworld.net2026-07-22

Allspring Global Investments Holdings LLC Sells 21,335 Shares of APA Corporation $APA

Allspring Global Investments Holdings LLC reduced its stake in APA Corporation (NASDAQ: APA) by 7.0% during the undefined quarter, according to its most recent 13F filing with the Securities and Exchange Commission. The institutional investor owned 284,860 shares of the company's stock after selling 21,335 shares during the quarter. Allspring Global Investments Holdings

defenseworld.net2026-07-22

APA Corporation $APA Shares Acquired by California Public Employees Retirement System

California Public Employees Retirement System raised its position in APA Corporation (NASDAQ: APA) by 21.3% in the first quarter, according to its most recent Form 13F filing with the SEC. The institutional investor owned 818,301 shares of the company's stock after buying an additional 143,922 shares during the period. California Public Employees Retirement

globenewswire.com2026-07-20

ARRAY Technologies to Host APA Investor Technology Showcase on August 20, 2026

ALBUQUERQUE, N.M., July 20, 2026 (GLOBE NEWSWIRE) -- ARRAY Technologies (NASDAQ: ARRY) (“ARRAY” or the “Company”), a leading global provider of solar tracking technology and fixed-tilt products, foundation solutions, software systems and services, today announced that it will host an APA Investor Technology Showcase on Thursday, August 20, 2026, beginning at 9:00 a.m. ET.

zacks.com2026-07-17

APA (APA) Gains As Market Dips: What You Should Know

APA (APA) reached $35.22 at the closing of the latest trading day, reflecting a +2.74% change compared to its last close.

zacks.com2026-07-09

APA (APA) Stock Drops Despite Market Gains: Important Facts to Note

In the latest trading session, APA (APA) closed at $33.29, marking a -5.05% move from the previous day.

globenewswire.com2026-07-08

APA Corporation provides second-quarter 2026 supplemental information and schedules results conference call for Aug. 6 at 10 a.m. Central time

HOUSTON, July 08, 2026 (GLOBE NEWSWIRE) -- APA Corporation (Nasdaq: APA) today provided supplemental information regarding certain second-quarter 2026 financial and operational results. This information is intended only to provide additional information regarding current estimates management believes will affect results for the second quarter of 2026. It is provided to assist investors, analysts and others in formulating their own estimates and is not intended to be a comprehensive presentation of all factors that will affect second-quarter 2026 results. Actual results and the impact of factors identified here may vary and are subject to finalization of the financial reporting process for the second quarter of 2026.

globenewswire.com2026-07-07

APA Corporation Releases 2026 Sustainability Progress Report

HOUSTON, July 07, 2026 (GLOBE NEWSWIRE) -- APA Corporation (Nasdaq: APA) today released its 2026 Sustainability Progress Report and accompanying disclosures, highlighting progress across its sustainability priorities during 2025. The report outlines APA's approach to sustainability management and provides updates on emissions performance, water stewardship, employee engagement and community investment.

zacks.com2026-07-02

Here's Why APA (APA) is a Strong Growth Stock

The Zacks Style Scores offers investors a way to easily find top-rated stocks based on their investing style. Here's why you should take advantage.

📊 AI Financial Analysis

Powered by StockMarketInfo
Earnings Data: Q Ending 2026-03-31

"APA (Q1 2026, ended 2026-03-31): Revenue $2.33B (QoQ -16.9%, YoY -11.8%); Net Income $446M (QoQ +59.9%, YoY +28.5%); EPS $1.26 (QoQ +59.5%, YoY +32.6%). Profitability improved sequentially: net profit margin rose to 19.2% from 14.0% in Q4 2025, and gross profit quality remained very high on paper (gross margin 96.8%). Over the full 4-quarter stretch, margins were volatile—Q3/Q4 2025 showed materially lower margins than Q1 2026—indicating earnings power is sensitive to costs and below-the-line items. Cash flow remained pressured by CapEx intensity, but operating cash generation strengthened sequentially: operating cash flow $554M (QoQ -31.5%, YoY +32.4%) versus capex of -$542M, producing modest free cash flow of ~$12M. Dividends were paid at -$88M (payout ratio ~19.7% of earnings), and there were no repurchases in the quarter per the cash flow statement. Balance sheet resilience appears mixed: assets were broadly stable to slightly down (total assets $18.1B vs $19.0B in Q4), while net debt stayed high at ~$4.12B. On total shareholder return, market momentum is strong: the stock is up +132.5% over 1 year (plus an indicated dividend yield ~0.6%)."

Revenue Growth

Neutral

Revenue declined QoQ (-16.9%) and YoY (-11.8%), suggesting demand/pricing or production/realization headwinds despite stronger earnings.

Profitability

Good

Net income rose QoQ (+59.9%) and YoY (+28.5%), with net margin expanding to 19.2% from 14.0% in the prior quarter. Margins were volatile across the four-quarter window, but Q1 2026 shows clear sequential improvement.

Cash Flow Quality

Fair

Operating cash flow declined QoQ (-31.5%) but increased YoY (+32.4%). Free cash flow was thin in Q1 2026 (~$12M) due to heavy capex (-$542M), limiting cushion despite positive earnings.

Leverage & Balance Sheet

Neutral

Total assets were slightly lower QoQ ($18.1B vs $19.0B). Equity improved QoQ ($7.40B vs $7.00B), but leverage remains meaningful with net debt around $4.12B.

Shareholder Returns

Excellent

Total return tailwind is strong: +132.5% 1-year price change. Dividend yield is modest (~0.6% indicated), and buybacks were not evident in Q1 2026 cash flow.

Analyst Sentiment & Valuation

Positive

Price vs consensus target appears constructive: current price $35.74 vs target consensus ~$32.46 (stock trading above consensus). With high momentum, sentiment likely supportive even if valuation may be demanding.

Disclaimer:This analysis is AI-generated for informational purposes only. Accuracy is not guaranteed and this does not constitute financial advice.

Fundamentals Overview

Loading fundamentals overview...

APA delivered Q1 strength with GAAP EPS of $1.26 and adjusted EPS of $1.38, supported by $477M free cash flow and disciplined cost/capex execution below guidance. While Q1 gas volumes were curtailed by weak Waha pricing and Egypt adjusted volumes fell due to PSC accounting effects from higher Brent, management highlighted improving Permian uptime and Egypt waterflood-driven reliability. The company raised full-year U.S. oil to 122,000 bpd and maintained upstream capex at $2.1B, with LOE guidance unchanged. Financially, net debt rose modestly to $4.1B after working-capital build, but APA repaid $634M of near-term bonds (including $555M in April), driving >$60M interest savings and lowering expected 2026 interest expense by ~$150M run-rate versus 2024. The key debate is capital deployment mix: management emphasized patience under volatile conditions, decommissioning planned activity (+$20M), and ongoing progress toward the $3B net debt target that could unlock further returns if achieved near-term.

AI IconGrowth Catalysts

  • Permian: higher oil production vs guidance driven by operational efficiencies and improved uptime while fewer rigs/lower capital intensity sustain volumes
  • Egypt: targeted waterflood investments, more efficient workover program, and higher uptime moderating effective base decline; newly acquired acreage supporting ambitious 2026 targets
  • Suriname: Grand Morgue development remains on track for mid-2028 first oil, expected to be a long-term organic free-cash-flow growth engine
  • Exploration: Alaska reprocessed seismic supports a two-well winter program (exploration plus appraisal) after pausing Sockeye drilling

Business Development

  • Alaska: seismic reprocessing with partners; operations “assumed” for a two-well winter program (exploration well + appraisal well)
  • Suriname: exploration activity discussed in Blocks 58 and 53; appraisal wells at Crab Dagu were used to derisk an exploration play from a seismic perspective (partnered development implied)
  • Gas trading / transport: marketing book $1.1 billion 2026 pretax cash flow largely tied to pipeline transport; references to GCX expansion, Blackcomb pipeline, and GCX Hidalgo coming online in 2H
  • Egypt: partner-related PSC mechanisms referenced; modernization and backlog cost recovery from the 2021 PSC modernization completed in Q1

AI IconFinancial Highlights

  • GAAP net income $446 million or $1.26/diluted share; adjusted net income $489 million or $1.38/diluted share after $37 million after-tax unrealized derivative losses
  • Free cash flow $477 million in Q1; $88 million returned to shareholders
  • Cost discipline: capital spend and operating costs below guidance despite inflationary pressures (Permian oil outperformance; gas curtailed due to weak Waha pricing)
  • U.S. BOE outlook: assumes continued natural gas curtailments through end of Q2 driven by forward strip for Waha pricing; no price-related curtailments assumed in 2H
  • Egypt adjusted total production: ~2/3 of Q2 vs Q1 decline tied to higher Brent prices (PSC volume adjustment, not gross production change); remainder from successful recovery of backlog costs from 2021 PSC modernization completed in Q1
  • 2026 upstream capital guidance unchanged at $2.1 billion; guidance cadence: ~55% spent in 1H with most Permian turn-in-lines occurring in 2Q/3Q
  • Current taxes: 2026 U.S. and U.K. current tax expense expected ~$230 million, nearly all in U.K.; U.K. subject to 78% effective tax rate
  • Oil/gas trading: 2026 pretax cash flow expected ~$1.1 billion inclusive of hedges, reflecting wider Waha basis and higher LNG prices vs prior update

AI IconCapital Funding

  • Balance sheet: net debt $4.1 billion at Q1 end vs $4.0 billion at 12/31/2025
  • Working-capital use: increase in total company receivables driven by late-quarter oil price rise; plus payout of incentive compensation accrued through 2025
  • Near-term bond maturities: $634 million repaid year-to-date, including $555 million in April
  • Interest savings: more than $60 million vs last year attributable to repaid near-term maturities; annual interest expense expected ~$150 million lower run-rate at end of 2026 vs 2024
  • No debt maturities until December 2029, providing financial flexibility to manage decommissioning liabilities
  • Full-year free cash flow expectation: ~$2.2 billion; supports progress toward $3 billion net debt target and shareholder returns

AI IconStrategy & Ops

  • Permian efficiency: improved capital efficiency with resilient oil volumes using fewer rigs; cost leadership across key categories continues with visibility to further progress
  • Gas volumes: curtailed in Q1 due to weak Waha pricing
  • Egypt production management: waterflood investment, improved workover program, and increased uptime moderate decline; gas development expanded to build a more durable total production foundation
  • Cost reductions: on track to achieve $450 million cumulative run-rate savings by end of 2026
  • Run-rate cash costs: expected to be $600 million lower exiting 2026 vs 2024 (includes interest savings discussed)
  • Exploration spend guidance context: 2026 exploration guidance ~$70 million total (about $20 million for ice roads in Alaska and ~$50 million for exploration in Suriname); exploration spend previously noted as < $75 million last year as well
  • Decommissioning: guidance raised by $20 million for 2026; characterized as increased planned activity (additional platform wells in Gulf of Mexico) rather than cost increase of planned activity

AI IconMarket Outlook

  • Full-year U.S. oil production outlook raised to 122,000 barrels per day (Permian)
  • Egypt: adjusted volume guidance lowered to reflect PSC impacts of higher commodity prices; no change to upstream capital or LOE guidance
  • Q2 U.S. BOE: assumes natural gas curtailments continue through end of Q2; 2H assumes no price-related curtailments
  • Egypt oil gross volumes: for next three quarters, expected ~118,000 bpd oil per quarter (about 2.5% to 3% decline vs the prior four-quarter average)
  • Suriname: Grand Morgue first oil on track for mid-2028
  • Trading economics: expected ~ $300 million of 2026 gas trading from LNG for remainder of year; overall $1.1 billion pretax 2026 cash flow; basis tightening into 2027 with >$400 million expected pretax cash flow in 2027 at current strip

AI IconRisks & Headwinds

  • Waha pricing weakness driving gas curtailments through end of Q2 (and Q1 gas volumes curtailed)
  • PSC accounting impacts: higher Brent reduces adjusted volumes under cost-recovery mechanism despite higher profitability
  • Inflationary pressure: diesel and power costs noted as drivers; diesel expected to push up Egypt LOE, partially offset by U.S. savings
  • Macro/geopolitical: Middle East escalation causing market volatility; operational teams report safe Egypt operations but uncertainty persists
  • Decommissioning execution: ARO/ARO-management requires cash planning though runway is available (no maturities until 12/2029)

Q&A: Analyst Interest

  • Topic: Gas trading economics and hedging/protection tools for 2026-2027 volatility. Management: $1.1B 2026 pretax cash flow largely pipeline transport (~$300M LNG remainder of year); wide basis differentials compress as GCX expansion/Blackcomb/GCX Hidalgo come online in 2H; basis tightens into 2027 with ~$400M expected pretax cash flow at strip; hedges on basis for this year and potential basis/LNG hedges for 2027 if “right opportunity” appears.
  • Topic: Alaska exploration timing and how reprocessed seismic changes the drill plan. Management: winter pause to reprocess seismic; Sockeye drilled previously not as top prospect but best seismic picture; integrating Sockeye/King Street results into the new reprocessed seismic led to the conclusion they would not drill Sockeye “even in the thickest place”; returning this winter with a two-well program (exploration plus appraisal) and “very, very excited” outlook.
  • Topic: Egypt oil vs gas allocation and what prices do to the rig split/workover intensity. Management: negotiated gas price geared to a $75–$80 Brent environment; current program needs gas—expects ~50/50 rig counts between gas and oil; saving “about two LNG cargoes a month” via gas side; for Egypt oil gross volumes, long-term slight decline but recent stability; marginal new gas price higher than average ~$4.25 gas; workover rig count mid to high teens.

Sentiment: MIXED

Note: This summary was synthesized by AI from the APA Q1 2026 earnings transcript. Financial data is complex; please verify all metrics against official SEC filings before making investment decisions.

📋 Official Regulatory 10-K / 10-Q SEC Filings

Direct authenticated documentation links to audited SEC database reports for APA.

SEC EDGAR Live Feed
Loading financial data and tables...
📁

SEC Filings (APA)

© 2026 Stock Market Info — APA Corporation (APA) Financial Profile