Anteris Technologies Global Corp. (AVR) Market Cap
Anteris Technologies Global Corp. has a market capitalization of $288.4M.
Price: $7.84
▼ -0.40 (-4.85%)
Market Cap: 288.42M
NASDAQ · time unavailable
CEO: Wayne Geoffrey Paterson
Sector: Healthcare
Industry: Medical - Devices
IPO Date: 2024-12-13
Website: https://anteristech.com
Anteris Technologies Global Corp. (AVR) - Company Information
Market Cap: 288.42M|Sector: Healthcare
Company Profile
Anteris Technologies Global Corp. is a structural heart innovator dedicated to discovering, developing, and bringing to market medical devices that enhance the well-being of patients grappling with aortic stenosis. The company's premier offering is the DurAVR transcatheter heart valve system, a pioneering transcatheter aortic valve engineered to treat aortic stenosis by precisely emulating the performance of a healthy human aortic valve. Beyond this, Anteris develops ADAPT anti-calcification tissue, a unique preparation that transforms xenograft tissue into robust bioscaffolds. These bioscaffolds are designed to simulate human tissue for various surgical repairs, notably in aortic valve replacement. Additionally, the ComASUR delivery system, a physician-designed balloon-expandable apparatus, features a reinforced, steerable catheter. This allows for highly accurate navigation through cardiac anatomy in a controlled manner, thereby mitigating potential damage to the aorta. Founded in 1999, Anteris Technologies Global Corp. operates out of Toowong, Australia.
Analyst Sentiment
From 3 Active Polls
1Y Forecast: $18.00
▲ +129.6% Potential Upside
Consensus Target Metrics
Low Bound
$18
Median
$18
High Bound
$18
Average
$18
Price & Moving Averages
🎯 Wall Street Analyst Intelligence Report
1-Year structural target targets, chart projections, and sentiment maps.
Consensus Trend Projection
Trailing closures vs. 12-month metrics map.
Analyst Vote Distribution
Aggregate institutional coverage sentiment weights.
📊 Historical Valuation Multiples
Real-time Trailing Twelve Month (TTM) momentum side-by-side with discrete quarterly metrics.
| Fiscal Quarter | TTM | Q1 2026 | Q4 2025 | Q3 2025 | Q2 2025 | Q1 2025 | Q4 2024 | Q3 2024 | Q2 2024 |
|---|---|---|---|---|---|---|---|---|---|
| Period Ending | Trailing 12M | Mar 31, 2026 | Dec 31, 2025 | Sep 30, 2025 | Jun 30, 2025 | Mar 31, 2025 | Dec 31, 2024 | Sep 30, 2024 | Jun 30, 2024 |
| Market Cap ($M) | 288 | 131 | 118 | 106 | 89 | 86 | 132 | 201 | 201 |
| Enterprise Value ($M) | 9 | -149 | 107 | 99 | 64 | 39 | 62 | 194 | 196 |
| Price to Earnings Ratio (P/E) | -1.96 | -1.49 | -1.01 | -1.20 | -1.06 | -0.98 | -1.70 | -2.30 | -2.69 |
| Price/Earnings-to-Growth Ratio (PEG) | — | -0.03 | — | — | -0.10 | -0.26 | — | -0.11 | — |
| Price to Sales Ratio (P/S) | 155.82 | 264.88 | 379.51 | 247.31 | 144.59 | 154.35 | 245.40 | 261.73 | 318.69 |
| Price to Book Ratio (P/B) | 0.66 | 0.47 | -1265.04 | 28.69 | 3.66 | 1.98 | 2.10 | 63.90 | 70.19 |
| Price to Free Cash Flow Ratio (P/FCF) | -3.33 | -4.54 | -6.27 | -5.58 | -4.45 | -3.95 | -7.07 | -13.73 | -14.36 |
| Enterprise Value to Sales (EV/Sales) | — | -300.86 | 346.31 | 231.53 | 103.12 | 69.94 | 116.57 | 252.07 | 310.41 |
| Enterprise Value to EBITDA (EV/EBITDA) | -0.10 | 6.77 | -3.75 | -4.56 | -3.09 | -1.81 | -2.96 | -9.58 | -10.64 |
| Debt to Equity Ratio | 3.01 | 0.01 | -24.54 | 0.64 | 0.12 | 0.05 | 0.02 | 0.86 | 0.66 |
📰 Market News & Coverage
15 Stories AvailableReal-time institutional reporting and market updates for AVR.
Pennon returns to profit after water bill hikes
Pennon Group PLC (LSE:PNN, OTC:PEGRY) returned to the black in its latest financial as higher regulatory allowances and increased water consumption boosted...

Anteris Advances Global PARADIGM Expansion with French Regulatory Clearance
MINNEAPOLIS and BRISBANE, Australia, June 08, 2026 (GLOBE NEWSWIRE) -- Anteris Technologies Global Corp. (“Anteris” or the “Company”) (NASDAQ: AVR, ASX: AVR) announced today that it has received full regulatory clearance from the French National Agency for Medicines and Health Products Safety (ANSM) for the DurAVR® Transcatheter Heart Valve (THV) global pivotal trial in patients with severe calcific aortic stenosis (the “PARADIGM Trial”). This authorization marks a significant milestone in the Company's clinical and regulatory strategy and enables patient recruitment to commence at leading centers in France.

Anteris Appoints Susan Knight and Stephen Denaro to its Board of Directors
MINNEAPOLIS and BRISBANE, Australia, May 13, 2026 (GLOBE NEWSWIRE) -- Anteris Technologies Global Corp. (“Anteris” or the “Company”) (NASDAQ: AVR, ASX: AVR) a global structural heart company committed to designing, developing, and commercializing cutting-edge medical devices to restore healthy heart function, announced the appointment of Ms. Susan Knight and Mr.
Anteris adds Susan Knight, Stephen Denaro to board as company advances heart valve strategy
Anteris Technologies Pty Ltd (ASX:AVR, NASDAQ:AVR) has strengthened its board with the appointments of experienced healthcare and finance executive Susan...
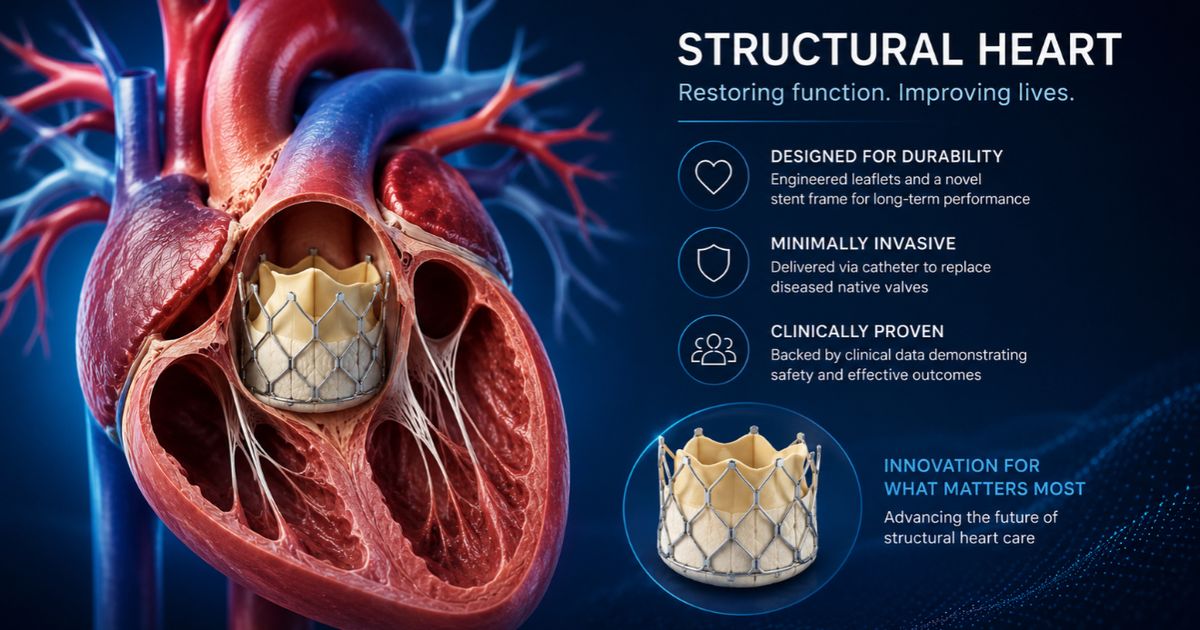
Anteris advances PARADIGM trial as Q1 cash burn reflects commercialisation push
Anteris Technologies Pty Ltd (ASX:AVR, NASDAQ:AVR) has reported strong operational progress for the March 2026 quarter as the company advanced recruitment...
Anteris Announces Results for the First Quarter of 2026
MINNEAPOLIS and BRISBANE, Australia, May 12, 2026 (GLOBE NEWSWIRE) -- Anteris Technologies Global Corp. ("Anteris" or the "Company") (NASDAQ: AVR, ASX: AVR) a global structural heart company committed to designing, developing, and commercializing cutting-edge medical devices to restore healthy heart function, today reported financial results for the quarter ended March 31, 2026, and provided a corporate update.

Anteris Announces Results for the First Quarter of 2026
MINNEAPOLIS and BRISBANE, Australia, May 12, 2026 (GLOBE NEWSWIRE) -- Anteris Technologies Global Corp. (“Anteris” or the “Company”) (NASDAQ: AVR, ASX: AVR) a global structural heart company committed to designing, developing, and commercializing cutting-edge medical devices to restore healthy heart function, today reported financial results for the quarter ended March 31, 2026, and provided a corporate update. Q1 2026 Highlights Completed aggregate capital raises totalling $320 million in January 2026 to support execution of the PARADIGM Trial and advance the Company toward global commercialization of the DurAVR® THV System Advanced PARADIGM Trial recruitment, supported by ongoing regulatory and operational work to activate additional countries and sites – post quarter-end, U.S. enrollment commenced Presented clinical data from the ongoing EMBARK Study and U.S. Early Feasibility Study (EFS) at Cardiovascular Research Technologies (CRT 2026) and Sydney Valves 2026, supporting ongoing scientific engagement and exchange with the clinical community “Q1 2026 reflects strong execution across the PARADIGM Trial, with patient enrollment ongoing in Europe and continued progress on key recruitment activities globally.
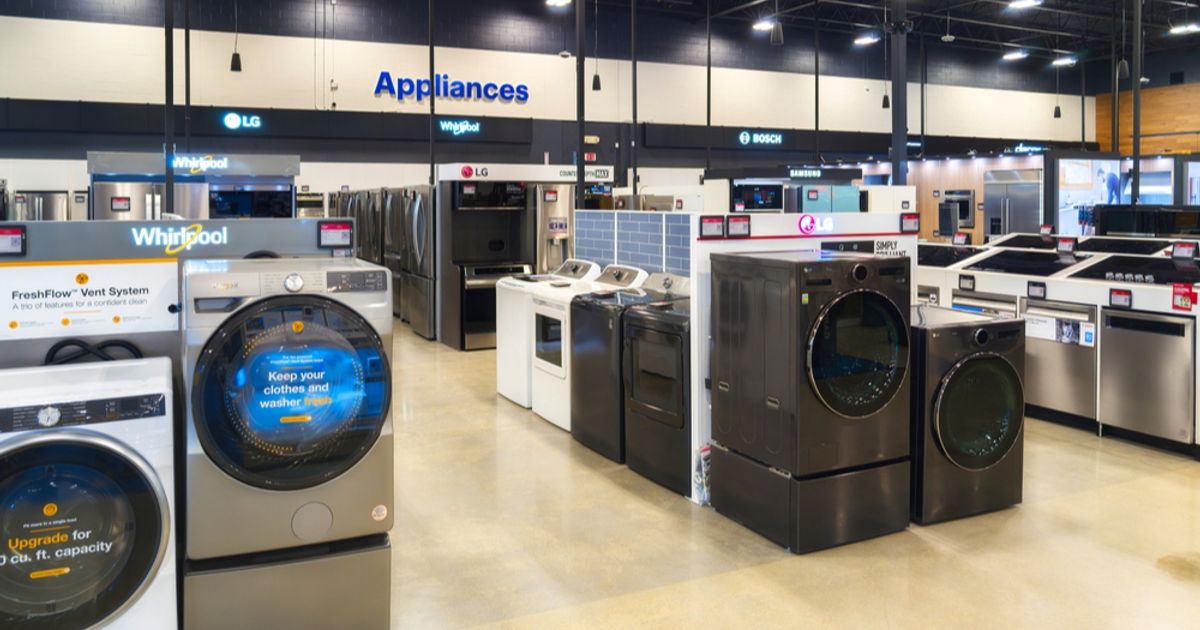
Whirlpool cuts forecast, suspends dividend as Iran war hammers demand
Whirlpool Corporation (NYSE:WHR) reported a steep first-quarter loss and slashed its full-year outlook, citing rapid deterioration in macroeconomic...

Dow Jones set for flat start as market await Iran response to US peace deal
US stocks are tipped to open modestly positively on Thursday as markets await a response from Tehran to Washington's proposed peace plan. Dow Jones futures...
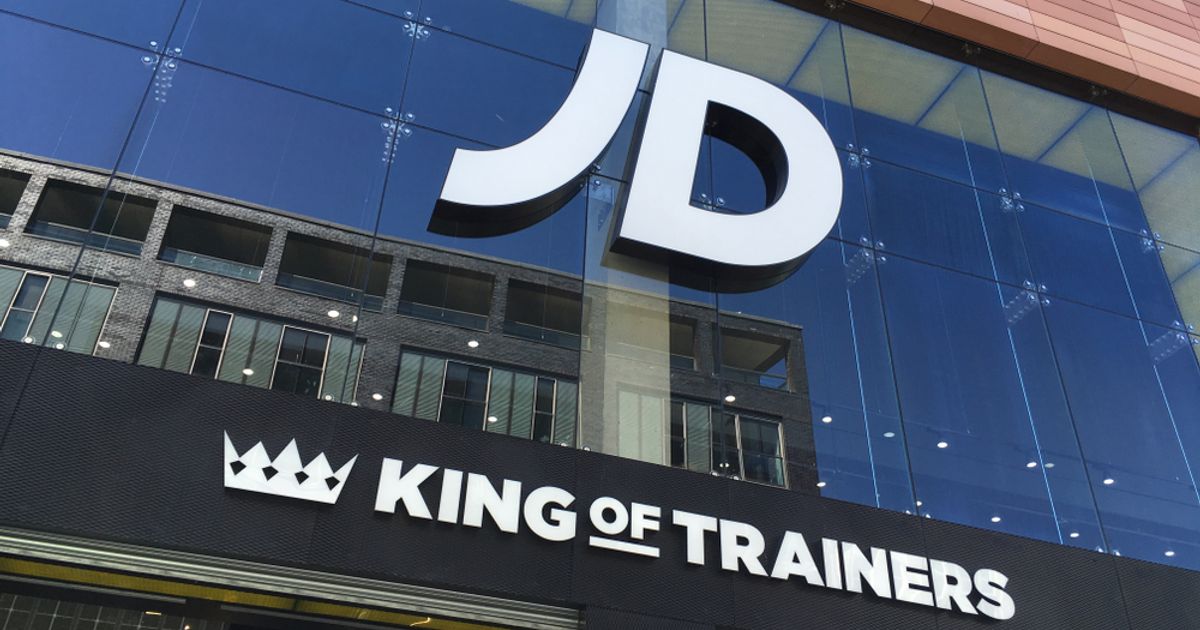
JD Sports preview: signs of recovery in focus ahead of World Cup
JD Sports Fashion PLC (LSE:JD., OTC:JDSPY) is set to report full-year results on Thursday, with investors focused on signs of demand recovery and guidance...

Voyager Technologies narrows loss in Q1 as revenue comes in below expectations
Voyager Technologies (NYSE:VOYG) shares were little changed at about $26 on Wednesday afternoon after the aerospace and defense company reported mixed...

Nasdaq and S&P surge to new records on Iran deal hopes, AMD and Disney gains
11:40am: A euphoric state Markets are getting a bit euphoric on "flimsy" news, according to IG's chief market analyst, Chris Beauchamp. “Once more stocks...
Small Cap Watch: Small Ordinaries edges higher as company news flow continues
The S&P/ASX Small Ordinaries [XSO] closed at 3,458.80, gaining 15.20 points or 0.44% in the latest session. Over the past five days, the index has added...
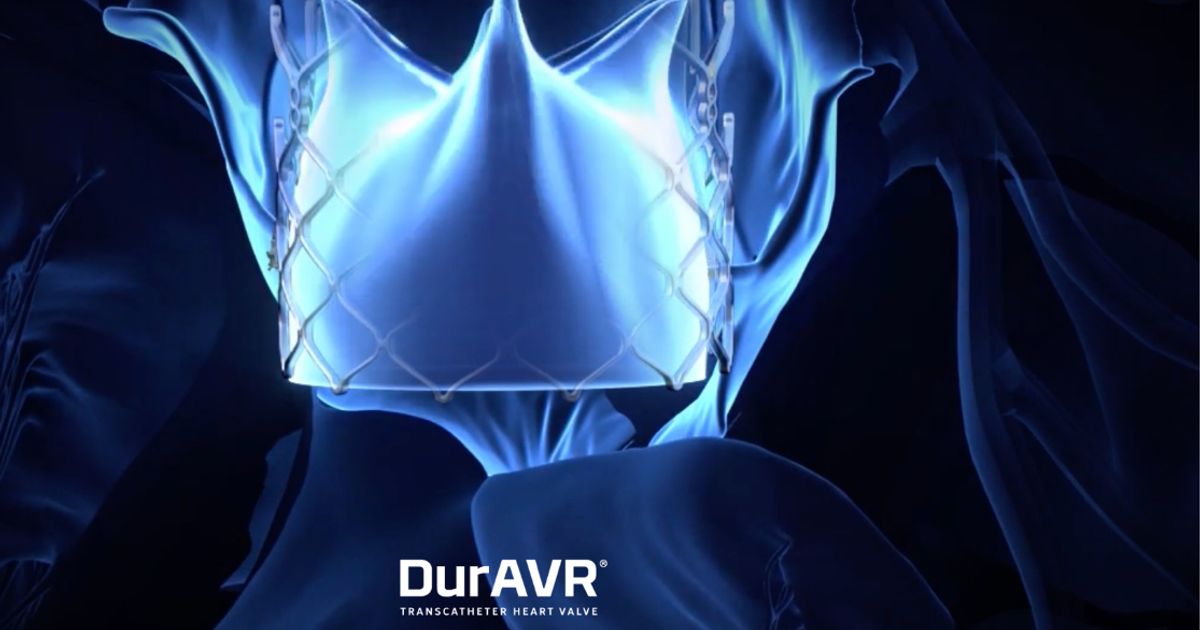
Anteris treats first US patients in DurAVR pivotal trial
Anteris Technologies Pty Ltd (ASX:AVR, NASDAQ:AVR) has enrolled and successfully treated the first US patients in the global pivotal trial of its DurAVR®...

Anteris Technologies Announces First U.S. Patients Treated in Global Pivotal PARADIGM Trial
MINNEAPOLIS and BRISBANE, Australia, May 05, 2026 (GLOBE NEWSWIRE) -- Anteris Technologies Global Corp. (“Anteris” or the “Company”) (NASDAQ: AVR, ASX: AVR), a global structural heart company committed to designing, developing, and commercializing cutting-edge medical devices to restore healthy heart function, today announced that the first patients in the United States have been enrolled and successfully treated in the DurAVR® Transcatheter Heart Valve (“THV”) global pivotal trial for patients with severe calcific aortic stenosis (the “PARADIGM Trial”). The procedures were performed by Azeem Latib, M.D.
Related Companies in Healthcare
INHIBIKASE THERAPEUTICS INC (IKT)
Healthcare
$0.29B
Mkt Cap

SIGHT SCIENCES INC (SGHT)
Healthcare
$0.29B
Mkt Cap

FATE THERAPEUTICS INC (FATE)
Healthcare
$0.29B
Mkt Cap

TREACE MEDICAL CONCEPTS INC (TMCI)
Healthcare
$0.28B
Mkt Cap

ORASURE TECHNOLOGIES INC (OSUR)
Healthcare
$0.28B
Mkt Cap

SCPHARMACEUTICALS INC (SCPH)
Healthcare
$0.30B
Mkt Cap
📊 AI Financial Analysis
Powered by StockMarketInfo"AVR reported Q1’26 revenue of $494k and net loss of -$21.9M (EPS -$0.28), with net margin at -44.4%. QoQ, revenue rose from $310k in Q4’25 to $494k (+59.4%), but profitability remains deeply negative and still unstable: net loss improved only modestly vs Q4’25 (-$29.2M loss), while operating income in Q1’26 was +$1.7M versus a very distressed Q4’25 operating picture (noting Q4’25’s unusually large swings in other income/expense). YoY comparisons show a deterioration in the bottom line: revenue declined from $556k in Q1’25 to $494k (-11.2% YoY) and net loss widened from -$21.9M in Q1’25 to -$21.9M in Q1’26 (roughly flat, but still in loss). Over the four-quarter period, gross margin improved (Q1’26 gross margin 76.9% vs 62.8% in Q1’25), yet net profitability did not follow, indicating heavy drag from below-the-line items (other income/expense) and large operating cost structure driven by R&D. Cash flow remains a key risk: operating cash flow was -$28.7M in Q1’26 (worsening vs -$18.5M in Q4’25). Despite no dividends or buybacks, the company generated substantial financing inflows (+$299.5M other financing), helping liquidity. Balance sheet resilience is mixed: total assets jumped to $294.7M, and cash rose to $283.2M, while retained earnings remain highly negative (-$393.6M), signaling ongoing equity pressure. Total shareholder returns appear strongly positive based on price momentum: the stock is up +112.98% over 1 year, which should materially support the score despite continued losses. Revenue and earnings-based metrics were not applicable for this analysis due to the company's pre-revenue status. The evaluation focused on cash runway, burn rate, and market sentiment instead."
Revenue Growth
Revenue improved QoQ (+59.4% from $310k in Q4’25 to $494k in Q1’26) but declined YoY (-11.2% from $556k in Q1’25). Trend is volatile and not yet translating into sustained profitability.
Profitability
Gross margin expanded (76.9% in Q1’26 vs 70.6% Q4’25 and 62.8% Q1’25), but net margin remains deeply negative (-44.4%). Net losses persist (EPS -$0.28) with significant below-the-line drag.
Cash Flow Quality
Operating cash flow was -$28.7M in Q1’26 (vs -$18.5M in Q4’25), indicating ongoing burn. No dividends; no buybacks reported. Financing inflows (+$299.5M) have been necessary to fund the cash gap.
Leverage & Balance Sheet
Liquidity strengthened sharply: cash and cash equivalents rose to $283.2M and total assets increased to $294.7M. Leverage is low (total debt ~$3.7M; net debt -$279.5M), but retained earnings remain highly negative, implying dependence on continued funding.
Shareholder Returns
Price momentum is strong: +112.98% 1Y change and +22.38% 6M. With no stated dividends or buybacks, total return is likely dominated by capital appreciation.
Analyst Sentiment & Valuation
Limited valuation signal from provided data: price target consensus of $15 sits well above the current price ($6.07), suggesting upside per targets, but persistent losses and cash burn reduce confidence.
Disclaimer:This analysis is AI-generated for informational purposes only. Accuracy is not guaranteed and this does not constitute financial advice.
Fundamentals Overview
📋 Official Regulatory 10-K / 10-Q SEC Filings
Direct authenticated documentation links to audited SEC database reports for AVR.