American States Water Company

American States Water Company (AWR) Market Cap

American States Water Company has a market capitalization of $3.07B.

Price: $78.37

1.35 (1.75%)

Market Cap: 3.07B

NYSE · time unavailable

CEO: Robert J. Sprowls

Sector: Utilities

Industry: Regulated Water

IPO Date: 1973-02-21

Website: https://www.aswater.com

American States Water Company (AWR) - Company Information

Market Cap: 3.07B|Sector: Utilities

Company Profile

American States Water Company, through its subsidiaries, provides water and electric services to residential, commercial, industrial, and other customers in the United States. It operates through three segments: Water, Electric, and Contracted Services. The company purchases, produces, distributes, and sells water, as well as distributes electricity. As of December 31, 2021, American States Water Company provided water service to 262,770 customers located throughout 10 counties in the State of California; and distributed electricity to 24,656 customers in San Bernardino County mountain communities in California. The company also provides water and/or wastewater services, including the operation, maintenance, and construction of facilities at the water and/or wastewater systems at various military installations. American States Water Company was incorporated in 1929 and is based in San Dimas, California.

Analyst Sentiment

25%
Underperform

From 2 Active Polls

1Y Forecast: $89.50

▲ +14.2% Potential Upside

Consensus Target Metrics

Low Bound

$87

Median

$90

High Bound

$92

Average

$90

Price & Moving Averages

Loading chart...

🎯 Wall Street Analyst Intelligence Report

1-Year structural target targets, chart projections, and sentiment maps.

Average 1Y Target
$89.50
▲ +14.20% Upside
Low Target
$87.00
11% Risk
Median Target
$89.50
14% Mid
High Target
$92.00
17% Max
Consensus
Hold
2 / 10 Buys

Consensus Trend Projection

Trailing closures vs. 12-month metrics map.

Analyst Vote Distribution

Aggregate institutional coverage sentiment weights.

📊 Historical Valuation Multiples

Real-time Trailing Twelve Month (TTM) momentum side-by-side with discrete quarterly metrics.

Fiscal QuarterTTMQ1 2026Q4 2025Q3 2025Q2 2025Q1 2025Q4 2024Q3 2024Q2 2024
Period EndingTrailing 12MMar 31, 2026Dec 31, 2025Sep 30, 2025Jun 30, 2025Mar 31, 2025Dec 31, 2024Sep 30, 2024Jun 30, 2024
Market Cap ($M)3,0722,9582,7942,8282,9523,0102,9493,1292,723
Enterprise Value ($M)3,9803,8663,7183,7233,8823,9363,8614,0593,663
Price to Earnings Ratio (P/E)22.9524.6924.3017.1721.9128.0325.9321.8321.37
Price/Earnings-to-Growth Ratio (PEG)8.261.432.158.165.251.44
Price to Sales Ratio (P/S)4.5217.4817.0115.4818.1020.3320.6119.3417.53
Price to Book Ratio (P/B)2.882.782.672.803.043.153.213.563.27
Price to Free Cash Flow Ratio (P/FCF)80.83130.94-77.6674.94216.13-133.74488.83-6545.41-73.51
Enterprise Value to Sales (EV/Sales)22.8522.6320.3823.8126.5926.9825.0923.58
Enterprise Value to EBITDA (EV/EBITDA)15.4760.0779.1847.7557.1166.4572.3757.8755.26
Debt to Equity Ratio3.530.870.900.910.980.991.021.081.13
⚠️

Valuation Model Suspended

API Payload Error: Inverted or negative baseline Free Cash Flow margin detected (-1.7%).

Troubleshooting Notice: The upstream financial data supplier has uploaded corrupted or inverted baseline metrics for AWR. The server sandbox cannot calculate an intrinsic value path from negative cash generation baselines.

📘 Full Research Report

ℹ️

AI-Generated Research: This report is for informational purposes only.

📘 AMERICAN STATES WATER (AWR) — Investment Overview

🧩 Business Model Overview

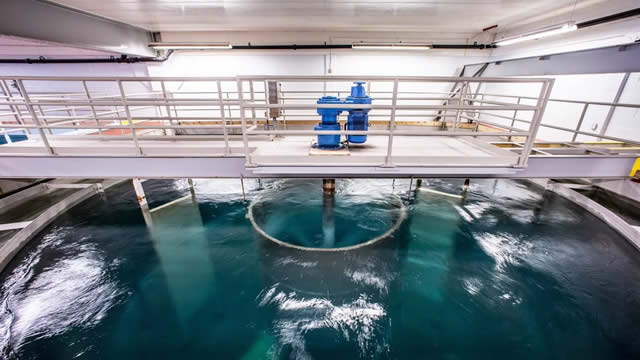
American States Water is a regulated water utility that supplies drinking water and, in certain service areas, wastewater services to residential and commercial customers. The business operates through a geographically constrained utility footprint where physical infrastructure—wells, treatment facilities, pipelines, storage, and distribution systems—creates a natural service boundary. Service is delivered via long-lived assets designed for reliability and compliance, with returns earned through state utility regulation.

The economic “engine” is the regulated rate base model: management invests in and maintains infrastructure, and regulators allow the company to earn a return on those capital assets while recovering operating costs and certain pass-through items. This structure links revenue durability to long-duration capital programs and regulatory approvals rather than to competitive pricing.

💰 Revenue Streams & Monetisation Model

Revenue is primarily driven by regulated water and wastewater service charges. Monetisation is largely recurring because customers require continuous utility service and infrastructure is difficult to substitute. Revenue typically comprises:

  • Volumetric water sales (metered consumption), partially tempered by regulatory mechanisms designed to manage earnings variability from demand fluctuations.
  • Service-related charges (e.g., base charges and related tariff components) that provide a steadier underlying earnings base.
  • Wastewater revenues where applicable, often tied to treatment and collection service needs.
  • Regulatory mechanisms for cost recovery for certain operating costs and capital expenditures, which helps translate approved investments into earnings visibility.

Margin drivers center on (1) the ability to maintain infrastructure reliability, (2) cost control in operations and maintenance, and (3) the effectiveness of regulatory rate-setting in allowing recovery of prudent capital spending. Earnings quality is supported by the regulatory framework’s tendency to spread investment and operating cost recovery over time.

🧠 Competitive Advantages & Market Positioning

AWR’s moat is rooted in infrastructure-based switching costs and geographic monopoly characteristics typical of regulated utilities. Once service territory infrastructure is in place, customer switching is economically and physically impractical, making demand comparatively inelastic. Barriers to entry are high because building parallel water and wastewater systems requires extensive permitting, long construction timelines, and large capital commitments—often constrained by water rights and environmental approvals.

Competitive benchmarking (2–3 key peers):

  • American Water (AWK): a larger, more diversified regulated utility with a broader geographic footprint across multiple states.
  • California Water Service (CWT): another regulated water utility with operations concentrated in certain West Coast and related markets.
  • Essential Utilities (WTRG): more wastewater-leaning relative to pure water exposure, with a different regulatory and asset mix.

Positioning versus peers: AWR focuses on serving regulated territories with the operational discipline and regulatory navigation required to sustain long-lived, capital-intensive infrastructure. Compared with larger peers like AWK, AWR’s valuation and growth profile can be more influenced by the pace of utility rate proceedings, capex execution, and water-resource dynamics in its specific footprint. Compared with wastewater-heavy peers like WTRG, AWR’s core strength remains the regulated delivery of essential water service where franchise-like characteristics and infrastructure density support stable service economics.

  • Moat 1: Switching Costs (hard to replicate infrastructure)
  • Moat 2: Regulatory Moat (approved rate base / cost recovery framework)
  • Moat 3: Cost Advantage from operating experience and system density (where service territories and asset utilization support efficiency)

🚀 Multi-Year Growth Drivers

Growth is driven less by product cycles and more by structural demand and infrastructure renewal. Key drivers include:

  • Population and service-area demand: utility consumption rises with underlying household and commercial activity in service territories, with regulatory structures typically supporting cost recovery tied to approved investments.
  • Infrastructure replacement and modernization: aging pipelines, treatment assets, and distribution networks require sustained capital programs. Regulatory frameworks for prudently incurred capex can translate these investments into an expanding or re-levered rate base.
  • Water supply reliability and drought resilience: as water systems face variability, investment in supply augmentation, storage, and treatment strengthens service continuity and supports regulatory approval for capital spending.
  • Wastewater expansion where applicable: incremental connections and system capacity additions can extend growth beyond water alone in areas served by wastewater systems.
  • Targeted acquisitions / territory expansion (where regulatory and capital conditions permit): buying or consolidating compatible regulated systems can add customers and assets, subject to regulatory approval and integration economics.

Over a 5–10 year horizon, the total addressable market is defined by regulated water and wastewater service needs within constrained service territories and the durability of capital recovery mechanisms that allow utilities to earn on necessary investments.

⚠ Risk Factors to Monitor

  • Regulatory outcomes and timing: earnings depend on rate cases, regulatory approval of operating expense and capex, and the level/timing of allowed returns. Adverse regulatory determinations can pressure earnings power.
  • Capital intensity and execution risk: water infrastructure requires sustained spending; construction delays, cost overruns, and procurement inflation can reduce returns if not fully recoverable.
  • Water supply and drought volatility: shifts in water availability, restrictions, and reliance on specific water sources can create operational and compliance challenges.
  • Environmental compliance and permitting: evolving standards for treatment, discharge, and water quality can require additional capex and operating changes.
  • Operational and cyber-physical risks: the utility’s assets are mission critical; equipment failures, contamination events, or cyber incidents can trigger costly remediation and reputational/regulatory impacts.

📊 Valuation & Market View

The market generally values regulated utilities using frameworks that emphasize stable cash flows and infrastructure-based earnings. Common valuation lenses include EV/EBITDA, P/E, price-to-cash-flow, and dividend/earnings sustainability—with investor attention often focused on the relationship between rate base growth, allowed return, and operating cost control.

Valuation sensitivity typically increases with uncertainty around:

  • Allowed returns and regulatory treatment of investments
  • Leverage and interest costs given capital programs
  • Demand and water-related volume dynamics
  • Capital program efficiency and prudency reviews

🔍 Investment Takeaway

AWR offers a regulated utility investment profile anchored by infrastructure-driven switching costs and regulatory cost-of-service mechanisms that can convert sustained capital spending into relatively durable earnings power. The long-term thesis rests on continued access to approved rate base growth, disciplined execution of water-system modernization, and the ability to navigate water-supply and environmental requirements within its regulated footprint. Key diligence focuses on regulatory outcomes, capex execution, and resilience of water resources and compliance programs.


⚠ AI-generated — informational only. Validate using filings before investing.

📰 Market News & Coverage

15 Stories Available

Real-time institutional reporting and market updates for AWR.

zacks.com2026-06-05

American States Water (AWR) Up 0.2% Since Last Earnings Report: Can It Continue?

American States Water (AWR) reported earnings 30 days ago. What's next for the stock?

zacks.com2026-06-04

What Makes American States Water (AWR) a New Buy Stock

American States Water (AWR) might move higher on growing optimism about its earnings prospects, which is reflected by its upgrade to a Zacks Rank #2 (Buy).

zacks.com2026-06-01

SBS or AWR: Which Is the Better Value Stock Right Now?

Investors interested in Utility - Water Supply stocks are likely familiar with Sabesp (SBS) and American States Water (AWR). But which of these two stocks is more attractive to value investors?

zacks.com2026-06-01

Is American States Water (AWR) Stock Outpacing Its Utilities Peers This Year?

Here is how American States Water (AWR) and Koninklijke KPN NV (KKPNF) have performed compared to their sector so far this year.

thenewswire.com2026-06-01

Aurwest Resources Executes Option Agreement to Acquire Porter Lake Uranium Project in the Athabasca Basin

Calgary, Alberta – TheNewswire - June 1, 2026 – Aurwest Resources Corporation (“Aurwest” or the “Company”) (CSE: AWR) is pleased to announce that it has entered into a Definitive Option Agreement (the “ Option Agreement ”) dated May 29, 2026, with Critical Path Minerals Corp. (the “ Optionee ”), an arm's-length private company, granting Aurwest the option to acquire a 100% interest in the Porter Lake property (“ Property ” or “ Porter Lake ”) which is a 10,490 hectare land package with mineralization, situated within the world's principal uranium district — the Athabasca Basin area of Northern Saskatchewan, Canada. Under the terms of the Option Agreement, the Company will complete two years of exploration programs, provide cash and a series of equity payments to earn its interest in the Property (transaction terms set out below) and this transaction remains subject to approval by the Canadian Securities Exchange. No finder's fees were paid as part of the transaction.   The Porter Lake property is strategically positioned in a known uranium jurisdiction, along trend with the Athabasca Basin's largest discoveries. The Porter Lake property recent work has confirmed known mineralization which is highly prospective for both basement and structurally-hosted type uranium deposits.

zacks.com2026-05-23

Are You Looking for a High-Growth Dividend Stock?

Dividends are one of the best benefits to being a shareholder, but finding a great dividend stock is no easy task. Does American States Water (AWR) have what it takes?

zacks.com2026-05-19

4 Low-Beta Utility Picks as Consumer Sentiment Hits Rock Bottom

ATO, CMS, ED and AWR stand out as defensive utility picks as consumer sentiment weakens amid rising inflation and higher energy costs.

zacks.com2026-05-14

SBS vs. AWR: Which Stock Is the Better Value Option?

Investors interested in Utility - Water Supply stocks are likely familiar with Sabesp (SBS) and American States Water (AWR). But which of these two stocks presents investors with the better value opportunity right now?

zacks.com2026-05-13

Inflation Hits Highest Level in 3 Years: 4 Defensive Stocks to Buy

Inflation reaches a 3-year high as tariffs and energy prices surge, making ATO, CMS, AWR and TSN defensive picks.

zacks.com2026-05-12

4 Stocks to Watch From the Challenging Water Supply Industry

Water utilities like SBS, AWR, AWK and CWT are supported by strategic capital investment plans and strong customer bases, positioning them to outperform peers despite persistent challenges facing the water industry.

marketbeat.com2026-05-09

American States Water Q1 Earnings Call Highlights

American States Water NYSE: AWR reported higher first-quarter earnings as all three of its operating segments posted year-over-year gains, supported by rate increases at its regulated utilities and stronger construction activity in its contracted services business.

seekingalpha.com2026-05-07

American States Water Company (AWR) Q1 2026 Earnings Call Prepared Remarks Transcript

American States Water Company (AWR) Q1 2026 Earnings Call Prepared Remarks Transcript

zacks.com2026-05-07

American States Water Q1 Earnings Miss Estimates, Sales Increase Y/Y

AWR Q1 operating EPS misses estimates by a penny, while total revenues climb 14% to $169.2 million on gains across all segments.

businesswire.com2026-05-06

American States Water Company Announces First Quarter 2026 Results

SAN DIMAS, Calif.--(BUSINESS WIRE)--American States Water Company (NYSE:AWR) today reported basic and fully diluted earnings per share of $0.76 for the quarter ended March 31, 2026, as compared to basic and fully diluted earnings per share of $0.70 for the quarter ended March 31, 2025, an increase of $0.06 per share or 8.6%, primarily generated from higher earnings at the water and electric utility segments resulting from the implementation of new customer rate increases approved by the Califor.

zacks.com2026-05-06

Why American States Water (AWR) is a Great Dividend Stock Right Now

Dividends are one of the best benefits to being a shareholder, but finding a great dividend stock is no easy task. Does American States Water (AWR) have what it takes?

📊 AI Financial Analysis

Powered by StockMarketInfo
Earnings Data: Q Ending 2026-03-31

"AWR reported Q1’26 revenue of $169.2M and net income of $29.9M, with diluted EPS of $0.76. Sequentially, revenue rose from $164.3M in Q4’25 (+2.9% QoQ) and net income edged up from $28.7M (+4.2% QoQ). Year-over-year, revenue increased from $148.0M in Q1’25 (+14.3% YoY) and net income grew from $26.8M (+11.6% YoY), indicating solid demand recovery versus last year. Profitability appears stable-to-improving on the quarter: operating margin was 30.4% in Q1’26 versus 27.4% in Q4’25, but below Q3’25 (33.8%)—suggesting margins normalized after a stronger prior quarter. Net margin was 17.7% in Q1’26 versus 17.5% in Q4’25 and 18.1% in Q1’25, broadly flat over the year. Cash flow quality looks mixed in Q1: net income was $29.9M, but free cash flow was negative at about $(49.1)M due to heavy capex (investments in PP&E). Dividend payments were $19.7M, supporting shareholder returns; buybacks were not reported. Total shareholder returns were modest: the stock is down ~4.4% over the past 1 year (no >20% momentum tailwind). Balance sheet resilience is supported by stable equity at ~$1.06B, though net debt remains high (~$930M)."

Revenue Growth

Good

Q1’26 revenue of $169.2M increased +2.9% QoQ and +14.3% YoY, showing re-acceleration versus last year.

Profitability

Neutral

Operating margin improved to 30.4% vs 27.4% QoQ, but is below the cycle peak seen in Q3’25; net margin is roughly flat YoY (17.7% vs 18.1%).

Cash Flow Quality

Fair

Despite positive net income ($29.9M), Q1’26 free cash flow was about -$49.1M due to large PP&E investment; dividends were paid ($19.7M) with no buybacks reported.

Leverage & Balance Sheet

Neutral

Equity was stable around $1.06B, but leverage remains elevated with net debt about $931M; asset base shrank versus prior quarter (Q4’25 total assets ~$2.72B to Q1’26 ~$2.36B per provided data).

Shareholder Returns

Fair

Dividend yield is low (~0.7%) and the stock is down ~4.4% over 1Y, so total returns lack a strong momentum component; no buybacks in Q1.

Analyst Sentiment & Valuation

Good

Street target consensus is ~$89.5 vs current price $75.92 (implied upside ~18%); valuation metrics appear rich (e.g., P/E ~24.7), but sentiment/target suggests support.

Disclaimer:This analysis is AI-generated for informational purposes only. Accuracy is not guaranteed and this does not constitute financial advice.

Fundamentals Overview

Loading fundamentals overview...

AWR delivered stronger Q1 2026 earnings, with consolidated EPS of $0.76 (+8.6% vs $0.70) driven by higher regulated revenues from 2026 water and electric rate actions and improved contracted-services execution at ASUS. Management highlighted step-rate benefits, including Golden State Water’s 2026 adopted revenues (about $32M higher adopted operating revenues less water supply cost vs 2025) and Bear Valley Electric’s end-of-cycle 2026 increases. Revenue rose $21.2M YoY, while supply costs increased but were largely rate-pass-through, limiting net earnings impact. The main operating pressure cited was higher ASUS-related expenses and timing, plus interest expense timing differences from 2025 advice-letter debt capitalization with no comparable 2026 items. Looking ahead, the company reaffirmed full-year capex $185M–$225M, ASUS $0.63–$0.67 guidance, and a water rate case expected by July 1 for 2028–2030. Key risk remains Golden State Water’s MRAM/supply-mix volatility under the new CPUC framework.

AI IconGrowth Catalysts

  • Step-rate increases in water and electric utilities benefitting Q1 results
  • New 2026 water rates at Golden State Water, including revenues tied to an advice letter project approved in 2025
  • Bear Valley Electric 2026 base rate increases and fourth-year rate increases in the 2023-2026 cycle
  • ASUS (contracted services) earnings lift from higher construction activity and lower interest expense from reduced borrowings

Business Development

  • CPUC approval of Golden State Water advice letter capital projects and their integration into 2026 adopted rate base (memorandum account mechanics tied to settlement with Public Advocates Office)
  • Planned regulatory filing cadence: Bear Valley Electric electric general rate case filed in January for 2027-2030; water general rate case expected to be filed by July 1 for 2028-2030
  • ASUS ongoing positioning/ability to compete for future military base contract awards (no specific new award named in transcript)

AI IconFinancial Highlights

  • Reported consolidated EPS $0.76 vs $0.70 prior year (+8.6%)
  • Water utility EPS $0.55 vs $0.52 (+$0.03) driven by new 2026 water rates/advice-letter revenues, partially offset by higher water supply costs, operating expenses, net interest expense, other expense/net, and taxes
  • Electric segment EPS $0.08 vs $0.07 (+$0.01) mainly from rate increases, partially offset by higher operating and interest expenses
  • ASUS EPS $0.15 vs $0.13 (+$0.02) driven by higher construction activity and lower interest expense; partially offset by higher operating expenses
  • Revenue up $21.2M YoY: water +$11.1M (new 2026 rates); electric +$3.7M (fourth-year rate increases + approved advice-letter revenues); ASUS +$6.4M (construction timing)
  • Supply costs +$5.1M largely from higher purchased water per-unit cost (included in 2026 water rates with no net earnings impact) and higher purchased water volume
  • Operating expenses ex-supply costs +$10.2M due to higher ASUS construction expenses and timing; interest expense net of interest income increased due to capitalization of debt costs related to certain advice letter projects (recorded in 2025 with no similar items in 2026) and reduced interest income from lower regulatory balances
  • ATM program: raised net proceeds $6.2M in Q1, leaving $34.3M remaining; management indicates they do not expect to continue the ATM after remaining balance is fully utilized

AI IconCapital Funding

  • Operating cash flow: $71.6M in Q1 2026 vs $45.1M in Q1 2025
  • Investing: regulated utility invested $42.1M in company-funded capital projects in Q1
  • Full-year 2026 company-funded capex projection: $185M to $225M
  • At-the-market issuance: $6.2M net proceeds raised in quarter; $34.3M remaining available; plan to stop after fully utilized

AI IconStrategy & Ops

  • Regulatory strategy: Golden State Water transitioning to Monterey-style water revenue adjustment mechanism (MRAM) and incremental supply cost balancing account effective 01/01/2025, increasing earnings volatility tied to water consumption and supply mix
  • Ratemaking timing: advice letter projects accrue in memorandum account interest during construction then are added to adopted rate base for step increases
  • Capital planning: Golden State Water water general rate case expected to be filed by July 1 covering 2028-2030; Bear Valley Electric new electric general rate case already filed for 2027-2030
  • ASUS execution: higher construction activity drove revenue and EPS; lower average interest rates and borrowing levels reduced interest expense

AI IconMarket Outlook

  • ASUS projected to contribute $0.63 to $0.67 per share for full-year 2026
  • Regulated utilities projected to invest combined $185M to $225M in 2026 infrastructure
  • Water general rate case expected to be filed by July 1 (for 2028-2030)
  • CPUC cost of capital application deferred: postponed filing date to 05/01/2027 with effective date 01/01/2028 (per transcript statement)

AI IconRisks & Headwinds

  • Golden State Water earnings volatility risk from MRAM/incremental supply cost balancing tied to fluctuations in customer water consumption and changes in water supply source mix; additional well outages temporarily increased purchased water in Q1
  • Potential unfavorable supply mix impacts versus adopted revenue requirement mix
  • Interest expense and cash flow timing effects from regulatory balance movements and advice letter capitalization/AFUDC mechanics (specific interest timing differences noted between 2025 and 2026)
  • Dilution risk from shares issued under the parent’s ATM program (noted as a $0.01 EPS drag in water segment)

Q&A: Analyst Interest

  • Topic: No Q&A occurred. Operator stated there were no questions and ended the session; management provided no additional clarifications beyond prepared remarks and closing statements.
  • Topic: No Q&A occurred. The call proceeded directly from operator instructions and prepared remarks to a conclusion without analyst follow-ups, leaving no incremental detail on guidance, assumptions, or variance drivers beyond the scripted presentation.
  • Topic: No Q&A occurred. With no analyst prompts, there were no management responses on margins, capex timing, regulatory probability, supply-cost mechanics, or financing plans beyond items already disclosed in remarks and the slides.

Sentiment: POSITIVE

Note: This summary was synthesized by AI from the AWR Q1 2026 earnings transcript. Financial data is complex; please verify all metrics against official SEC filings before making investment decisions.

📋 Official Regulatory 10-K / 10-Q SEC Filings

Direct authenticated documentation links to audited SEC database reports for AWR.

SEC EDGAR Live Feed
Loading financial data and tables...
📁

SEC Filings (AWR)

© 2026 Stock Market Info — American States Water Company (AWR) Financial Profile