Boston Scientific Corporation

Boston Scientific Corporation (BSX) Market Cap

Boston Scientific Corporation has a market capitalization of β€”.

No quote data available.

CEO: Michael F. Mahoney

Sector: Healthcare

Industry: Medical - Devices

IPO Date: 1992-05-19

Website: https://www.bostonscientific.com

Boston Scientific Corporation (BSX) - Company Information

Market Cap: -|Sector: Healthcare

Company Profile

Boston Scientific Corporation develops, manufactures, and markets medical devices for use in various interventional medical specialties worldwide. It operates through three segments: MedSurg, Rhythm and Neuro, and Cardiovascular. The company offers devices to diagnose and treat gastrointestinal and pulmonary conditions; devices to treat various urological and pelvic conditions; implantable cardioverter and implantable cardiac resynchronization therapy defibrillators; pacemakers and implantable cardiac resynchronization therapy pacemakers; and remote patient management systems. It also provides medical technologies to diagnose and treat rate and rhythm disorders of the heart comprising 3-D cardiac mapping and navigation solutions, ablation catheters, diagnostic catheters, mapping catheters, intracardiac ultrasound catheters, delivery sheaths, and other accessories; spinal cord stimulator systems for the management of chronic pain; indirect decompression systems; and deep brain stimulation systems. In addition, the company offers interventional cardiology products, including drug-eluting coronary stent systems used in the treatment of coronary artery disease; percutaneous coronary interventions products to treat atherosclerosis; intravascular catheter-directed ultrasound imaging catheters, fractional flow reserve devices, and systems for use in coronary arteries and heart chambers, as well as various peripheral vessels; and structural heart therapies. Further, it provides stents, balloon catheters, wires, and atherectomy systems to treat arterial diseases; thrombectomy and acoustic pulse thrombolysis systems, wires, and stents to treat venous diseases; and peripheral embolization devices, radioactive microspheres, ablation systems, cryotherapy ablation systems, and micro and drainage catheters to treat cancer. The company was incorporated in 1979 and is headquartered in Marlborough, Massachusetts.

Analyst Sentiment

83%
Strong Buy

From 31 Active Polls

1Y Forecast: $83.84

β–² +0.0% Potential Upside

Consensus Target Metrics

Low Bound

$55

Median

$77

High Bound

$120

Average

$84

Price & Moving Averages

Loading chart...

🎯 Wall Street Analyst Intelligence Report

1-Year structural target targets, chart projections, and sentiment maps.

Average 1Y Target
$83.84
β–² +72.69% Upside
Low Target
$55.00
13% Risk
Median Target
$77.00
59% Mid
High Target
$120.00
147% Max

Consensus Trend Projection

Trailing closures vs. 12-month metrics map.

Analyst Vote Distribution

Aggregate institutional coverage sentiment weights.

Sentiment volume allocation data unavailable.

Historical valuation matrix unavailable.

πŸ“˜ Full Research Report

ℹ️

AI-Generated Research: This report is for informational purposes only.

πŸ“˜ BOSTON SCIENTIFIC CORP (BSX) β€” Investment Overview

🧩 Business Model Overview

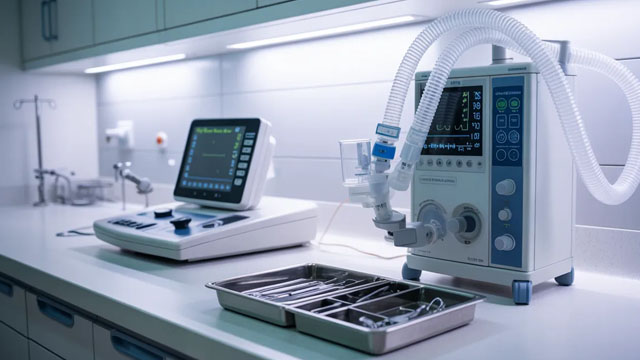
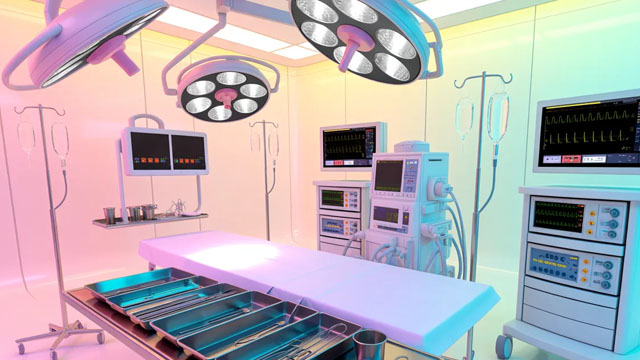
Boston Scientific is a global medical technology manufacturer selling implantable and therapeutic devices used in hospitals and outpatient settings. The company participates in a multi-step value chain that translates clinical differentiation into commercial pull-through:

  • R&D and platform development to create differentiated device technologies (often requiring extensive clinical evidence).
  • Regulatory clearance/approval to commercialize new products in high-stakes indications.
  • Hospital and clinician adoption supported by procedure training, clinical data packages, and workflow integration.
  • Installed-base monetization through follow-on consumables, replacements, and adjacent upgrades tied to existing therapies.

This model tends to generate stronger durability when products become β€œembedded” in hospital procedural pathways and when subsequent procedures rely on established device platforms and protocols.

πŸ’° Revenue Streams & Monetisation Model

BSX monetizes primarily through device sales per procedure, complemented by installed-base economics where long-lived therapies create ongoing demand for follow-on products. Key monetisation characteristics include:

  • Consumables and replacements: Follow-on catheters, electrodes, leads, and other procedure-specific components often carry higher margin than β€œbase” equipment.
  • Platform-driven revenue mix: Platform differentiation supports better pricing and a favorable product-mix trajectory as therapies expand into new patient subgroups.
  • Geographically distributed commercial engine: Sales are supported by direct sales coverage, distributor relationships, and reimbursement familiarity in each market.

Overall margins are driven by product differentiation, mix shift toward higher-value platforms and consumables, and the ability to sustain throughput in procedure volumes.

🧠 Competitive Advantages & Market Positioning

BSX competes across multiple healthcare procedure categories, with moats typically arising from regulatory barriers, switching costs, and clinical and workflow integration. The most durable advantages often concentrate where hospitals and physicians develop routine usage patterns around a therapy platform.

Primary competitors: Medtronic, Abbott, and Olympus (endoscopy).

  • Medtronic (broad cardiology/neuromodulation/end-to-end portfolio): Medtronic competes aggressively across cardiovascular and electrophysiology. BSX’s positioning emphasizes differentiated interventional and rhythm-management technologies plus a strong embedded installed base in targeted therapies.
  • Abbott (cardiovascular and diagnostic-adjacent strengths): Abbott competes through complementary portfolios and strong imaging/diagnostic synergies. BSX’s strategy leans on therapy-focused platforms and procedural adoption where clinical evidence and device performance influence purchasing decisions.
  • Olympus (GI endoscopy and visualization ecosystem): In endoscopy, Olympus competes on visualization hardware and integrated scopes. BSX competes through GI-focused therapeutic offerings and catheter-based/ancillary solutions that align with hospital procedure needs.

Moat durability mechanisms:

  • Regulatory and evidence barriers (Hard to replicate): New device classes require FDA processes and substantial clinical validation, elevating the cost and time to compete.
  • Switching costs (Operational and clinical): Hospitals standardize protocols, inventory, and training around proven systems; physicians build procedural routines, and facilities seek continuity for outcomes and workflow efficiency.
  • Intangible assets (Clinical credibility + training ecosystem): Sustained clinical data, procedure know-how, and field training strengthen adoption curves and slow competitor displacement.

πŸš€ Multi-Year Growth Drivers

Over a 5–10 year horizon, growth potential is supported by several structural trends that expand procedural demand and improve product mix:

  • Minimally invasive treatment adoption: Continued shift from more invasive procedures toward catheter-based and device-driven therapies supports durable procedure volumes.
  • Aging demographics and chronic disease prevalence: Higher incidence of cardiovascular rhythm disorders, structural heart needs, and urologic conditions increases addressable patient populations.
  • Electrophysiology and arrhythmia management: Demand expansion tied to diagnosis and treatment of atrial and ventricular arrhythmias supports device platform penetration.
  • Therapy platform expansion: Success in specific indications can broaden use into additional subtypes and patient segments, lifting total lifetime value of an installed base.
  • Workflow and ecosystem integration: Reimbursement, hospital pathway standardization, and compatibility within procedural suites support platform durability and consumables draw.

The TAM outlook depends less on macroeconomic cycles and more on procedure rates, adoption of technology within institutions, and the ability to sustain differentiation through product cycles and clinical evidence.

⚠ Risk Factors to Monitor

  • Regulatory and clinical risk: Delays in approvals, post-market surveillance outcomes, and potential label changes can affect commercial momentum.
  • Product quality and recalls: Device defects or manufacturing issues can trigger financial losses, remediation costs, and reputational harm.
  • Technological displacement: Competitive innovation may reduce differentiation, particularly in rapidly evolving interventional and visualization categories.
  • Reimbursement pressure: Changes in reimbursement policies can impact adoption rates, hospital purchasing behavior, and net realized pricing.
  • Competitive contracting dynamics: IDNs and purchasing groups may drive price concessions through multi-year tenders, limiting margin expansion.
  • Capital intensity in R&D and manufacturing: Device development and manufacturing scale requirements can compress returns if execution falters.

πŸ“Š Valuation & Market View

The medtech sector is typically valued using a blend of EV/EBITDA and P/S, with investors placing substantial weight on:

  • Quality of growth: mix shift toward higher-value platforms and consumables, plus sustained category share.
  • Margin trajectory: manufacturing efficiency, product mix, and operating leverage from scale.
  • Visibility and durability: extent of installed-base monetization and evidence-based adoption.
  • Product cycle risk: success or setbacks in launches and competitive displacement across procedure categories.

Key valuation drivers generally include confidence in pipeline conversion, stability in gross margins, and sustained procedural demand.

πŸ” Investment Takeaway

Boston Scientific’s long-term investment case rests on durable switching costs created by hospital and clinician procedural standardization, reinforced by regulatory and evidence barriers that raise the bar for competitors. When BSX sustains differentiated therapy platforms and monetizes an installed base through follow-on consumables and upgrades, the business can translate clinical leadership into resilient share and margin outcomes across multiple procedure categories.


⚠ AI-generated β€” informational only. Validate using filings before investing.

πŸ“Š AI Financial Analysis

Powered by StockMarketInfo
Earnings Data: Q Ending 2026-03-31

"BSX Q1’26 reported Revenue of $5.20B and Net Income of $1.34B (EPS: $0.90). Sequentially, revenue was roughly flat (+(5.20-5.29)/5.29 β‰ˆ -1.6% QoQ) but net income rebounded sharply from $0.67B in Q4’25 (+100% QoQ). Year-over-year, revenue rose about +11.5% ($5.20B vs. $4.66B in Q1’25) while net income nearly doubled (+98.6% to $1.34B). Profitability improved across the quarter set: gross margin increased to 69.4% vs. 63.3% a year ago, and net profit margin expanded to 25.7% from 14.5% in Q1’25. Operating income increased to $1.07B, reflecting operating margin of 20.6% versus ~19.2% in Q1’25β€”signaling margin expansion driven by stronger gross profitability and better cost conversion. Cash flow quality was mixed but directionally supportive for Q1’26: operating cash flow was $348M and free cash flow was $171M, both below Q4’25 levels due largely to working-capital drag (change in working capital of -$915M). Balance sheet resilience remains solid: total assets were $44.4B with equity of $26.1B, while leverage appears manageable (long-term debt ~$11.0B). Shareholder returns remain constrained by price momentum: market price is $64.23 with a -32.6% 1-year change. With dividend/buyback data not indicated in provided cash flow (dividends paid $0; repurchases $0), total shareholder return is primarily negative from capital depreciation. Analyst valuation context shows a wide target range (low $60 to high $120; consensus $91.33), suggesting meaningful upside versus current price if earnings normalize and cash conversion improves."

Revenue Growth

Positive

Revenue grew ~+11.5% YoY in Q1’26 ($5.20B vs. $4.66B) but was slightly down ~-1.6% QoQ vs. Q4’25 ($5.29B). Trend since Q2–Q3’25 shows steadier mid-single/low-double-digit run-rate.

Profitability

Good

Margins expanded materially: gross margin rose to 69.4% vs. 63.3% YoY; net margin expanded to 25.7% from 14.5%. Net income nearly doubled YoY (+98.6%) and surged +100% QoQ, indicating improved earnings power in the latest quarter.

Cash Flow Quality

Caution

Q1’26 operating cash flow was $348M and free cash flow $171M, down sharply vs. Q4’25. Working capital was a major headwind (-$915M change), implying cash conversion pressure despite strong accounting earnings.

Leverage & Balance Sheet

Neutral

Balance sheet strength remains: total assets ~$44.4B and equity ~$26.1B in Q1’26. Leverage is manageable with long-term debt around $11.0B; equity levels have grown over the last year, supporting resilience.

Shareholder Returns

Neutral

Price momentum is negative: -32.6% over the past 1 year. No dividends or buybacks are reflected in the provided cash flow (dividends paid and repurchases are $0), so total return appears dominated by capital depreciation.

Analyst Sentiment & Valuation

Neutral

Consensus price target ($91.33) is above the current price ($64.23), with a wide range ($60–$120). This suggests analysts see upside, though recent underperformance and cash conversion variability temper confidence.

Disclaimer:This analysis is AI-generated for informational purposes only. Accuracy is not guaranteed and this does not constitute financial advice.

Fundamentals Overview

Loading fundamentals overview...

BSX delivered a strong Q1 on top-line momentum and profitability: organic sales +9.4% and adjusted EPS $0.80 (+6%) at the high end of guidance. However, management reset 2026 outlook more cautiously, cutting full-year organic growth to 6.5%–8% and narrowing EPS to $3.34–$3.41 (+9%–11%), explicitly blaming unanticipated headwinds concentrated in EP, WATCHMAN, and Urology. The key economic stressors are gross margin compression (-100 bps YoY to 70.5%) from tariffs and POLARx discontinuation charges, plus mix headwinds and additional supply-chain/quality spend. WATCHMAN remains supported by CHAMPION and market development, but stand-alone volume in the U.S. is soft due to evolving concomitant practice patterns and reimbursement/workflow effects. EP faces increased competitive share pressure, despite reaffirmed PFA leadership efforts via OPAL mapping and FARAPOINT. Net: solid execution in Q1, but mid-year phasing and competitive dynamics drive the cautious posture.

AI IconGrowth Catalysts

  • FARAPULSE momentum in Neuromod (Q1 organic growth +15%) and continued progress in China/EP catheter utilization
  • WATCHMAN +19% organic in Q1, supported by concomitant growth and CHAMPION trial evidence (label update and guideline workstream)
  • EP growth +22% organic (U.S. +18%, international +30%), led by OPAL mapping footprint expansion and FARAPOINT ramp; PFA catheter/category strength
  • Interventional Oncology +15% organic growth, including FDA clearance for any-day dosing via TheraSphere 360 management platform
  • Urology StoneSmart expected value unlock after FDA approval for insurers; plans for additional 2026 launches tied to StoneSmart ecosystem

Business Development

  • Penumbra acquisition: expected close in 2H 2026 subject to Penumbra shareholder vote on May 6 and remaining regulatory clearances (not included in Q1/Q2 guidance)
  • Closed acquisition of Valencia Technologies (April), complements Urology
  • Closure of Valencia Technologies referenced as enabling Ecoin Tibial Nerve stem commercialization within Pelvic Health

AI IconFinancial Highlights

  • Total company organic sales +9.4% vs guidance range 8.5%–10% (mid/high-end performance in Q1)
  • Adjusted EPS $0.80 (+6%) at the high end of $0.78–$0.80 guidance
  • Revenue: reported +11.6% with ~220 bps foreign-exchange tailwind; excluding FX, operational and organic growth were both ~9.4%
  • Adjusted gross margin 70.5% = -100 bps YoY, primarily driven by tariffs and POLARx Cryoablation discontinuation-related inventory charges
  • Full-year gross margin expected slightly below 2025 due to mix headwinds and incremental global supply chain/quality investments
  • Adjusted operating margin: Q1 28.8% (management cited 28% in opening remarks); full-year operating margin expansion targeted +50 to +75 bps
  • Adjusted tax rate Q1: 11.7% (in-line), includes stock-compensation accounting benefit; full-year adjusted tax rate now ~12.0%
  • Free cash flow Q1: $170M (operating activities $348M less net capex $177M); full-year FCF expected ~ $4.0B

AI IconCapital Funding

  • Share repurchase authorization: board approved additional $4B under existing program, total authorization $5B
  • Intended repurchase: ~ $2B during Q2 2026, subject to market conditions and applicable securities laws
  • Cash on hand (Mar 31, 2026): $1.453B
  • Gross debt leverage ratio: 1.8x
  • Capital allocation priority: strategic tuck-in M&A first, then share repurchase

AI IconStrategy & Ops

  • Discontinued ACURATE and POLARx (POLARx Cryo) accelerated timing due to safety events and availability of nonthermal ablation technologies; annualization expected to drive EMEA/EP impacts (e.g., POLARx discontinuation impact on EP outlook ~ $35M in 2026)
  • Endoscopy: AXIOS ramp improving better-than-anticipated Q1 results; management expects continued Q2 impact and other transient supply-chain disruptions, with improvement in 2H 2026
  • Neuromod: Urology commercial model disruption in sacral neuromodulation; hiring/training of new sales and clinical reps; Ecoin Tibial Nerve stem enabled by Valencia closure
  • WATCHMAN: increased commercial investment and territory rep refocus (augment reps to add dedicated WATCHMAN focus vs shared EP/WATCHMAN coverage)
  • EP: maintain PFA leadership via continued OPAL mapping platform installations, adding catheters, and FARAPOINT ramp; push next-gen platform roadmap (FARAWAVE Ultra planned for 1H 2027)

AI IconMarket Outlook

  • Q2 2026: organic/operational growth expected 5.0%–7.0% (reported revenue growth 5.5%–7.5%, excluding ~50 bps FX tailwind)
  • Full-year 2026: organic/operational growth guidance reduced to 6.5%–8.0% (from prior) reflecting unanticipated headwinds
  • Full-year 2026 adjusted EPS guidance: $3.34–$3.41 (+9% to +11%); Q2 adjusted EPS $0.82–$0.84
  • Full-year adjusted operating margin expansion: +50 to +75 bps
  • Full-year adjusted tax rate: ~12.0%
  • WATCHMAN: full-year global growth now mid-teens; U.S. low-to-mid-teens (deceleration expected vs prior expectation)
  • EP: now expects global EP business growth ~10% in 2026; U.S. mid-single-digit range (international ~plus 20%)
  • Urology: full-year uro growth now low to mid-single digits in 2026

AI IconRisks & Headwinds

  • Tariffs and POLARx discontinuation inventory charges pressured adjusted gross margin (-100 bps YoY) and expected 2026 gross margin below 2025
  • WATCHMAN: stand-alone implant volume pressure in the U.S. due to evolving practice patterns (greater concomitant vs stand-alone), hospital workflow constraints, and reimbursement dynamics
  • EP: increased competition (Medtronic, J&J, Abbott) driving greater-than-previously-anticipated share erosion; management now guides ~10% global growth rather than growth at market
  • Urology: stone management and single neuromodulation underperformed in Q1; driven by China VBP and core Stone product gaps; below-market year expected
  • Transient supply-chain disruptions affecting endoscopy (including AXIOS) in Q2
  • VBP impacts in China expected to annualize in Q2 (noted for arterial business impact in Vascular Therapies)

Q&A: Analyst Interest

  • Guidance reset drivers: Management tied the take-down primarily to EP, WATCHMAN, and Urologyβ€”WATCHMAN volume declining after early-to-mid-February, EP projecting more share erosion, and Urology pressured by core Stone and sacral neuromodulation dynamics, despite stable overall Q1 results.
  • EP market/share assumptions: Analysts asked whether U.S. EP stays flat and what drives share pressure. Management guided global EP roughly ~10% (U.S. mid-single-digit, implying flat 2Q–4Q; international ~20%) and cited tougher competition from Medtronic, J&J, and Abbott plus higher-than-expected share erosion.
  • WATCHMAN narrative and growth levers: Analysts sought clarity on practice-pattern shifts despite CHAMPION success. Management emphasized concomitant demand strength but noted stand-alone WATCHMAN softness from shifting procedure mix toward EP, reimbursement impacts, and workflow adjustments; response included increased WATCHMAN-specific commercial investment and marketing emphasizing CHAMPION evidence.

Sentiment: CAUTIOUS

Note: This summary was synthesized by AI from the BSX Q1 2026 earnings transcript. Financial data is complex; please verify all metrics against official SEC filings before making investment decisions.

Loading financial data and tables...
Β© 2026 Stock Market Info β€” Boston Scientific Corporation (BSX) Financial Profile