COPT Defense Properties

COPT Defense Properties (CDP) Market Cap

COPT Defense Properties has a market capitalization of $3.70B.

Price: $32.65

0.56 (1.75%)

Market Cap: 3.70B

NYSE · time unavailable

CEO: Stephen E. Budorick

Sector: Real Estate

Industry: REIT - Office

IPO Date: 1991-12-31

Website: https://www.copt.com

COPT Defense Properties (CDP) - Company Information

Market Cap: 3.70B|Sector: Real Estate

Company Profile

COPT is a REIT that owns, manages, leases, develops and selectively acquires office and data center properties. The majority of its portfolio is in locations that support the United States Government and its contractors, most of whom are engaged in national security, defense and information technology (IT) related activities servicing what the Company believes are growing, durable, priority missions (Defense/IT Locations). The Company also owns a portfolio of office properties located in select urban submarkets in the Greater Washington, DC/Baltimore region with durable Class-A office fundamentals and characteristics (Regional Office Properties). As of June 30, 2023, the Company derived 90% of its core portfolio annualized rental revenue from Defense/IT Locations and 10% from its Regional Office Properties. As of the same date and including 24 properties owned through unconsolidated joint ventures, COPT's core portfolio of 192 properties encompassed 22.9 million square feet and was 95% leased.

Analyst Sentiment

71%
Buy

From 8 Active Polls

1Y Forecast: $36.00

▲ +10.3% Potential Upside

Consensus Target Metrics

Low Bound

$33

Median

$37

High Bound

$38

Average

$36

Price & Moving Averages

Loading chart...

🎯 Wall Street Analyst Intelligence Report

1-Year structural target targets, chart projections, and sentiment maps.

Average 1Y Target
$36.00
▲ +10.26% Upside
Low Target
$33.00
1% Risk
Median Target
$37.00
13% Mid
High Target
$38.00
16% Max
Consensus
Buy
13 / 21 Buys

Consensus Trend Projection

Trailing closures vs. 12-month metrics map.

Analyst Vote Distribution

Aggregate institutional coverage sentiment weights.

📊 Historical Valuation Multiples

Real-time Trailing Twelve Month (TTM) momentum side-by-side with discrete quarterly metrics.

Fiscal QuarterTTMQ1 2026Q4 2025Q3 2025Q2 2025Q1 2025Q4 2024Q3 2024Q2 2024
Period EndingTrailing 12MMar 31, 2026Dec 31, 2025Sep 30, 2025Jun 30, 2025Mar 31, 2025Dec 31, 2024Sep 30, 2024Jun 30, 2024
Market Cap ($M)3,7023,4503,1343,2693,1013,0653,4773,4052,813
Enterprise Value ($M)6,2646,0125,6725,7365,5655,5015,8805,7955,136
Price to Earnings Ratio (P/E)23.5722.3720.8919.5820.2122.0524.7523.5920.03
Price/Earnings-to-Growth Ratio (PEG)13.464.6118.449.1523.49
Price to Sales Ratio (P/S)4.7717.1915.8817.3116.3316.3118.9618.0015.01
Price to Book Ratio (P/B)2.432.282.072.172.072.062.332.291.89
Price to Free Cash Flow Ratio (P/FCF)12.6544.5251.4046.9236.6847.0537.6772.7441.06
Enterprise Value to Sales (EV/Sales)29.9628.7430.3829.3029.2832.0530.6327.42
Enterprise Value to EBITDA (EV/EBITDA)15.1759.5253.3253.9856.0958.5562.6162.4555.30
Debt to Equity Ratio6.211.711.861.651.661.651.631.631.63

CDP Growth Runway Model

Standard long term linear growth fade

Multi-Stage Discounted Cash Flow Sandbox

Market Price$32.65
Intrinsic Value$34.32
Market Alignment
Undervalued by 5.1%relative to calculated intrinsic value
9.00%
Exp: 0%0%
i

Growth runway slowdown

This value provides a time window for the growth rate to decline beyond Stage 1 toward the terminal rate. Longer windows are most useful for companies with high growth starting conditions or strong competitive advantages. This option stretches out the growth rate slowdown across 5, 10, or 15-year steps. A high-growth starting condition (exceeding a 25% initial growth rate) automatically applies a curve decay to simulate realistic, rapid market saturation.
i

Terminal growth rate

With long-term inflation between 3-5%, revenue must grow by that baseline to maintain flat real-world market share. This value sets the permanent terminal growth rate to factor into the valuation beyond the growth slowdown runway toward maturity.

3-Stage Financial Runway Horizon

🧠 Perpetuity Horizon Engine (Stage 3: Post-2035)

Terminal FCF Base$0.45B
Perpetuity TV Value$8.46B
Discounted TV (PV)$3.57B
TV Weighting %57.6%
⚠️
Financial Model Disclaimer & Risk Disclosure: This interactive scenario simulator is an educational sandbox provided strictly for informational and analytical research purposes. Core historical financial statements and consensus estimates are sourced directly via Financial Modeling Prep (FMP). All downstream outputs are entirely deterministic, hypothetical projections generated by combining automated mathematical formulas (including linear interpolation and Gaussian bell-curve decay models) with user-selected variables and third-party financial data inputs. Users assume all liability for trading decisions executed based on these sandbox calculations.

📘 Full Research Report

ℹ️

AI-Generated Research: This report is for informational purposes only.

📘 COPT DEFENSE PROPERTIES (CDP) — Investment Overview

🧩 Business Model Overview

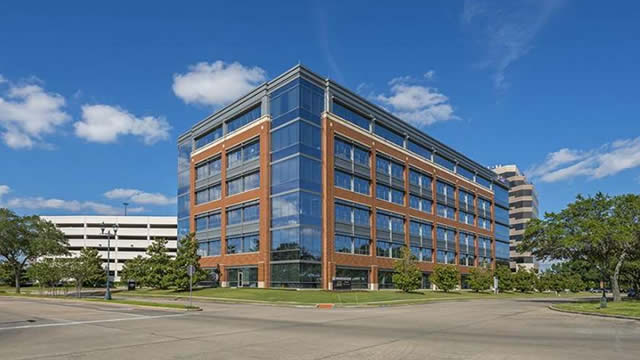
COPT DEFENSE PROPERTIES is a specialized real estate owner focused on facilities used by U.S. defense and federal government ecosystems—primarily in the Mid-Atlantic “DMV” corridor and other mission-critical locations where government-related contractors cluster. The business model is to acquire or develop buildings that fit security, operational, and infrastructure requirements, then lease them on long-dated terms to tenants engaged in defense, engineering, and government-adjacent work.

The value chain is straightforward: site selection and land banking in constrained submarkets → development or redevelopment of purpose-fit industrial and office facilities → leasing on an economic structure that typically passes through operating expenses (often on a triple-net basis) → ongoing property optimization to support durable occupancy and rental growth. Tenant stickiness is reinforced by facility specificity and the practical difficulty of relocating employees, equipment, and workflows tied to government-adjacent programs.

💰 Revenue Streams & Monetisation Model

CDP monetizes real estate through recurring rent streams generated by operating leases. The monetisation profile is typically characterized by:

  • Base rent under lease agreements, often with contractual rent steps/escalators.
  • Tenant reimbursements / pass-throughs for property operating costs in structures that commonly resemble triple-net economics.
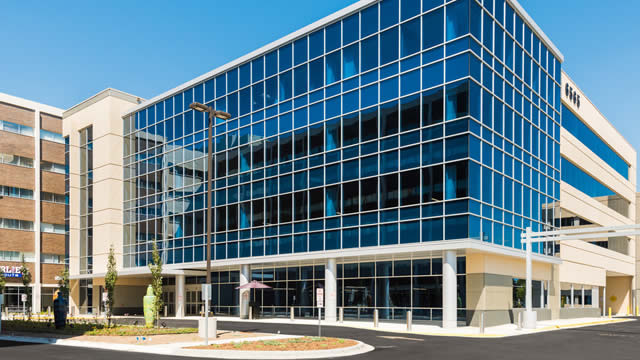
  • Development and redevelopment-driven rent growth from new supply positioned for defense-related operational needs, with stabilization followed by contractual rent maturity.

Margin drivers in this model flow from (1) sustained occupancy and lease execution, (2) rent growth supported by supply scarcity in key submarkets, and (3) operating cost recoverability. Because the revenue base is lease-backed, the primary levers tend to be property-level fundamentals (leasing spreads, renewals, and occupancy) rather than transaction-driven gains.

🧠 Competitive Advantages & Market Positioning

CDP’s moat is best described as a combination of geographic cost advantage, tenant switching frictions, and constrained supply.

  • Geographic moat / proximity advantage: Defense and federal ecosystems rely on close access to government agencies, prime contractors, and supporting infrastructure. CDP’s portfolio emphasizes submarkets where that clustering is hard to replicate.
  • Switching costs: Relocating defense-related operations can involve security constraints, workforce disruption, specialized build-out needs, and program continuity risks—making tenant churn structurally lower than in typical industrial leasing.
  • Operational fit and redevelopment capability: CDP’s ability to design, build, and modernize facilities for mission use supports renewals and reduces the likelihood that older stock becomes obsolete relative to tenant requirements.

COMPETITIVE BENCHMARKING (primary peers)

  • Prologis (industrial/logistics focus): Prologis competes for industrial space demand broadly, including defense-adjacent users, but operates at a larger, more diversified logistics scale rather than specializing in government-cluster submarkets.
  • Rexford Industrial (industrial infill focus): Rexford competes for infill industrial demand and often benefits from demographic and employment growth, yet it is not positioned around defense-specific facility requirements and proximity dynamics.
  • SEGRO (industrial/warehouse parks): SEGRO competes on location and warehousing/parks economics, but CDP’s defense concentration and mission-fit redevelopment emphasis differentiates its customer set and leasing durability.

Against these rivals, CDP’s differentiation is the purpose-fit, government-cluster specialization—an orientation that supports longer tenant tenure and more predictable demand sensitivity tied to defense and federal program execution.

🚀 Multi-Year Growth Drivers

Over a 5–10 year horizon, CDP’s growth potential is anchored in structural demand for defense and mission-support facilities and in the scarcity of developable, well-located real estate inside established government ecosystems.

  • Defense and federal modernization: Long-cycle procurement and modernization initiatives require new or upgraded facilities for engineering, support, and program execution.
  • Clustering and decentralization pressures: Government-related organizations continue to balance operational resilience and continuity needs, often benefiting from pre-positioned, nearby capacity.
  • Redevelopment and spec-to-fit economics: Upgrading aging assets and tailoring layouts and infrastructure can support renewals and new leasing in submarkets where high-quality supply is limited.
  • Supply constraints in core submarkets: Established government hubs have zoning, land availability, and entitlement limitations. This scarcity can translate into more stable pricing power for well-located, mission-fit assets.

⚠ Risk Factors to Monitor

  • Government budget and procurement variability: Defense spending cycles and contract awards can influence tenant expansion plans and credit profiles.
  • Tenant concentration and lease rollover risk: A meaningful share of exposure to specific government-adjacent contractors can increase sensitivity to tenant-level decisions and renewal timing.
  • Capital intensity and development execution: Development and redevelopment require sustained access to capital and disciplined execution (cost, schedule, and stabilization assumptions).
  • Interest-rate and refinancing dynamics: REIT capital structures and development pipelines can be affected by changes in the cost of debt and equity.
  • Regulatory and security-related compliance: Facility requirements for security, access, and compliance may increase operating complexity and capex needs.

📊 Valuation & Market View

The market typically values specialized REITs on cash-flow durability rather than pure asset replacement cost. Common valuation frameworks include:

  • AFFO/FFO-based multiples and related coverage metrics (reflecting property-level rent durability and operating cost pass-through).
  • Implied capitalization rates on the property portfolio (driven by growth expectations, leasing risk, and quality of submarkets).
  • Development contribution to future cash flows (pipeline quality, expected stabilization cadence, and risk-adjusted yields).

Key drivers that move the valuation conversation include occupancy trends, leasing spreads at renewal, the margin profile of lease structures, the stability of tenant credit characteristics, and the underwriting credibility of the development pipeline.

🔍 Investment Takeaway

CDP is positioned to benefit from a structurally sticky demand base—defense and federal mission operations—where relocation is operationally and programmatically difficult. Its edge is rooted in geographic specialization in government-cluster submarkets, reinforced by tenant switching frictions and the ability to redevelop mission-fit facilities in supply-constrained locations. The long-term thesis rests on durable leasing cash flows and measured growth from redevelopment and targeted development, tempered by standard REIT risks around tenant concentration, capital cycles, and execution.


⚠ AI-generated — informational only. Validate using filings before investing.

📰 Market News & Coverage

15 Stories Available

Real-time institutional reporting and market updates for CDP.

seekingalpha.com2026-06-05

COPT Defense Properties: Unique Property Niche Makes Shares A Gem

COPT Defense Properties remains a 'buy' due to its unique defense-focused portfolio, stable government demand, and strong tenant retention. CDP's 4% dividend is highly secure, with a 46% FFO payout ratio and ample retained cash flow to fund organic growth and development projects. Recent financials show 6% FFO growth, 95.6% defense portfolio occupancy, and 5.4% same-property NOI growth, underscoring operational strength.

zacks.com2026-06-05

Why COPT Defense (CDP) is a Top Dividend Stock for Your Portfolio

Dividends are one of the best benefits to being a shareholder, but finding a great dividend stock is no easy task. Does COPT Defense (CDP) have what it takes?

prnewswire.com2026-06-02

WuXi Biologics Named to CDP Supplier Engagement Assessment A List for the Second Consecutive Year

SHANGHAI, June 2, 2026 /PRNewswire/ -- WuXi Biologics (2269.HK), a leading global Contract Research, Development, and Manufacturing Organization (CRDMO), today announced that it has been named to the CDP Supplier Engagement Assessment (SEA) A List for the second consecutive year. The recognition highlights the company's leadership in engaging suppliers on climate-related issues and reflects its strong performance in governance, target-setting, Scope 3 emissions disclosure, and value chain engagement.

businesswire.com2026-06-02

Aptar Named a CDP Supplier Engagement Leader for the Sixth Consecutive Year

CRYSTAL LAKE, Ill.--(BUSINESS WIRE)--Aptar Named a CDP Supplier Engagement Leader for the Sixth Consecutive Year.

businesswire.com2026-05-27

COPT Defense to Present at Nareit's REITweek: 2026 Investor Conference

COLUMBIA, Md.--(BUSINESS WIRE)--COPT Defense Properties (NYSE: CDP) (“COPT Defense” or the “Company”) announced that its President and CEO, Stephen E. Budorick, will provide an update on the Company and participate in a question and answer session at Nareit's REITweek: 2026 Investor Conference. The presentation will be held on June 2, 2026 at 8:45 a.m. Eastern Time at the New York Hilton Midtown in New York, NY. A live audio webcast of the presentation and accompanying materials will be availab.

fool.com2026-05-27

Alpha Wave Global Initiates COPT Defense Properties Position, According to Recent SEC Filing

COPT Defense Properties serves defense and intelligence tenants near secure government hubs. Investors will be closely watching whether that niche can keep supporting growth while much of the office market remains under pressure.

reuters.com2026-05-25

Italian state investor CDP to raise stake in payments group Nexi

Italian state investor CDP Equity plans to raise its stake ​in payments group Nexi to as much ‌as 29.9%, it said on Monday, bolstering a player in a sector viewed as increasingly strategic.

zacks.com2026-05-20

COPT Defense (CDP) Could Be a Great Choice

Dividends are one of the best benefits to being a shareholder, but finding a great dividend stock is no easy task. Does COPT Defense (CDP) have what it takes?

gurufocus.com2026-05-18

DaVita Sets Bold 2030 Community Care Commitments After Exceeding Prior Five-Year ESG Goals

DaVita Sets Bold 2030 Community Care Commitments After Exceeding Prior Five-Year ESG Goals PR Newswire DENVER, M

businesswire.com2026-05-14

COPT Defense Declares Second Quarter 2026 Common Dividend

COLUMBIA, Md.--(BUSINESS WIRE)--COPT Defense Properties (NYSE: CDP) (“COPT Defense” or the “Company”) announced today that its Board of Trustees declared a regular quarterly dividend of $0.32 per common share for the second quarter ending June 30, 2026. The second quarter 2026 dividend represents an annualized amount of $1.28 per share and is payable on July 15, 2026, to shareholders of record on June 30, 2026. About COPT Defense COPT Defense, an S&P MidCap 400 Company, is a self-managed RE.

zacks.com2026-05-12

COPT Defense (CDP) Upgraded to Buy: Here's What You Should Know

COPT Defense (CDP) might move higher on growing optimism about its earnings prospects, which is reflected by its upgrade to a Zacks Rank #2 (Buy).

zacks.com2026-05-04

COPT Defense (CDP) Could Be a Great Choice

Dividends are one of the best benefits to being a shareholder, but finding a great dividend stock is no easy task. Does COPT Defense (CDP) have what it takes?

reuters.com2026-05-04

Italy court rejects CDP bid to block reappointment of Milan bourse CEO, sources say

An Italian court rejected a request by state lender Cassa Depositi ‌e Prestiti to block the reappointment of Fabrizio Testa as chief executive of the Milan Stock Exchange, two sources familiar with the matter said on Monday.

seekingalpha.com2026-05-03

REITs Excel, Earnings Swell, Fed Rebels

U.S. equity markets advanced for a fifth straight week - their longest winning streak since 2024 - as strong earnings, resilient data, and hopes for lasting Iran peace fueled optimism. Investors looked through another oil-price surge and inflationary pressure, focusing instead on corporate resilience and economic strength despite a complex macro backdrop shaped by geopolitical and policy uncertainty. The Fed held rates steady in an unusually fractured 8-4 vote, while Powell's plan to remain on the Board broke precedent and raised politically charged succession questions.

reuters.com2026-04-29

Italy's CDP against selling stake in Nexi, sources say

Italy's state lender Cassa ​Depositi e Prestiti (CDP) has ‌no plans to divest from payments group Nexi NEXII.Mi, two sources familiar with ​the matter said on ​Wednesday.

📊 AI Financial Analysis

Powered by StockMarketInfo
Earnings Data: Q Ending 2026-03-31

"CDP reported Q1 2026 revenue of $200.6M and net income of $38.6M (EPS $0.34). Versus Q1 2025, revenue increased +6.1% YoY ($200.6M vs. $189.9M) and net income decreased -7.6% YoY ($38.6M vs. $41.7M). QoQ, revenue rose +1.6% ($200.6M vs. $197.4M) while net income edged up +2.8% ($38.6M vs. $37.5M). Profitability was mixed: net margin was roughly stable YoY (19.2% Q1 2026 vs. 22.1% Q1 2025) and improved slightly QoQ (19.2% vs. 19.0%), but gross profit margin contracted sharply YoY (98.5% reported in Q1 2026 vs. 15.5% in Q1 2025), suggesting significant accounting/line-item effects in this dataset. Operating income increased to $119.2M in Q1 2026 with an operating margin of 59.4%. Cash flow metrics appear non-informative for Q1 2026 (net cash from operations reported as 0 and free cash flow as 0), but Q4 2025 showed strong operating cash flow ($84.4M) alongside a dividend outflow. From a shareholder-return perspective, CDP’s stock is up +24.0% over 1 year (with additional gains over 6M and YTD), indicating strong capital appreciation. Balance sheet data for Q1 2026 shows reduced reported cash/liabilities, limiting leverage interpretation, but equity remains positive (~$1.57B). Overall, the stock’s momentum plus resilient EPS support the rating, despite YoY net income softness."

Revenue Growth

Positive

Revenue rose +6.1% YoY (Q1 2026 $200.6M vs. Q1 2025 $189.9M) and +1.6% QoQ (vs. Q4 2025 $197.4M), indicating modest but positive top-line momentum.

Profitability

Neutral

Net income declined -7.6% YoY (Q1 2025 $41.7M to Q1 2026 $38.6M) but improved +2.8% QoQ (Q4 2025 $37.5M). Net margin was broadly stable sequentially (~19.2%) but lower YoY vs. ~22.1% in Q1 2025.

Cash Flow Quality

Caution

Q1 2026 cash flow line items are reported as 0 (operating cash flow and free cash flow), limiting confidence in cash generation. Prior quarter (Q4 2025) showed strong operating cash flow ($84.4M) and meaningful dividend payments.

Leverage & Balance Sheet

Neutral

Equity is positive and fairly stable (~$1.57B in Q1 2026). However, Q1 2026 balance sheet aggregates show unusual reductions in cash/debt fields, so leverage interpretation is less reliable; resilience cannot be fully validated from this dataset alone.

Shareholder Returns

Strong

Strong capital appreciation: +24.0% 1Y and positive 6M/YTD performance. Dividend yield is small in the provided ratios, so total return appears driven primarily by price momentum.

Analyst Sentiment & Valuation

Neutral

Current price is $32.49 with a consensus target of ~$34.67 (~+6.7% upside). Price momentum is strong, but implied upside is moderate versus the momentum-driven valuation profile.

Disclaimer:This analysis is AI-generated for informational purposes only. Accuracy is not guaranteed and this does not constitute financial advice.

Fundamentals Overview

Loading fundamentals overview...

CDP delivered a strong Q1 2026 with FFO/share of $0.69 (+6.2% YoY), $0.01 above the guidance midpoint, driven by renewal leasing, favorable timing of R&M, and unbudgeted real estate tax refunds (partially offset by winter weather). Same-property cash NOI grew 5.4% YoY, while average occupancy increased by 70 bps and portfolio occupancy reached 94.4% (95.6% in defense IT). Management used San Antonio’s U.S. government campus renewal to materially reduce 2026 maturity risk (expiring annualized rental revenue fell from 21% to 11%). Guidance was raised: FFO/share midpoint to $2.76, same-property cash NOI growth to 3% (+50 bps), tenant retention to 82.5% (+250 bps), and capital committed to $290M (+$40M). The key watch-outs are higher 2026 financing costs (~$0.09), policy/appropriation timing uncertainty for defense budgets, and potential friction executing vacancy leasing as occupancy nears peak levels.

AI IconGrowth Catalysts

  • 70-basis-point increase in average occupancy supporting same-property cash NOI (+5.4% YoY)
  • San Antonio U.S. government renewal campus: full renewal of nearly 1.0M sf, reducing 2026 expiring annualized rental revenue from 21% to 11%
  • Golden Dome-related demand visibility from FY 2027 defense budget request; management cites 12-18 month lag to lease executions
  • New investment activity: fully leased build-to-suit 620 Guardian Way (National Business Park) plus Redstone Gateway ATFP-compliant ATFP/force protection inventory development and Westfields land acquisition enabling future leasehold upside
  • Vacancy leasing momentum: 92k sf vacancy leasing executed in Q1 (~70% cyber-related) and 152k sf YTD (38% of 400k target)

Business Development

  • U.S. government tenant: renewed nearly 1.0M sf campus near Lackland AFB (San Antonio) and expected 100% retention on 950k sf remaining large U.S. government leases with executions anticipated in 2027
  • FBI technology division (cyber group) and top-20 defense IT tenants: Mission Ridge (Westfields) occupied by FBI tech + two leading defense contractors; referenced as support for Westfields ground lease acquisition
  • Government inside-the-fence missions and ATFP needs: 150k sf Redstone Gateway development project at Redstone Arsenal (inside secure parcel) targeting missile defense/space growth demand
  • Defense contractors: Huntsville 8100 Rideout Road remaining floor leased (doubling footprint to 50k+ sf) and Franklin Center expansion lease signed (12k sf; tenant footprint to 60k sf) with a top 10 U.S. defense contractor
  • Credit/rating agency: Moody’s upgraded investment-grade rating to Baa2 with stable outlook (March)

AI IconFinancial Highlights

  • FFO per share: $0.69, up 6.2% YoY; $0.01 above the midpoint of guidance
  • Same-property cash NOI: +5.4% YoY; elevated by ~200 bps muted growth due to $2M less nonrecurring real estate tax refunds in 2026 vs prior year
  • Guidance midpoint increases: FFO per share +$0.01 to $2.76; same-property cash NOI growth midpoint +50 bps to 3%; tenant retention midpoint +250 bps to 82.5%; capital committed midpoint +$40M to $290M
  • Leasing/occupancy: portfolio occupancy 94.4% and defense IT 95.6%; occupancy up 80 bps (total) and 30 bps (defense IT) YoY
  • Rent spreads on renewals: cash rent spreads +3.8% and GAAP rent spreads +12%; San Antonio renewal cash rent spreads +4.2% with annual rent bumps of 3%
  • Capital structure / financing impact: March 16 repaid $400M bond at 2.25%; incremental interest on new 4.5% unsecured notes (issued at 95 bps credit spread) drives ~$0.09 higher financing costs in 2026

AI IconCapital Funding

  • Dividend: increased annual dividend by $0.06/share (+4.9%) in February; described as fourth consecutive dividend increase; 16.4% dividend growth since 2022
  • Debt actions: repaid $400M bond on March 16 (2.25% rate); previously prefunded via $400M 5-year unsecured notes at 4.5% with 95 bps credit spread and ~9-year maturity
  • Near-term refinancing risk: next bond maturity not until 2028
  • Buyback: none mentioned in transcript

AI IconStrategy & Ops

  • Renewal leasing execution: 1.2M sf renewed; 91% tenant retention in quarter; retention on leases >50k sf expected to be even higher once San Antonio renewals are included
  • Vacancy leasing: focus on cyber; 92k sf executed (~70% tied to cyber); 115k sf prospects in advanced negotiations (>90% likely)
  • Development pipeline and pre-leasing: active pipeline >1M sf, 73% pre-leased, >$500M in capital commitments; five of seven projects 100% pre-leased
  • Inventory build pacing: management not ready to accumulate more inventory than traditionally, but redesigning/land-condition work to shorten delivery timeframe; potential acceleration if demand ramps (notably Huntsville for Golden Dome)
  • Key development execution: commenced construction of 410 Goss Road; substantial completion of 8500 Advanced Gateway; planning next inventory building RG 6300 once an ~80% pre-leased threshold is approached

AI IconMarket Outlook

  • Elevated full-year 2026 guidance midpoints: FFO/share $2.76; same-property cash NOI growth 3%; tenant retention 82.5%; capital committed $290M
  • Second-quarter 2026 guidance established: FFO per share range $0.68 to $0.70
  • Leasing targets cited: full-year vacancy leasing target 400k sf (Q1 YTD 152k sf = 38%); expects to remain on track
  • Maturity risk reduction: expiring annualized rental revenue reduced from 21% to 11% after San Antonio renewals

AI IconRisks & Headwinds

  • Higher financing costs: ~$0.09 of additional interest expense in 2026 from refinancing into 4.5% unsecured notes
  • Policy/timing uncertainty: defense budget request not yet passed/appropriated; appropriations timing could remain unpredictable due to broader bargaining dynamics and other unfunded priorities
  • Vacancy leasing friction as properties become fuller: management noted increased difficulty to match exact emerging demand as assets approach full occupancy, with the “wildcard” being whether vacancies appear in other assets
  • Development pipeline variability: development leasing pipeline decreased by ~400k sf vs last quarter due to harvesting some deals and a decision to reduce future-demand exposure for a specific mission that appears committed to MILCON
  • Data center shell strategy constraint (Des Moines): impasse on power; economics too burdensome previously, expected timeline 3-4 years out

Q&A: Analyst Interest

  • Topic: Long-term earnings power vs defense spending acceleration—analysts asked whether the 4.5% FFO/share CAGR could accelerate as the development pipeline matures. Management replied growth is muted this year due to ~$0.09 higher interest expense, but expects a return to recent growth path, with upside possible if defense spending appropriates.
  • Topic: Vacancy leasing and occupancy ceiling—analysts asked if the 400k sf vacancy leasing target might rise given historically strong performance. Management stated it becomes harder to execute vacancy leasing as properties get very full, though some space returns even with strong retention; they planned to beat the target and remain comfortable making it.
  • Topic: Development starts and spec product posture—analysts asked whether pipeline strategy changes imply more spec inventory and whether tenant demand timing would shift. Management said they are redesigning/land-prepping to move quickly, but will not accumulate extra inventory yet; more aggressive starts depend on demand materializing formally, especially for Huntsville Golden Dome.

Sentiment: POSITIVE

Note: This summary was synthesized by AI from the CDP Q1 2026 earnings transcript. Financial data is complex; please verify all metrics against official SEC filings before making investment decisions.

📋 Official Regulatory 10-K / 10-Q SEC Filings

Direct authenticated documentation links to audited SEC database reports for CDP.

SEC EDGAR Live Feed
Loading financial data and tables...
📁

SEC Filings (CDP)

© 2026 Stock Market Info — COPT Defense Properties (CDP) Financial Profile