Coherent, Inc.

Coherent, Inc. (COHR) Market Cap

Coherent, Inc. has a market capitalization of $59.78B.

Price: $376.99

-44.91 (-10.64%)

Market Cap: 59.78B

NYSE · time unavailable

CEO: James Robert Anderson

Sector: Technology

Industry: Hardware, Equipment & Parts

IPO Date: 1987-10-02

Website: https://www.coherent.com

Coherent, Inc. (COHR) - Company Information

Market Cap: 59.78B|Sector: Technology

Company Profile

Coherent, Inc. provides lasers, laser-based technologies, and laser-based system solutions for a range of commercial, industrial, and scientific research applications. It operates in two segments, Original Equipment Manufacturers (OEM) Laser Sources and Industrial Lasers & Systems. The company designs, manufactures, markets, and services lasers, laser tools, precision optics, and related accessories; and laser measurement and control products. Its products are used for applications in microelectronics, materials processing, OEM components and instrumentation, and scientific research and government programs. The company markets its products through a direct sales force in the United States, as well as through direct sales personnel and independent representatives internationally. Coherent, Inc. was founded in 1966 and is headquartered in Santa Clara, California. As of July 1, 2022, Coherent, Inc. operates as a subsidiary of II-VI Incorporated.

Analyst Sentiment

65%
Buy

From 20 Active Polls

1Y Forecast: $324.00

▼ -14.1% Potential Upside

Consensus Target Metrics

Low Bound

$230

Median

$330

High Bound

$455

Average

$324

Price & Moving Averages

Loading chart...

🎯 Wall Street Analyst Intelligence Report

1-Year structural target targets, chart projections, and sentiment maps.

Average 1Y Target
$324.00
▼ -14.06% Upside
Low Target
$230.00
-39% Risk
Median Target
$330.00
-12% Mid
High Target
$455.00
21% Max
Consensus
Buy
24 / 30 Buys

Consensus Trend Projection

Trailing closures vs. 12-month metrics map.

Analyst Vote Distribution

Aggregate institutional coverage sentiment weights.

📊 Historical Valuation Multiples

Real-time Trailing Twelve Month (TTM) momentum side-by-side with discrete quarterly metrics.

Fiscal QuarterTTMQ1 2026Q4 2025Q3 2025Q2 2025Q1 2025Q4 2024Q3 2024Q2 2024
Period EndingTrailing 12MMar 31, 2026Dec 31, 2025Sep 30, 2025Jun 30, 2025Mar 31, 2025Dec 31, 2024Sep 30, 2024Jun 30, 2024
Market Cap ($M)59,78137,04228,70116,75013,87210,07914,66113,48211,100
Enterprise Value ($M)61,61438,87431,38319,40416,85713,13317,80716,67014,477
Price to Earnings Ratio (P/E)124.9948.4148.8118.50-36.27160.3835.45130.21-57.29
Price/Earnings-to-Growth Ratio (PEG)6.827.385.45-17.2236.405.5250.67-6.56
Price to Sales Ratio (P/S)9.0520.5117.0210.599.076.7310.2210.008.45
Price to Book Ratio (P/B)5.493.473.362.011.711.291.932.451.47
Price to Free Cash Flow Ratio (P/FCF)-111.07-96.59-299.91-288.85-13013.28197.09179.46221.04177.83
Enterprise Value to Sales (EV/Sales)21.5318.6112.2711.028.7712.4112.3711.01
Enterprise Value to EBITDA (EV/EBITDA)53.81210.9396.6757.1856.7944.9663.7570.2565.52
Debt to Equity Ratio1.600.320.420.420.480.500.530.760.57

COHR Growth Runway Model

Standard long term linear growth fade

Multi-Stage Discounted Cash Flow Sandbox

Market Price$376.99
Intrinsic Value$194.05
Market Alignment
Overvalued by 48.5%relative to calculated intrinsic value
9.00%
Exp: 19%19%
i

Growth runway slowdown

This value provides a time window for the growth rate to decline beyond Stage 1 toward the terminal rate. Longer windows are most useful for companies with high growth starting conditions or strong competitive advantages. This option stretches out the growth rate slowdown across 5, 10, or 15-year steps. A high-growth starting condition (exceeding a 25% initial growth rate) automatically applies a curve decay to simulate realistic, rapid market saturation.
i

Terminal growth rate

With long-term inflation between 3-5%, revenue must grow by that baseline to maintain flat real-world market share. This value sets the permanent terminal growth rate to factor into the valuation beyond the growth slowdown runway toward maturity.

3-Stage Financial Runway Horizon

🧠 Perpetuity Horizon Engine (Stage 3: Post-2035)

Terminal FCF Base$0.83B
Perpetuity TV Value$15.70B
Discounted TV (PV)$6.63B
TV Weighting %67.2%
⚠️
Financial Model Disclaimer & Risk Disclosure: This interactive scenario simulator is an educational sandbox provided strictly for informational and analytical research purposes. Core historical financial statements and consensus estimates are sourced directly via Financial Modeling Prep (FMP). All downstream outputs are entirely deterministic, hypothetical projections generated by combining automated mathematical formulas (including linear interpolation and Gaussian bell-curve decay models) with user-selected variables and third-party financial data inputs. Users assume all liability for trading decisions executed based on these sandbox calculations.

📘 Full Research Report

ℹ️

AI-Generated Research: This report is for informational purposes only.

📘 COHERENT CORP (COHR) — Investment Overview

🧩 Business Model Overview

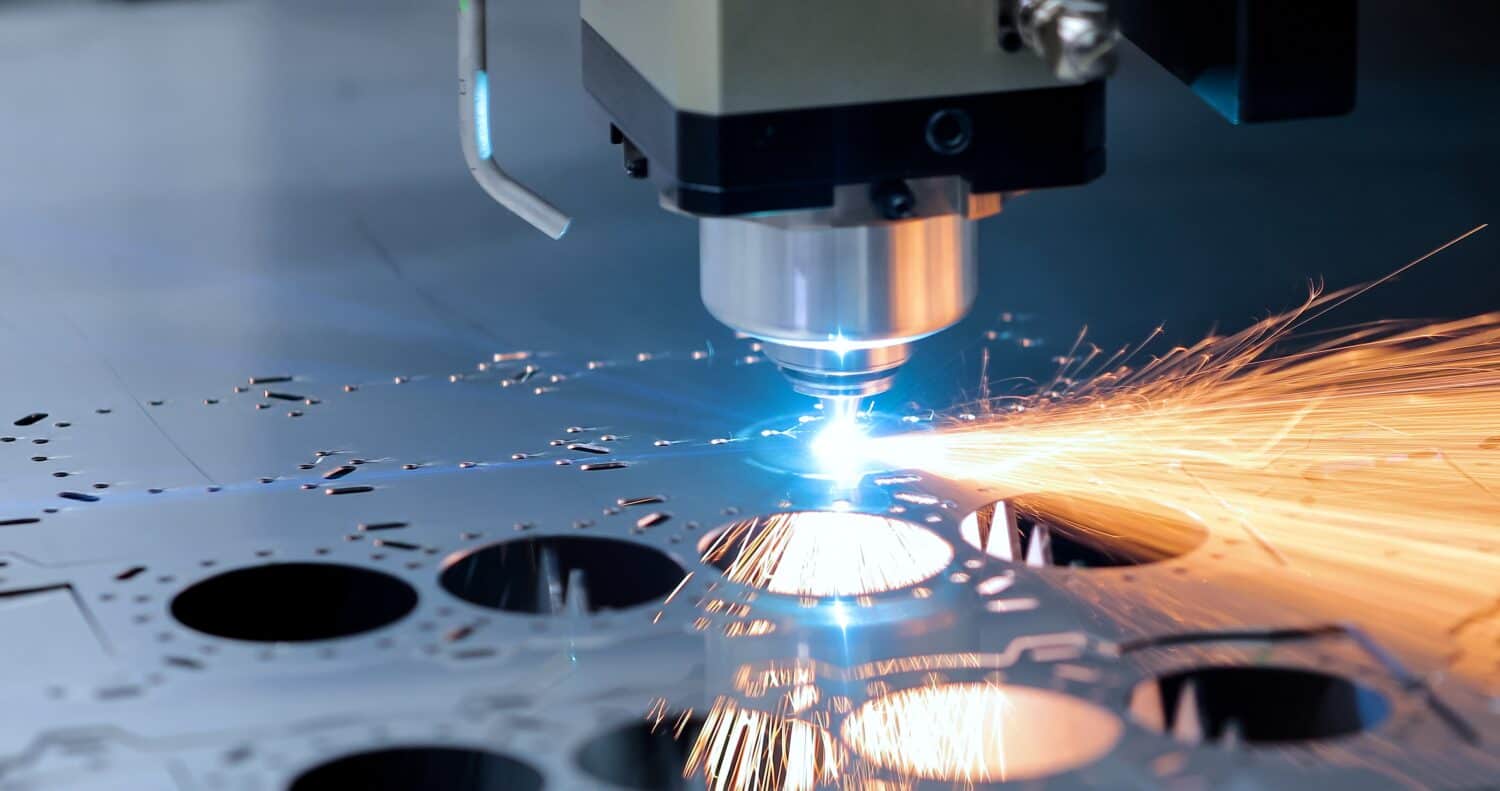
Coherent designs and manufactures photonics subsystems and laser-based solutions used across industrial manufacturing, communications, semiconductor and electronics processing, and medical applications. The business model is centered on converting optical and laser technology into qualified, application-specific equipment (and associated components) that perform reliably at customer sites and integrate into established production workflows.

In many of its end-markets, Coherent sells not only core laser engines and optical components, but also system-level capabilities (including customization, integration know-how, and lifecycle support). Customer adoption typically follows technology qualification, process validation, and performance benchmarking—creating practical stickiness once a laser platform is embedded into production.

💰 Revenue Streams & Monetisation Model

Revenue is primarily driven by sales of laser systems, laser components, and related photonics solutions. Monetisation tends to include:

  • Product sales (transactional): New equipment purchases tied to customer capital expenditure cycles.
  • Service and support (more repeatable): Maintenance, calibration, upgrades, and installed-base support that follows long operating lifetimes and installed system references.
  • Consumables/aftermarket opportunities (smaller but recurring): Where applicable, parts and replacement activities scale with the installed base.

Margin structure is typically influenced by (1) mix toward higher-value photonics products and more complex systems, (2) manufacturing yields and supply-chain execution for precision components, and (3) service contribution from an expanding installed base. The most durable margin profile generally comes from a combination of high-performance differentiation and post-sale service attach.

🧠 Competitive Advantages & Market Positioning

Coherent’s competitive position is supported by a combination of switching costs, intellectual property / engineering know-how, and installed-base-driven support. While the company does not fit a software-like network effects framework, it benefits from practical, operational stickiness in industrial and technology-intensive processes.

  • Switching costs (qualification and integration): Laser performance must meet strict specifications for throughput, stability, and quality. Once tuned into a customer process, replacement involves re-qualification, re-engineering, and downtime costs.
  • Intangible assets (engineering IP and platform capability): Laser architecture, optical design, and control systems are difficult to replicate quickly at the same performance tier.
  • Installed-base support economics: Lifecycle services become more valuable as a customer fleet expands, improving customer retention and aftermarket revenue potential.

Competitive benchmarking (primary peers):

  • IPG Photonics: Strong in fiber laser technology; often competes in industrial fiber laser applications where cost and performance matter.
  • Lumentum (and related photonics suppliers): Competes across telecom and industrial photonics components; emphasis can skew more toward communication-layer products.
  • II-VI / Coherent-adjacent photonics ecosystem peers: Competes where photonics materials/components and precision optical solutions are key.

Positioning contrast: Coherent’s focus tends to span both laser platforms and system-level application solutions across semiconductor/electronics processing and industrial manufacturing, which can shift competition from pure component pricing toward performance, reliability, integration, and service responsiveness. Many rivals can match certain optical specifications, but competing for qualified production footprints typically requires proven in-factory outcomes and service capability.

🚀 Multi-Year Growth Drivers

Over a 5–10 year horizon, Coherent’s addressable opportunity is shaped by demand for precision energy and photonics in capital-intensive manufacturing and communications infrastructure. Key secular drivers include:

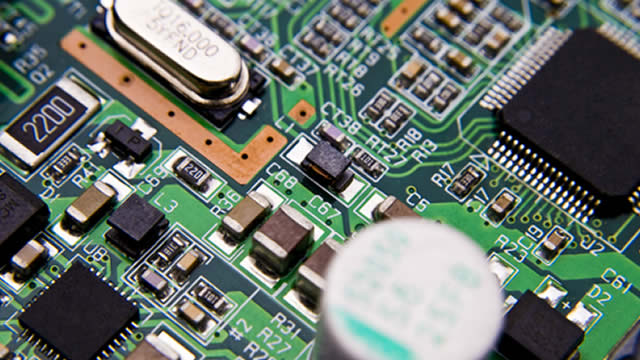
  • Semiconductor and advanced electronics processing: Continued wafer fabrication complexity, yield optimization, and materials processing intensity support demand for precision laser-based steps and adjacent photonics.
  • Data center and communications infrastructure build-out: Growth in optical technologies and photonics-enabled interconnects supports demand for laser and optical components used in high-bandwidth environments.
  • Industrial automation and high-throughput manufacturing: Upgrading production lines toward higher quality, faster cycle times, and tighter tolerances increases utilization of advanced laser systems.
  • Medical and life sciences tooling: Ongoing replacement cycles and technology adoption in clinical/therapeutic workflows can provide steadier demand pockets versus purely cyclical industrial segments.

TAM expansion is less about entering new end markets from scratch and more about increasing penetration of laser-based solutions within existing customers as process requirements tighten and performance expectations rise.

⚠ Risk Factors to Monitor

  • Industry cyclicality: Product revenue can be sensitive to customer capex cycles in industrial manufacturing, semiconductor equipment spending, and communications infrastructure.
  • Technological substitution and performance shifts: Competitive technologies (including alternative laser architectures) can pressure pricing or demand if performance/efficiency improvements shift market preferences.
  • Execution and manufacturing complexity: Precision components and optical assemblies require high yield and robust supply-chain management; operational disruptions can impact delivery schedules and margins.
  • Competitive pressure on pricing: Prominent peers and regional suppliers can intensify competition, particularly when buyers emphasize short-term cost.
  • Geopolitical and export controls: Photonics products and components can fall under trade restrictions that alter demand visibility and require compliance investment.

📊 Valuation & Market View

The market typically frames valuation for photonics/laser equipment and components using a blend of EV/EBITDA (quality of earnings power and operating leverage) and P/S (where growth and mix matter). The valuation multiple is generally most responsive to:

  • Gross margin and product mix: Higher-value systems and better service attach can support premium earnings quality.
  • Evidence of durability in installed-base economics: Stable service revenue contribution can reduce earnings volatility.
  • Operational execution: Yield performance, delivery reliability, and cost control often influence both margins and credibility with customers.
  • End-market growth quality: Mix toward semiconductor/advanced electronics processing and communications-related demand can improve forward expectations versus purely cyclical industrial segments.

🔍 Investment Takeaway

Coherent’s long-term investment case rests on durable differentiation in photonics—supported by switching costs from qualification and integration, intellectual property and engineering depth, and installed-base-driven service economics. With multi-year demand tailwinds from semiconductor complexity, data center and communications infrastructure, and precision industrial manufacturing, Coherent is positioned to compete not only on headline component performance, but also on qualification outcomes, reliability, and lifecycle support.


⚠ AI-generated — informational only. Validate using filings before investing.

📰 Market News & Coverage

15 Stories Available

Real-time institutional reporting and market updates for COHR.

fool.com2026-06-05

The Hidden Nvidia Trade Nobody on Wall Street Is Talking About

Nvidia is investing in key AI infrastructure companies, which could help it remain the dominant player in the AI hardware ecosystem.

zacks.com2026-06-05

Coherent (COHR) Up 32.2% Since Last Earnings Report: Can It Continue?

Coherent (COHR) reported earnings 30 days ago. What's next for the stock?

invezz.com2026-06-02

Why Coherent and Lumentum stocks jumped on Tuesday

Coherent and Lumentum Holdings shares surged on Tuesday as investors piled into optical networking stocks. The rally followed comments from Nvidia Chief Executive Jensen Huang, highlighting the growing importance of optical interconnects in artificial intelligence data centers.

barrons.com2026-06-02

Coherent and Lumentum Stocks Rise Sharply. Networking Stocks Get a Big Marvell Bump.

Coherent, Lumentum, and Corning stocks surge Tuesday after Nvidia CEO Jensen Huang talks up optical networking demand.

247wallst.com2026-06-02

Coherent Advances 16%, Lumentum Climbs 13%, Applied Optoelectronics Adds 8% as Optics Rally Broadens

The optics complex is rallying together at midday Tuesday, and the leadership has flipped from yesterday.

benzinga.com2026-06-02

Marvell Gets The Headlines — Coherent Stock Gets The All-Time High

When NVIDIA Corp. (NASDAQ:NVDA) CEO Jensen Huang said data centers are being rewired around optical interconnects, most traders ran straight to Marvell Technology (NASDAQ:MRVL).

seekingalpha.com2026-06-02

Coherent: This Party Is Here To Stay

Coherent is initiated at a buy rating, supported by accelerating growth, robust Q4 guidance, and a long-term optical/photonics opportunity. Q3 saw 21% YoY revenue growth, 55% EPS growth, and expanding margins, with data center demand outpacing supply. Q4 guidance implies further acceleration: 29% revenue growth, 62% EPS growth, and continued margin expansion.

247wallst.com2026-06-01

Applied Optoelectronics Is Up 439% in 2026: Is It Outperforming Other Optics Stocks Like Lumentum and Coherent?

Shares of Applied Optoelectronics (NASDAQ:AAOI) are up 20% in midday trading to around $190, snapping back hard from a Friday close of $158.41.

fool.com2026-05-31

Nvidia Recently Plowed $3.8 Billion Into These 2 Artificial Intelligence (AI) Stocks

Nvidia owns a small group of stocks.

fool.com2026-05-29

This Fund Manager Has a Brilliant Strategy for Investing in AI Stocks

Fund manager Gavin Baker identified a "cross-sectional inefficiency" in AI stocks. He argued that valuations can't be accurate for both the cheap and expensive stocks in AI.

gurufocus.com2026-05-29

Coherent Corp (COHR) Shares Fall 4.1% -- What GF Score of 72 Tells Investors

On May 29, 2026, Coherent Corp (COHR) shares fell 4.1% to $361.47. This decline comes in the context of a 52-week trading range that has seen prices as high as

247wallst.com2026-05-29

Applied Optoelectronics Tumbles 9%, Coherent Sinks 8%, Lumentum Falls 4% as Optics Stocks Cool Off

Shares of Applied Optoelectronics (NASDAQ:AAOI) are down 9% midday Friday to roughly $154, leading a broader cool-off in AI optics names.

zacks.com2026-05-28

Coherent vs. AppLovin: Which AI Growth Stock is Better Positioned?

Coherent's AI infrastructure demand, rising bookings and strong liquidity give COHR an edge over APP's premium valuation.

247wallst.com2026-05-28

Stocks In AI Bottleneck Soar 1,000%. Now Nvidia Is Demanding 20X More Supply

The AI boom has already burned through one shortage after another.

zacks.com2026-05-26

AXT vs. Coherent: Which Photonics Chip Supplier Is the Better Buy?

AXTI is gaining momentum in AI photonics as record backlog, rising indium phosphide demand and capacity growth fuel its early-cycle story.

📊 AI Financial Analysis

Powered by StockMarketInfo
Earnings Data: Q Ending 2026-03-31

"Headline (2026-03-31 / Q3): Revenue $1.806B, EPS $0.97 (diluted $0.97), Net Income $191.4M; net margin ~10.6%. QoQ revenue increased to $1.806B from $1.686B (+7.1% QoQ) and net income rose from $147.0M to $191.4M (+30.2% QoQ). YoY, revenue grew from $1.498B to $1.806B (+20.5% YoY) while net income improved from $15.7M to $191.4M (notable turnaround; +~1,119% YoY). Profitability strengthened through the year: net margin moved from ~1.0% (2025-03-31) to ~10.6% (2026-03-31), indicating strong operating leverage and/or better expense discipline. Operating cash flow in the latest quarter was $9.95M, with free cash flow deeply negative at -$537.0M, primarily driven by heavy investing/cash outflows (e.g., capex and investing cash movements). Balance sheet liquidity appears robust: cash & short-term investments ~ $2.418T against total assets ~$17.29T, and equity is positive at ~$11.02T, though debt remains sizable ($3.43T total debt; net debt ~$1.83T). Shareholder returns are very strong: COHR is up ~522% over 1 year, far exceeding the +20% momentum threshold, supporting a high total shareholder return score despite the negative recent free-cash-flow quarter. Dividend/buyback activity exists but is small relative to market moves. Analyst valuation context: consensus target ~$286.71 vs. price ~$345.02 (implying downside to consensus)."

Revenue Growth

Strong

Latest revenue $1.806B vs $1.686B QoQ (+7.1%) and vs $1.498B YoY (+20.5%). Trend is consistently upward across the last four quarters.

Profitability

Good

Net income rose to $191.4M (+30.2% QoQ) and surged vs $15.7M YoY (turnaround; ~+1,119%). Net margin expanded to ~10.6% from ~1.0% a year ago, indicating margin improvement over the period.

Cash Flow Quality

Caution

Operating cash flow was modest ($9.95M) and free cash flow was sharply negative (-$537.0M) in the latest quarter, suggesting cash generation was weak despite accounting profitability.

Leverage & Balance Sheet

Positive

Liquidity is strong (cash & short-term investments ~2.42T) and equity is positive (~11.02T). Debt remains meaningful (total debt ~3.43T; net debt ~1.83T), but solvency appears supported by equity and cash.

Shareholder Returns

Excellent

Exceptional 1-year price momentum (+522.2%), which dominates total shareholder return. Dividends are comparatively small, and buybacks are minimal, but the capital appreciation is very strong.

Analyst Sentiment & Valuation

Caution

Consensus target ~$286.71 is below the current price (~$345.02), implying unfavorable valuation vs. Street consensus even though near-term results are improving.

Disclaimer:This analysis is AI-generated for informational purposes only. Accuracy is not guaranteed and this does not constitute financial advice.

Fundamentals Overview

Loading fundamentals overview...

Coherent delivered another step-up quarter with record Q3 revenue of $1.8B (+7% sequential, +21% YoY; pro forma +9% sequential, +27% YoY) and strong profitability: non-GAAP gross margin 39.6% (+57 bps QoQ, +105 bps YoY) and non-GAAP EPS $1.41 (+55% YoY). The core story is operating leverage funded by supply-side acceleration: management sees June quarter growth as a “new inflection point,” primarily unlocked by rapid indium phosphide scaling. They now expect the 2x InP output goal one quarter early, with further >2x capacity by end of 2027, alongside improved yields from 6-inch production across EML/CW/PD devices. OCS momentum adds another lever after resolving an internal components bottleneck and ramping output at two facilities. Strategic optionality is sharpened by NVIDIA’s March 2026 CPO agreement (equity investment plus multiyear supply through decade end) and the staged CPO/multi-rail/thermal revenue ramps. Net: demand is strong and visible; execution and capacity scaling are translating into both growth and margin.

AI IconGrowth Catalysts

  • Data center: transceivers and OCS systems ramping; transceiver growth driven by 800G and rapid 1.6T adoption
  • 6-inch indium phosphide (InP) ramp unlocking higher output and yield; first transceivers shipped with 6-inch-produced components
  • OCS production capacity bottleneck resolved; ramping output across two production facilities
  • Co-packaged optics (CPO) commercialization timing: initial scale-out CPO revenue expected in 2H calendar 2026; scale-up CPO in 2H calendar 2027
  • Communications: multi-rail revenue ramp expected in 1H calendar 2027

Business Development

  • NVIDIA partnership (announced March 2026): NVIDIA $2B equity investment in Coherent plus multiyear supply agreement extending through end of decade; covers multiple CPO-related products including high-power CW lasers
  • Signed/in-process long-term supply agreements with multiple strategic customers including multiyear demand commitments and upfront investment to support capacity expansion

AI IconFinancial Highlights

  • Revenue: $1.8B record in Q3; +7% sequential and +21% YoY (GAAP basis as described); pro forma +9% sequential and +27% YoY
  • Non-GAAP gross margin: 39.6%, +57 bps QoQ and +105 bps YoY
  • Non-GAAP EPS (diluted): $1.41, +9% QoQ and +55% YoY
  • Operating margin (non-GAAP): 20.3% vs 19.9% QoQ and 18.6% YoY
  • Gross margin drivers: 6-inch InP yield improvements (EMLs, CW lasers, photodiodes), product input cost reductions, and pricing optimization
  • Capital allocation / balance sheet: reduced debt leverage ratio to 0.5x (from 1.7x in Q2; 2.1x YoY)
  • Q4 non-GAAP guidance: revenue $1.91B-$2.05B; gross margin 39%-41%; EPS $1.52-$1.72; tax rate 18%-20%; operating expenses $360M-$380M

AI IconCapital Funding

  • NVIDIA equity investment: $2B received/recognized impact reflected in cash balance increase to $3B from $1.5B (prior quarter)
  • Debt payments: $162M during Q3; reduced debt leverage ratio to 0.5x
  • Capital expenditures: $290M in Q3 vs $154M prior quarter and $112M year ago quarter; expects sequential capex increase in Q4 due to strong bookings/capacity ramp
  • No explicit share buyback figure provided in transcript

AI IconStrategy & Ops

  • Capacity expansion priority: doubling internal InP output capacity by end of calendar 2026; now expected to be achieved 1 quarter earlier than original plan
  • Further capacity: expects to more than double internal InP capacity again by end of calendar 2027 (implied >2x by year-end 2027 vs current base, per management framing)
  • 6-inch ramp operationalization: shipped first transceivers with 6-inch components; first contribution from Sherman, Texas; announced start of 6-inch production at third site in Zurich (beginning of calendar 2027); Sweden production already started
  • OCS supply-side unlock: resolved internal components bottleneck and improved internal component production, accelerating OCS production pacing
  • ERP and G&A efficiency: majority of company moved to single ERP platform; benefits expected in Q4 and more meaningful in fiscal 2027
  • Low-cost regional shared services initiatives contributing to SG&A leverage

AI IconMarket Outlook

  • June quarter (Q4 FY26) guidance midpoint implies acceleration: revenue $1.91B-$2.05B; non-GAAP gross margin 39%-41%; EPS $1.52-$1.72
  • Fiscal 2027 outlook: expects fiscal ’27 growth rate to exceed fiscal ’26
  • CPO revenue timing: initial scale-out CPO ramp begins in 2H calendar 2026; scale-up CPO begins in 2H calendar 2027
  • Transceivers: 800G expected to grow YoY in calendar 2026; 1.6T ramp expected through balance of 2026 and into 2027
  • Multi-rail: initial revenue ramp expected in 1H calendar 2027

AI IconRisks & Headwinds

  • Industry constraint in indium phosphide (InP) capacity/yields; though management is ahead on ramp, InP production remains a key dependency
  • Execution and scaling risk as 6-inch production expands across additional sites (Sweden then Zurich) and as production moves faster than historically expected
  • Near-term OCS production impact risk from internal component bottlenecks (explicitly cited as recently relieved, but could recur)
  • Gross margin upside may be limited by pricing/ mix and ongoing investment/R&D intensity even while cost/yield improvements continue
  • Industrial softness (parts of broader industrial market), though semiconductor capital equipment bookings improved meaningfully

Q&A: Analyst Interest

  • June quarter acceleration drivers (demand vs supply): Management cited a new inflection point implied by the June quarter guide, driven by exceptional bookings and visibility through calendar 2028. Supply is the key limiter being removed via faster InP ramp, OCS capacity improvements, and incremental platform timing (OCS in-quarter; CPO 2H26; multi-rail 1H27; thermal 2H27).
  • Indium phosphide upside and margin timing: Management said gross-margin impact was already visible in Q3 from 6-inch InP’s better cost structure (more than 4x devices, <half cost). Yields across three device types (EML, CW, PD) exceeded 3-inch. Zurich 6-inch starts early calendar 2027; ongoing ramp expected to keep benefiting gross margin into future quarters.
  • Gross margin fall-through and OCS bottleneck specifics: Sherri emphasized a steady gross-margin climb (7 of prior 8 quarters) and progress toward a >42% investor-day target via cost reductions, yield improvements, and pricing optimization. She highlighted most improvements in data center/communications. For OCS, management explained internal components pacing production capacity; relief improved internal component output, accelerating OCS production pace over the last 1–2 months.

Sentiment: POSITIVE

Note: This summary was synthesized by AI from the COHR Q3 2026 earnings transcript. Financial data is complex; please verify all metrics against official SEC filings before making investment decisions.

📋 Official Regulatory 10-K / 10-Q SEC Filings

Direct authenticated documentation links to audited SEC database reports for COHR.

SEC EDGAR Live Feed
Loading financial data and tables...
📁

SEC Filings (COHR)

© 2026 Stock Market Info — Coherent, Inc. (COHR) Financial Profile