Casella Waste Systems, Inc.

Casella Waste Systems, Inc. (CWST) Market Cap

Casella Waste Systems, Inc. has a market capitalization of $5.38B.

Price: $85.90

2.25 (2.69%)

Market Cap: 5.38B

NASDAQ · time unavailable

CEO: Edmond R. Coletta

Sector: Industrials

Industry: Waste Management

IPO Date: 1997-10-29

Website: https://www.casella.com

Casella Waste Systems, Inc. (CWST) - Company Information

Market Cap: 5.38B|Sector: Industrials

Company Profile

Casella Waste Systems, Inc., together with its subsidiaries, operates as a vertically integrated solid waste services company in the northeastern United States. It offers resource management services primarily in the areas of solid waste collection and disposal, transfer, recycling, and organics services to residential, commercial, municipal, institutional, and industrial customers. The company provides a range of non-hazardous solid waste services, including collections, transfer stations, and disposal facilities. It also markets recyclable metals, aluminum, plastics, and paper and corrugated cardboard that are processed at its facilities, as well as recyclables purchased from third parties. In addition, the company is involved in commodity brokerage operations. As of January 31, 2022, it owned and/or operated 50 solid waste collection operations, 65 transfer stations, 23 recycling facilities, 8 Subtitle D landfills, 3 landfill gas-to-energy facilities, and 1 landfill permitted to accept construction and demolition materials. Casella Waste Systems, Inc. was founded in 1975 and is headquartered in Rutland, Vermont.

Analyst Sentiment

81%
Strong Buy

From 11 Active Polls

1Y Forecast: $112.33

▲ +30.8% Potential Upside

Consensus Target Metrics

Low Bound

$102

Median

$115

High Bound

$120

Average

$112

Price & Moving Averages

Loading chart...

🎯 Wall Street Analyst Intelligence Report

1-Year structural target targets, chart projections, and sentiment maps.

Average 1Y Target
$112.33
▲ +30.77% Upside
Low Target
$102.00
19% Risk
Median Target
$115.00
34% Mid
High Target
$120.00
40% Max
Consensus
Buy
11 / 19 Buys

Consensus Trend Projection

Trailing closures vs. 12-month metrics map.

Analyst Vote Distribution

Aggregate institutional coverage sentiment weights.

📊 Historical Valuation Multiples

Real-time Trailing Twelve Month (TTM) momentum side-by-side with discrete quarterly metrics.

Fiscal QuarterTTMQ1 2026Q4 2025Q3 2025Q2 2025Q1 2025Q4 2024Q3 2024Q2 2024
Period EndingTrailing 12MMar 31, 2026Dec 31, 2025Sep 30, 2025Jun 30, 2025Mar 31, 2025Dec 31, 2024Sep 30, 2024Jun 30, 2024
Market Cap ($M)5,3795,0426,2196,0247,3227,0686,7005,8125,613
Enterprise Value ($M)6,4896,1517,3347,0658,3398,0207,5256,4566,521
Price to Earnings Ratio (P/E)764.27-227.55-619.14150.84351.48-367.37343.53251.76200.28
Price/Earnings-to-Growth Ratio (PEG)35.0730.4089.1627.5518.89
Price to Sales Ratio (P/S)2.8711.0213.2612.4115.7416.9515.6714.1214.88
Price to Book Ratio (P/B)3.483.213.963.844.714.574.323.795.41
Price to Free Cash Flow Ratio (P/FCF)52.57410.75158.25217.95316.67-1320.68203.68144.03204.45
Enterprise Value to Sales (EV/Sales)13.4515.6414.5617.9219.2317.6015.6817.29
Enterprise Value to EBITDA (EV/EBITDA)15.7565.2570.0063.8481.5298.9784.7175.1179.42
Debt to Equity Ratio2.690.790.790.790.790.790.780.761.08

CWST Growth Runway Model

Standard long term linear growth fade

Multi-Stage Discounted Cash Flow Sandbox

Market Price$85.90
Intrinsic Value$117.44
Market Alignment
Undervalued by 36.7%relative to calculated intrinsic value
9.00%
Exp: 16%16%
i

Growth runway slowdown

This value provides a time window for the growth rate to decline beyond Stage 1 toward the terminal rate. Longer windows are most useful for companies with high growth starting conditions or strong competitive advantages. This option stretches out the growth rate slowdown across 5, 10, or 15-year steps. A high-growth starting condition (exceeding a 25% initial growth rate) automatically applies a curve decay to simulate realistic, rapid market saturation.
i

Terminal growth rate

With long-term inflation between 3-5%, revenue must grow by that baseline to maintain flat real-world market share. This value sets the permanent terminal growth rate to factor into the valuation beyond the growth slowdown runway toward maturity.

3-Stage Financial Runway Horizon

🧠 Perpetuity Horizon Engine (Stage 3: Post-2035)

Terminal FCF Base$0.67B
Perpetuity TV Value$12.67B
Discounted TV (PV)$5.35B
TV Weighting %65.8%
⚠️
Financial Model Disclaimer & Risk Disclosure: This interactive scenario simulator is an educational sandbox provided strictly for informational and analytical research purposes. Core historical financial statements and consensus estimates are sourced directly via Financial Modeling Prep (FMP). All downstream outputs are entirely deterministic, hypothetical projections generated by combining automated mathematical formulas (including linear interpolation and Gaussian bell-curve decay models) with user-selected variables and third-party financial data inputs. Users assume all liability for trading decisions executed based on these sandbox calculations.

📘 Full Research Report

ℹ️

AI-Generated Research: This report is for informational purposes only.

📘 CASELLA WASTE SYSTEMS INC CLASS A (CWST) — Investment Overview

🧩 Business Model Overview

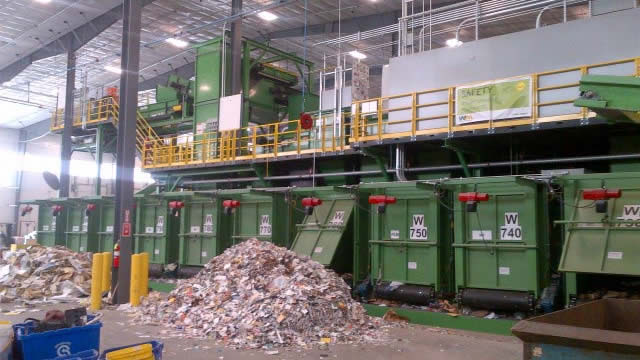
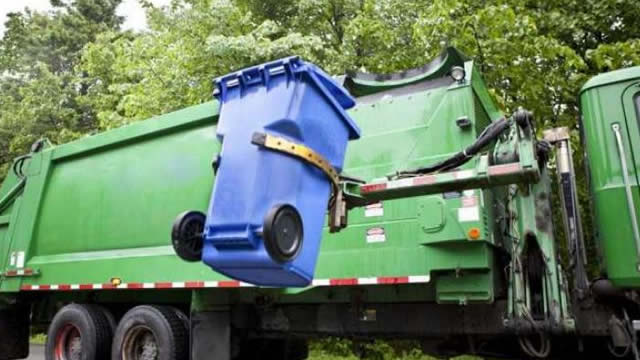
Casella Waste Systems operates in the vertically integrated solid-waste value chain: collection and transportation, transfer and processing, recycling/diversion activities, and disposal. Customers typically include municipalities and commercial accounts with recurring service needs. Waste is collected via route-based logistics, consolidated through transfer facilities, and ultimately processed or disposed through owned/controlled capacity (such as landfills or other permitted disposal endpoints) and/or contracted alternatives. This operating model converts local infrastructure ownership and route density into service reliability and cost efficiency, while creating stickiness through established schedules, service standards, and contract structures.

💰 Revenue Streams & Monetisation Model

Revenue is predominantly driven by volume-linked waste tonnage and service fees, with an important portion supported by recurring collection and contract pricing (municipal and commercial arrangements). Disposal-related revenue is typically monetised through tipping fees and related handling charges, while recycling/diversion revenue includes a combination of processing fees (often more stable than commodity pricing) and commodity-linked components for certain recovered materials.

Margin drivers generally include: (1) route density and freight efficiency (lower cost per ton), (2) utilisation of transfer and processing assets, (3) capacity and pricing discipline at disposal endpoints, and (4) commodity spread and contamination management in recycling streams. Where contracts include price adjustments or periodic renewals, monetisation can better track inflationary pressures in labor, fuel, and processing costs.

🧠 Competitive Advantages & Market Positioning

Casella’s competitive positioning is anchored in infrastructure-led and locally entrenched economics rather than a technology-first model. The primary moat is a combination of regulatory and infrastructure barriers plus switching costs.

  • Switching costs (customer stickiness): Collection services depend on established routes, equipment, safety procedures, and service reliability. Municipal and commercial customers face meaningful disruption costs when changing vendors (billing continuity, routing changes, service performance, and contract re-tendering timelines).
  • Regulatory moat (permitted capacity): Disposal and processing depend on permitting and environmental compliance requirements. Permitted sites and operating approvals create durable barriers to entry and can limit incremental competition.
  • Cost advantage from local logistics: Proximity between collection points and transfer/processing/disposal sites reduces haul distances, lowering variable cost per ton.

Competitive benchmarking: The most direct large-scale competitors include Waste Management and Republic Services, alongside GFL Environmental (where their regional footprints overlap). These rivals often compete on scale, asset breadth, and route networks. Casella’s emphasis on a more focused operating footprint can support strong local economics (utilisation, density, and service responsiveness) relative to national operators that must manage wider geographic dispersion.

🚀 Multi-Year Growth Drivers

Over a 5–10 year horizon, the fundamental drivers are largely structural and tied to waste generation and diversion policy:

  • Municipal and commercial demand resilience: Solid waste collection typically behaves as a defensive utility-like service with volume supported by population, economic activity, and long-lived service needs.
  • Price/mix and service indexation: Cost inflation in labor, energy, and transportation tends to support periodic tariff adjustments, contract escalators, and pricing discipline.
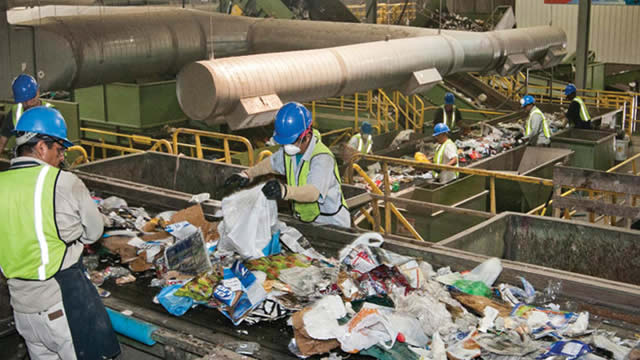
  • Diversion and recycling economics: Policy-driven diversion mandates and customer requirements can expand processing volumes for recycling and organics-related streams, while increasing the value of operational excellence (contamination reduction, yield optimization, and contract terms for recovered materials).
  • Capacity additions and asset optimisation: Controlled investment in transfer, processing, and disposal capacity can support utilisation and cost leadership, particularly when permitting timelines make capacity expansion challenging for new entrants.

Taken together, growth is less about disruptive market creation and more about sustaining market share in a local arena, improving cost per ton, and capturing value from permitted capacity and contracted service structures.

⚠ Risk Factors to Monitor

  • Regulatory and environmental liability: Landfill operations and disposal activities carry long-term compliance obligations and potential remediation risk.
  • Permitting and capacity constraints: Delays or restrictions in siting, expansions, or operating approvals can affect service levels and cost structure.
  • Recycling commodity and contamination risk: Recycling margins can be sensitive to commodity pricing and changes in end-market demand, while contamination can impair yields and increase disposal back-end costs.
  • Fuel, labor, and equipment cost volatility: Although some contracts may provide pass-through mechanisms, cost shocks can pressure margins between repricing events.
  • Capital intensity and project execution: Expanding or maintaining disposal/processing assets requires sustained capital and strong execution to protect returns.
  • Competitive responses: Large national players may leverage scale or bidding cycles to take share in overlapping territories, pressuring pricing in certain service lines.

📊 Valuation & Market View

The waste management sector is commonly valued using EV/EBITDA and earnings-based multiples, with a strong focus on cash generation quality. Investors typically underwrite:

  • Same/underlying volume trends (or tonnage stability) and pricing power
  • Operating margin durability through utilisation and routing efficiency
  • Capex intensity and the ability to fund growth while maintaining asset lifecycle performance
  • Recycling exposure (net of commodity volatility) and the stability of processing margins
  • Environmental and regulatory risk visibility and provisioning discipline

Multiple expansion typically requires evidence of stable pricing discipline, improved cost structure, and credible capacity/asset planning that supports conversion of EBITDA into resilient free cash flow.

🔍 Investment Takeaway

Casella’s long-term investment case rests on local infrastructure economics and durable barriers: customer switching costs from service entrenchment, regulatory constraints that limit new disposal/processing supply, and logistic cost advantages from operating footprint density. With waste volumes tied to durable end demand and with diversification/diversion trends supporting incremental processing needs, the company’s value creation is most plausibly driven by utilisation, pricing discipline, and operational execution rather than disruptive technology.


⚠ AI-generated — informational only. Validate using filings before investing.

📰 Market News & Coverage

15 Stories Available

Real-time institutional reporting and market updates for CWST.

globenewswire.com2026-05-27

Casella Waste Systems, Inc. Announces Pricing of Remarketed New York State Environmental Facilities Corporation Solid Waste Disposal Revenue Bonds

RUTLAND, Vt. , May 27, 2026 (GLOBE NEWSWIRE) -- Casella Waste Systems, Inc. ("Casella") (NASDAQ: CWST), a regional solid waste, recycling and resource management services company, today announced that it has priced the previously announced remarketing of $15. 0 million aggregate principal amount of New York State Environmental Facilities Corporation (the "Issuer") Solid Waste Disposal Revenue Bonds (Casella Waste Systems, Inc.

globenewswire.com2026-05-27

Casella Waste Systems, Inc. Announces Pricing of Remarketed New York State Environmental Facilities Corporation Solid Waste Disposal Revenue Bonds

RUTLAND, Vt., May 27, 2026 (GLOBE NEWSWIRE) -- Casella Waste Systems, Inc. (“Casella”) (NASDAQ:CWST), a regional solid waste, recycling and resource management services company, today announced that it has priced the previously announced remarketing of $15.0 million aggregate principal amount of New York State Environmental Facilities Corporation (the “Issuer”) Solid Waste Disposal Revenue Bonds (Casella Waste Systems, Inc. Project) Series 2014R-2 (collectively, the “Bonds”). The Bonds were issued pursuant to an Indenture dated December 1, 2014 (the “Indenture”) and drawn down on June 2, 2016. The Bonds have a final maturity date of December 1, 2044.

globenewswire.com2026-05-18

Casella Waste Systems, Inc. to Present at Upcoming Investor Conferences

RUTLAND, Vt., May 18, 2026 (GLOBE NEWSWIRE) -- Casella Waste Systems, Inc. (Nasdaq: CWST), a regional solid waste, recycling, and resource management services company, announced today that the company's management will be participating at the following investor conferences:

globenewswire.com2026-05-14

Casella Waste Systems and Waga Energy Unveil RNG Facility at Ribbon Cutting

RUTLAND, Vt., May 14, 2026 (GLOBE NEWSWIRE) -- Casella Waste Systems, Inc. (NASDAQ: CWST), a regional solid waste, recycling and resource management services company in the Eastern United States, and Waga Energy (EPA: WAGA), a global expert in the production of Renewable Natural Gas (RNG) from landfills, held a ribbon-cutting ceremony on May 14, 2026, to celebrate the opening of the RNG production facility at the Chemung County Landfill in Elmira, New York.

globenewswire.com2026-05-11

Casella Waste Systems, Inc. Announces Remarketing of New York State Environmental Facilities Corporation Solid Waste Disposal Revenue Bonds

RUTLAND, Vt., May 11, 2026 (GLOBE NEWSWIRE) -- Casella Waste Systems, Inc. (“Casella”) (NASDAQ:CWST), a regional solid waste, recycling and resource management services company, today announced that it has commenced the remarketing of $15.0 million aggregate principal amount of New York State Environmental Facilities Corporation (the “Issuer”) Solid Waste Disposal Revenue Bonds (Casella Waste Systems, Inc. Project) Series 2014R-2 (collectively, the “Bonds”). The Bonds were issued pursuant to an Indenture dated as of December 1, 2014 (the “Indenture”) and drawn down on June 2, 2016. The Bonds have a final maturity date of December 1, 2044.

seekingalpha.com2026-05-02

Casella Waste Systems Deserves A Bullish Outlook After A Nice Increase In Guidance

Casella Waste Systems delivered strong Q1 FY2026 results, with revenue up 9.6% to $457.3 million and adjusted EPS beating expectations. Management raised FY2026 guidance: revenue is now $2.06–$2.08 billion and EBITDA is $473–$483 million, reflecting robust acquisition-driven growth. Acquisitions remain a key driver, with $150 million in annualized revenue added so far in 2026, including the significant Star Waste Systems purchase.

seekingalpha.com2026-05-01

Casella Waste Systems, Inc. (CWST) Q1 2026 Earnings Call Transcript

Casella Waste Systems, Inc. (CWST) Q1 2026 Earnings Call Transcript

zacks.com2026-04-30

Casella (CWST) Tops Q1 Earnings Estimates

Casella (CWST) came out with quarterly earnings of $0.2 per share, beating the Zacks Consensus Estimate of $0.1 per share. This compares to earnings of $0.19 per share a year ago.

globenewswire.com2026-04-30

Casella Waste Systems, Inc. Announces First Quarter 2026 Results; Updates Fiscal Year 2026 Guidance

Strategic Acquisitions and Steady First Quarter Execution Set the Table for a Strong Year of Performance Strategic Acquisitions and Steady First Quarter Execution Set the Table for a Strong Year of Performance

seekingalpha.com2026-04-27

Conestoga Capital SMid Cap Composite Q1 2026 Portfolio Holdings

The Conestoga SMid Cap Composite returned -10.24% net-of-fees in the first quarter, lagging the Russell 2500 Growth Index's return of -3.52%. RBC's performance was driven by continued strength in aerospace and defense, where demand remains robust and increasingly visible through a growing backlog. Despite a solid quarter, Repligen stock underperformed as investors focused on a more measured outlook and lingering concerns around end-market demand.

defenseworld.net2026-04-27

Casella Waste Systems, Inc. $CWST Shares Sold by Comerica Bank

Comerica Bank trimmed its position in shares of Casella Waste Systems, Inc. (NASDAQ: CWST) by 33.1% during the fourth quarter, according to the company in its most recent Form 13F filing with the Securities and Exchange Commission. The firm owned 368,287 shares of the industrial products company's stock after selling 182,270 shares during

zacks.com2026-04-23

Casella (CWST) Expected to Beat Earnings Estimates: What to Know Ahead of Q1 Release

Casella (CWST) possesses the right combination of the two key ingredients for a likely earnings beat in its upcoming report. Get prepared with the key expectations.

zacks.com2026-04-16

Why Casella (CWST) is Poised to Beat Earnings Estimates Again

Casella (CWST) has an impressive earnings surprise history and currently possesses the right combination of the two key ingredients for a likely beat in its next quarterly report.

globenewswire.com2026-04-07

Casella Waste Systems, Inc. to Host Conference Call on Its First Quarter 2026 Results

RUTLAND, Vt., April 07, 2026 (GLOBE NEWSWIRE) -- Casella Waste Systems, Inc. (Nasdaq: CWST), a regional solid waste, recycling, and resource management services company, will release its financial results for the three months ended March 31, 2026, after the market closes on Thursday, April 30, 2026.

defenseworld.net2026-04-05

Casella Waste Systems, Inc. $CWST Shares Bought by SG Americas Securities LLC

SG Americas Securities LLC increased its holdings in Casella Waste Systems, Inc. (NASDAQ: CWST) by 103.4% during the fourth quarter, according to its most recent filing with the Securities and Exchange Commission (SEC). The institutional investor owned 24,268 shares of the industrial products company's stock after purchasing an additional 12,334 shares during the

📊 AI Financial Analysis

Powered by StockMarketInfo
Earnings Data: Q Ending 2026-03-31

"CWST reported Q1 2026 revenue of $457.3M and EPS of -$0.09, with net income of -$5.5M. On a YoY basis (vs. Q1 2025), revenue increased to $457.3M from $417.1M (+9.6%), while net income remained negative and deteriorated from -$4.8M to -$5.5M (net income ~-15.2% worsening). QoQ (vs. Q4 2025), revenue declined from $469.1M to $457.3M (-2.4%), and net income also worsened from -$2.5M to -$5.5M. Profitability was pressured in the latest quarter: operating margin fell to ~1.1% from ~4.4% in Q4 2025 and net margin slipped to ~-1.2% (from ~-0.5% in Q4). Over the last four quarters, CWST moved between profitability (Q2/Q3 2025) and losses (Q1/Q4 2025 and Q1 2026), indicating margin volatility rather than a consistent recovery. Cash flow quality remains mixed. Q1 2026 generated $62.3M operating cash flow (FCF ~$12.7M) despite a net loss, helped by non-cash charges. However, cash declined sharply to $126.9M (from $216.9M at Q1 2025 peak) and the company’s interest coverage remains low (~0.35), highlighting sensitivity to earnings. Shareholder returns are currently weak: the stock is down -31.15% over the last year and has no dividend/buyback support indicated here. Overall, the valuation context looks demanding for a business with recent losses and variable margins."

Revenue Growth

Fair

YoY revenue rose +9.6% (Q1 2025: $417.1M to Q1 2026: $457.3M), but QoQ revenue fell -2.4% (Q4 2025: $469.1M to Q1 2026).

Profitability

Neutral

Margins contracted materially in Q1 2026: operating margin ~1.1% vs ~4.4% in Q4 2025; net margin ~-1.2%. Net income worsened QoQ (from -$2.5M to -$5.5M).

Cash Flow Quality

Fair

Despite a net loss, operating cash flow was positive ($62.3M) and free cash flow was positive (~$12.7M). However, cash balance has trended down over the year and interest coverage is weak.

Leverage & Balance Sheet

Neutral

Balance sheet size is large (total assets ~$3.27B), with equity stable around ~$1.57B, but leverage is meaningful (total debt ~$110.0M; interest coverage ~0.35). Liquidity is adequate (current ratio ~1.38) yet earnings sensitivity is high.

Shareholder Returns

Neutral

Total shareholder return appears negative: price is down -31.15% over 1Y. Dividend yield is 0 and buybacks are not shown in cash flow.

Analyst Sentiment & Valuation

Caution

Price target consensus suggests upside (current price $81.22 vs median target $117.5), but valuation multiples are elevated and latest profitability is negative, increasing execution risk.

Disclaimer:This analysis is AI-generated for informational purposes only. Accuracy is not guaranteed and this does not constitute financial advice.

Fundamentals Overview

Loading fundamentals overview...

CWST delivered a strong Q1 start with revenue up 9.6% to $457.3M and adjusted EBITDA up 12.3% to $97.1M, producing a 21.2% margin (+~50 bps YoY). The key quality driver was solid waste pricing (+5.1% overall) and complete fuel recovery via floating fees, offsetting higher fuel costs. Margins expanded 65 bps in the base business, though acquisitions diluted ~15 bps due to lower initial margins—reinforcing management’s view that integration should be a “regenerative” uplift over time. Guidance was raised for 2026 to $2.06B–$2.08B revenue, $473M–$483M adjusted EBITDA, and $200M–$210M adjusted free cash flow, supported by assumed ~20% EBITDA margin and higher revenue from acquisitions closed to date. In Q&A, analysts focused on: sustainability of above-normal base margin expansion (Mid-Atlantic/G&A scaling), how Ontario’s 2028 closure could be EBITDA-neutral through volume shifts, and the still-evolving RNG ramp timing across partner-operated projects.

AI IconGrowth Catalysts

  • Solid waste pricing up 5.1% overall (5.3% collection, 4.7% disposal) supporting margin expansion
  • Resource Solutions momentum led by national accounts up 20.7% with 11.2% national accounts volume growth and 4.4% price
  • C&D volume strength: C&D landfill tons up 13% YoY, supporting landfill throughput despite winter weather
  • Spring volume recovery signals: positive trends through April and anticipation of seasonal upswing
  • Rail/disposal capacity enhancement: completed McKean rail transfer station allowing acceptance from gondolas/intermodal containers; enables internalized MSW from Massachusetts later in 2026

Business Development

  • Star Waste acquisition closed April 1, 2026 (~$100M annualized revenue) with integration focus and retrofit already completed by prior owner Clairvest
  • Completed four acquisitions YTD 2026 totaling ~$150M annualized revenue
  • National accounts program: growth serviced by Casella trucks (intercompany) increasing share of wallet within collection
  • Landfill gas/RNG partner projects: RKMBP (Juniper Ridge, Maine), Viridi (North Country, New Hampshire), Waga (Chemung and Hyland landfills; projects came online in Q1)

AI IconFinancial Highlights

  • Revenues: $457.3M, +9.6% YoY (+$40.2M total; $23.9M acquisitions, $16.2M same-store at +3.9%)
  • Adjusted EBITDA: $97.1M, +12.3% YoY; contribution from acquisitions $4.4M with >7% organic growth
  • Adjusted EBITDA margin: 21.2%, up ~50 bps YoY; base business same-store margin expansion +65 bps while acquisitions diluted ~15 bps
  • Quarterly margin expansion exceeded budget: delivered 50 bps of margin expansion in the quarter
  • EPS: Adjusted net income $12.8M or $0.20/diluted share (+$0.01 per share YoY); GAAP net income down $0.7M due to acquisition expenses and organics facility closure costs
  • Fuel risk: floating fuel recovery fees fully offset higher fuel costs in the quarter
  • Adjusted free cash flow: $30.7M, +5% YoY
  • Fuel/commodity pressures: average recycled commodity revenue/ton -22% YoY, but contract structures reduced net revenue impact to ~+$1M due to risk-sharing (floating SRA fee)
  • Solid waste price/yield detail: collection line price +5.3% (6.5% roll-off, 6.0% front-load commercial); disposal price +4.7% (4.3% third-party landfills)
  • Guidance update for 2026 (reflecting acquisitions closed to date): Revenue $2.06B–$2.08B (+$90M), Adj. EBITDA $473M–$483M (+$18M), Adj. free cash flow $200M–$210M (+$5M); assumes ~20% Adj. EBITDA margin

AI IconCapital Funding

  • Cash and leverage: $1.16B debt and $127M cash at March 31; bank net leverage ratio 2.29x
  • Pro forma leverage (Star Waste April 1 included): ~2.75x
  • Available liquidity: ~$500M for opportunistic acquisitions
  • No buyback details in provided transcript
  • Capex: $50M in Q1 (down $5.5M YoY) with $9.2M upfront investment in recent acquisitions

AI IconStrategy & Ops

  • Automation/efficiency: route optimization, fleet efficiency, and automation translating into margin outperformance
  • Safety technology: expanded Triage programs; implemented Lytx in-cab AI across entire fleet in 2026
  • Safety metric improvement: TRIR improving 20% YoY
  • Systems integration: migrated nearly all Mid-Atlantic customers to new lead-to-cash system; integrated customer payment portal; remaining migration expected to complete by end of next week
  • Operating cost actions: on track to cut $5M operating costs in 2026 and another $10M over next 2 years
  • G&A reduction plan: $15M targeted G&A savings over 3 years (credit card convenience fees in 2H26; eliminate redundant system costs in 2027; automate back-office functions in 2027–2028)
  • Technology/customer platforms: new payment portal launched last month; Casella app rollout planned in Q2; ongoing e-commerce development
  • Permitting milestones: Hakes permit expected Q3 2026; Hyland permit expected Q1 2027; Hyland annual permit more than doubled from 460k tons to 1M tons and add 60 years of capacity; Hakes C&D landfill expansion is 10+ years
  • Organics facility closure noted as causing GAAP net income headwind in the quarter

AI IconMarket Outlook

  • Q1 volume slightly negative YoY due to challenging winter weather; landfill tons up YoY including MSW and C&D (C&D +13%)
  • Positive trends through April; positioned for spring seasonal volume upswing
  • 2026 solid waste landfill third-party pricing guidance: 4%–5% YoY improved expectation; consistent with ~5% price growth overall in solid waste
  • Q1 acquisition-related guidance revision: adjusted EBITDA margins ~20% assumed; adjusted free cash flow guidance assumes typical conversion reflecting incremental net interest costs (transactions financed with cash + revolver)
  • Landfill closures: Ontario planned close December 31, 2028

AI IconRisks & Headwinds

  • Challenging winter weather caused slightly negative volumes in the quarter despite improved landfill tons YoY
  • Recycling commodity pricing pressure: average recycled commodity revenue per ton -22% YoY (market stabilized; negative comparisons expected to moderate)
  • Landfill gas/RNG ramp uncertainty: Waga projects in shakedown stage; early production levels not yet determinative; broad range of outcomes
  • Margin overhang risk from acquisition integration timing: management referenced inability to fully underwrite Star Waste process/customer wrap until day 1 and expected ~20% margin starting point with improvement
  • Potential volume/market pressure from Northeast rail moves: NJ-to-Ohio rerouting pressure referenced as contributing to Northeastern environment softness (rail move now full)
  • Operating cost dilution risk from integrating acquisitions at initially lower margins (acquisitions diluted margin ~15 bps in the quarter)

Q&A: Analyst Interest

  • Margin trajectory: Management was asked whether the company should expect “outsized” margin expansion. Brad said they generally target ~50 bps recurring base-business margin expansion over time. He cited pent-up Mid-Atlantic synergy opportunity and delayed G&A scaling as a reason to expect above-brand improvement over 2–3 years.
  • Ontario landfill closure mechanics: Analysts asked how an Ontario closure could be EBITDA-neutral. Management planned closure on Dec. 31, 2028 and emphasized permitted New York expansions (Hyland tonnage up to 1M tons). They will shift ~750k–800k tons historically going to Ontario into Hakes and increasingly Hyland; different operating costs drive neutrality.
  • Landfill gas/RNG ramp: Management was asked about the landfill gas program timing for a potential royalty stream. Ned explained they do not invest in RNG facilities themselves and rely on partners; results have been mixed and complex due to permit compliance. Four projects are online, several million dollars of EBITDA expected in 2026, but near-term output levels remain in shakedown.

Sentiment: POSITIVE

Note: This summary was synthesized by AI from the CWST Q1 2026 earnings transcript. Financial data is complex; please verify all metrics against official SEC filings before making investment decisions.

📋 Official Regulatory 10-K / 10-Q SEC Filings

Direct authenticated documentation links to audited SEC database reports for CWST.

SEC EDGAR Live Feed
Loading financial data and tables...
📁

SEC Filings (CWST)

© 2026 Stock Market Info — Casella Waste Systems, Inc. (CWST) Financial Profile