Healthpeak Properties, Inc.

Healthpeak Properties, Inc. (DOC) Market Cap

Healthpeak Properties, Inc. has a market capitalization of $13.64B.

Price: $19.79

0.19 (0.97%)

Market Cap: 13.64B

NYSE · time unavailable

CEO: Scott Brinker

Sector: Real Estate

Industry: REIT - Healthcare Facilities

IPO Date: 1985-05-23

Website: https://www.healthpeak.com

Healthpeak Properties, Inc. (DOC) - Company Information

Market Cap: 13.64B|Sector: Real Estate

Company Profile

Healthpeak Properties, Inc. is a fully integrated real estate investment trust (REIT) and S&P 500 company. Healthpeak owns, operates, and develops high-quality real estate for healthcare discovery and delivery.

Analyst Sentiment

53%
Hold

From 20 Active Polls

1Y Forecast: $18.75

▼ -5.3% Potential Upside

Consensus Target Metrics

Low Bound

$17

Median

$19

High Bound

$21

Average

$19

Price & Moving Averages

Loading chart...

🎯 Wall Street Analyst Intelligence Report

1-Year structural target targets, chart projections, and sentiment maps.

Average 1Y Target
$18.75
▼ -5.26% Upside
Low Target
$17.00
-14% Risk
Median Target
$18.50
-7% Mid
High Target
$21.00
6% Max
Consensus
Buy
22 / 41 Buys

Consensus Trend Projection

Trailing closures vs. 12-month metrics map.

Analyst Vote Distribution

Aggregate institutional coverage sentiment weights.

📊 Historical Valuation Multiples

Real-time Trailing Twelve Month (TTM) momentum side-by-side with discrete quarterly metrics.

Fiscal QuarterTTMQ1 2026Q4 2025Q3 2025Q2 2025Q1 2025Q4 2024Q3 2024Q2 2024
Period EndingTrailing 12MMar 31, 2026Dec 31, 2025Sep 30, 2025Jun 30, 2025Mar 31, 2025Dec 31, 2024Sep 30, 2024Jun 30, 2024
Market Cap ($M)13,64411,42111,19213,33612,20714,13514,17815,99413,675
Enterprise Value ($M)23,18520,96321,09522,67821,46823,24823,08124,70522,485
Price to Earnings Ratio (P/E)61.9314.7524.55-28.4796.3582.51779.5246.5623.41
Price/Earnings-to-Growth Ratio (PEG)3.1612.81-17.15117.5166.191.60
Price to Sales Ratio (P/S)4.7515.1715.5618.8917.5820.1120.3122.8419.66
Price to Book Ratio (P/B)1.761.461.491.761.541.731.691.871.56
Price to Free Cash Flow Ratio (P/FCF)11.5448.2138.0646.3533.5850.5950.0150.2643.25
Enterprise Value to Sales (EV/Sales)27.8429.3232.1330.9233.0733.0735.2732.33
Enterprise Value to EBITDA (EV/EBITDA)12.9936.3449.9356.0956.4058.7867.5454.5843.76
Debt to Equity Ratio5.351.371.391.241.181.121.071.041.02

DOC Growth Runway Model

Standard long term linear growth fade

Multi-Stage Discounted Cash Flow Sandbox

Market Price$19.79
Intrinsic Value$16.49
Market Alignment
Overvalued by 16.7%relative to calculated intrinsic value
9.00%
Exp: -6%-6%
i

Growth runway slowdown

This value provides a time window for the growth rate to decline beyond Stage 1 toward the terminal rate. Longer windows are most useful for companies with high growth starting conditions or strong competitive advantages. This option stretches out the growth rate slowdown across 5, 10, or 15-year steps. A high-growth starting condition (exceeding a 25% initial growth rate) automatically applies a curve decay to simulate realistic, rapid market saturation.
i

Terminal growth rate

With long-term inflation between 3-5%, revenue must grow by that baseline to maintain flat real-world market share. This value sets the permanent terminal growth rate to factor into the valuation beyond the growth slowdown runway toward maturity.

3-Stage Financial Runway Horizon

🧠 Perpetuity Horizon Engine (Stage 3: Post-2035)

Terminal FCF Base$1.26B
Perpetuity TV Value$23.63B
Discounted TV (PV)$9.98B
TV Weighting %53.4%
⚠️
Financial Model Disclaimer & Risk Disclosure: This interactive scenario simulator is an educational sandbox provided strictly for informational and analytical research purposes. Core historical financial statements and consensus estimates are sourced directly via Financial Modeling Prep (FMP). All downstream outputs are entirely deterministic, hypothetical projections generated by combining automated mathematical formulas (including linear interpolation and Gaussian bell-curve decay models) with user-selected variables and third-party financial data inputs. Users assume all liability for trading decisions executed based on these sandbox calculations.

📘 Full Research Report

ℹ️

AI-Generated Research: This report is for informational purposes only.

📘 HEALTHPEAK PROPERTIES INC (DOC) — Investment Overview

🧩 Business Model Overview

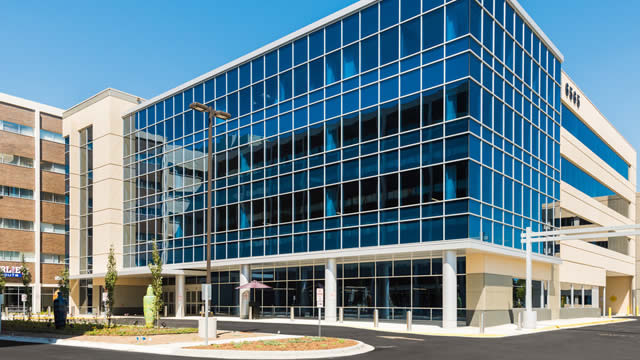
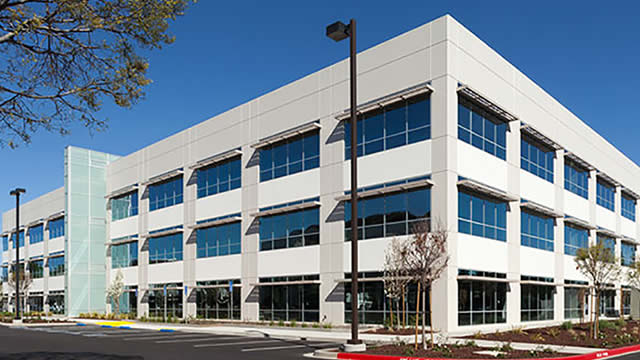
Healthpeak Properties is a healthcare real estate REIT focused primarily on two property types: (1) life science assets designed for research and lab use, and (2) medical office properties supporting clinical and outpatient services. The value chain centers on securing tenants (biopharma, research organizations, and healthcare providers), constructing or upgrading specialized space to meet regulatory and operational requirements, and then generating income through long-term operating leases.

A key structural feature of the model is tenant “fit.” Life science and medical tenants often require specialized mechanical systems, controlled environments, and compliance-ready building configurations. The leasing process frequently includes lease-up planning, build-to-suit / modernization investments, and coordinated permitting and build-out timelines—factors that translate into durable occupancy once space is operational.

💰 Revenue Streams & Monetisation Model

Income is primarily derived from base rent under operating leases, augmented by reimbursable recoveries (e.g., property taxes, insurance, and certain operating expenses) and contractual rent escalators. Monetisation is therefore more “annuity-like” than typical commercial real estate categories, with cash flow supported by contractual lease terms and cost pass-through mechanisms.

Margin drivers are less about rapid re-pricing and more about occupancy stability, leasing velocity across research/clinical cycles, and maintenance and capital discipline. For specialized space, the ability to preserve physical utility (modern HVAC, lab readiness, code compliance) supports lease renewals and mitigates downtime risk.

🧠 Competitive Advantages & Market Positioning

Healthpeak’s moats are rooted in high switching costs and location-based clustering that are particularly pronounced in healthcare real estate.

  • High Switching Costs (Tenant Fit + Infrastructure Spend): Life science users typically invest materially in lab equipment, utilities, and workflows that depend on building design and timing. Relocating is costly in both capital and operational continuity risk. This raises effective “stay” incentives once a facility is functional.
  • Integrated Ecosystems (Cluster Gravity): Research and clinical activities benefit from adjacency to scientific talent, suppliers, and complementary institutions. Properties located in established healthcare and innovation hubs face structurally lower friction in attracting tenants and sustaining demand.
  • Operational Expertise and Property Specialization: Building systems and layouts tailored to lab and medical use create advantages in tenant readiness, renewal negotiations, and modernization planning relative to generic office stock.

Competitive benchmarking:

  • Alexandria Real Estate (ALX): A more pronounced pure-play in life science/laboratory real estate. Healthpeak’s positioning differs by blending life science exposure with a meaningful medical office component, providing diversification across tenant types and sub-markets.
  • Medical Properties Trust (MPW): Focuses more heavily toward hospital/after-care and contract-based healthcare structures. Healthpeak’s moat is more tied to specialized space readiness and cluster dynamics for life science and outpatient medical uses.
  • Ventas (VTR): Greater emphasis on seniors housing and post-acute categories. Healthpeak’s competitive focus remains on real estate that supports active outpatient and research ecosystems, where tenant continuity is driven by built infrastructure and regulatory fit.

🚀 Multi-Year Growth Drivers

Over a 5–10 year horizon, Healthpeak’s growth case is supported by durable demand for healthcare-related space and the continued sophistication of tenant requirements.

  • Life Science Capacity Needs: Outsourced research, increased lab intensity per therapeutic program, and sustained R&D capital commitments support ongoing demand for functional lab space in key innovation regions.
  • Medical Outpatient and Specialty Delivery: Aging demographics and the continued shift toward outpatient and specialty care expand the need for clinically suitable real estate with dependable operating systems.
  • Redevelopment and Modernisation-Led Leasing: Upgrades that improve lab readiness or clinical utility can support renewal economics and re-tenanting outcomes, particularly when supply in specific sub-markets is constrained by planning, permitting, and construction lead times.
  • Tenant Retention Through Operational Continuity: Because relocation is costly for lab and medical operators, stable lease rollovers can translate into compounding occupancy quality even through business cycle variability.

⚠ Risk Factors to Monitor

  • Capital Markets and Interest Rate Sensitivity: REIT valuation and refinancing conditions can tighten during higher-rate periods, affecting leverage strategy, cost of capital, and acquisition/disposition appetite.
  • Tenant Credit and Lease-Up Timing: Economic stress can impair tenant formation or rent-paying capacity, especially when lease expirations coincide with weaker hiring or funding cycles for research tenants.
  • Development/Modernisation Execution Risk: Lab and medical upgrades can face cost overruns, supply-chain constraints, and schedule risk, potentially compressing returns.
  • Concentration Risk in Sub-markets: Cluster-based strategies can heighten exposure to localized economic or regulatory dynamics affecting life science activity.
  • Structural Supply in Prime Locations: If competing projects come online faster than tenant demand growth, leasing concessions and slower absorption can pressure cash flows.

📊 Valuation & Market View

Healthcare REITs typically trade on cash-flow fundamentals rather than traditional earnings multiples. The market often emphasizes FFO / AFFO-related metrics, lease contract characteristics (durability, escalators, and occupancy), and NAV frameworks that reflect property-level capitalization rates.

Key value drivers generally include:

  • Interest rate and cap rate expectations (valuation sensitivity)
  • Same-store occupancy and rent growth quality
  • Rent collection and credit performance
  • Capital allocation discipline (development returns, redevelopment timing, and balance sheet leverage)
  • Stability of lease expirations and renewal prospects in specialized space

🔍 Investment Takeaway

Healthpeak’s long-term appeal rests on structural tenant stickiness in healthcare real estate—particularly high switching costs for life science users and cluster-based demand that supports resilience in occupancy. The business model converts specialized property utility into recurring lease revenue, while growth is anchored in sustained demand for lab-ready space and outpatient medical delivery. The primary debate for investors centers on refinancing conditions, tenant credit durability, and the pace of supply versus absorption in key innovation and healthcare corridors.


⚠ AI-generated — informational only. Validate using filings before investing.

📰 Market News & Coverage

15 Stories Available

Real-time institutional reporting and market updates for DOC.

zacks.com2026-06-04

Healthpeak (DOC) Down 2.2% Since Last Earnings Report: Can It Rebound?

Healthpeak (DOC) reported earnings 30 days ago. What's next for the stock?

reuters.com2026-05-28

EU clears Arla's DMK, DOC buyout, citing no competition concerns

The European Union on ​Thursday approved Arla ‌Foods' acquisition of Germany's DMK and ​Dutch cooperative ​DOC without conditions, saying ⁠the deal ​would not harm competition ​in the European Economic Area.

zacks.com2026-05-26

Healthpeak Properties Gains 22.7% Year to Date: Will the Trend Last?

DOC gains 22.7% year-to-date, driven by leasing momentum, rising occupancy and Janus Living growth.

investors.com2026-05-14

This Healthcare REIT Stands Out With 6.3% Yield

With a 6.3% yield, REIT stock HealthPeak Properties is among the highest-paying players in the S&P 500, well above the current 1% average.

seekingalpha.com2026-05-14

Healthpeak Properties: A Healthy Balance Sheet And Growth Opportunities Outweigh Risk Concerns

Healthpeak Properties earns a buy rating, driven by strong capital allocation and a compelling portfolio mix across Outpatient Medical, Labs, and Senior Housing. DOC trades at ~11x P/FFO with a >6% dividend yield, offering both stability and upside from secular and cyclical trends in its segments. Recent moves—like the Janus Living IPO, opportunistic acquisitions, and disciplined share buybacks—unlock value and enhance capital efficiency.

seekingalpha.com2026-05-12

Healthpeak Properties: Lab Weakness Creates A Major Re-Rating Opportunity

Healthpeak Properties is still a Buy after the recent rally, supported by strong earnings, a robust dividend, and significant re-rating potential. DOC's Q1 2026 beat on FFO and revenue; completed the Janus Living IPO; and executed major acquisitions, reinforcing portfolio value and future growth prospects. With $1.17 billion in cash and a sustainable 6.2% monthly dividend yield (~70.7% payout ratio), DOC's dividend looks safe despite macroeconomic headwinds, leaving room for more buybacks.

247wallst.com2026-05-11

Here Are Monday’s Top Wall Street Analyst Research Calls: Dell Technologies, BioMarin Pharmaceutical, Disney, HubSpot, Klarna, Oklo, Pitney Bowes, Trade Desk, Wendy’s, and More

Pre-Market Stock Futures: Futures are trading mixed as we get set to start the new trading week, as reports indicate that President Trump declined Iran's counteroffer for peace. This comes after a remarkable Friday, when stocks roared to record highs, driven primarily by a stronger-than-expected April jobs report that eased economic concerns and by a... Here Are Monday's Top Wall Street Analyst Research Calls: Dell Technologies, BioMarin Pharmaceutical, Disney, HubSpot, Klarna, Oklo, Pitney Bowes, Trade Desk, Wendy's, and More

seekingalpha.com2026-05-10

The Overlooked Trend That Could Supercharge REIT Dividends

REITs are undervalued and out-of-favor compared to AI-driven tech stocks, creating a contrarian opportunity. Rising construction costs are constraining new supply, increasing the value and pricing power of existing REIT portfolios. Multiple REITs, including AH REALTY TRUST, Chiron Real Estate, Piedmont Realty Trust, and Healthpeak Properties, report higher replacement costs and favorable re-leasing spreads.

marketbeat.com2026-05-09

Healthpeak Properties Q1 Earnings Call Highlights

Healthpeak Properties NYSE: DOC reported first-quarter 2026 adjusted funds from operations of $0.45 per share and raised its full-year FFO adjusted guidance after completing several major capital allocation moves, including the IPO of its senior housing business, a joint venture recapitalization with Blackstone and a $100 million stock repurchase.

seekingalpha.com2026-05-06

Healthpeak Properties, Inc. (DOC) Q1 2026 Earnings Call Transcript

Healthpeak Properties, Inc. (DOC) Q1 2026 Earnings Call Transcript

zacks.com2026-05-06

Healthpeak Properties Q1 FFOA Tops Estimates on Steady Leasing Momentum

DOC beats Q1 FFOA estimates as leasing stays strong and Janus Living IPO boosts growth, prompting a higher 2026 outlook.

zacks.com2026-05-05

Healthpeak (DOC) Q1 FFO and Revenues Surpass Estimates

Healthpeak (DOC) came out with quarterly funds from operations (FFO) of $0.45 per share, beating the Zacks Consensus Estimate of $0.43 per share. This compares to FFO of $0.46 per share a year ago.

businesswire.com2026-05-05

Healthpeak Properties Raises 2026 Earnings Guidance Following Completion of the Janus Living IPO, Accretive Capital Allocation, and Strong First Quarter 2026 Results

DENVER--(BUSINESS WIRE)--Healthpeak Properties, Inc. (NYSE: DOC), a leading owner, operator, and developer of real estate for healthcare discovery and delivery, today announced results for the quarter ended March 31, 2026. FIRST QUARTER 2026 FINANCIAL PERFORMANCE AND RECENT HIGHLIGHTS Net income of $0.28 per share, Nareit FFO of $0.42 per share, and FFO as Adjusted of $0.45 per share In March 2026, Janus Living, Inc. (NYSE: JAN) ("Janus Living") completed its initial public offering ("IPO") at.

zacks.com2026-05-04

What's in the Cards for Healthpeak Properties This Earnings Season?

DOC heads into Q1 earnings with revenues and FFO per share expected to dip as higher interest expenses and competition weigh.

fool.com2026-04-29

3 Healthcare Stocks Paying the Highest Dividends in the Sector Right Now

Perrigo sports a forward dividend yield nearing 10%, but this high yield is highly reflective of high uncertainty over the company's future performance. Despite a mixed dividend growth track record, an ongoing catalyst may make Healthpeak Properties appealing to investors focused on capital growth.

📊 AI Financial Analysis

Powered by StockMarketInfo
Earnings Data: Q Ending 2026-03-31

"DOC reported Q1 2026 revenue of $752.9M, up +7.2% YoY (vs. $702.9M in Q1 2025) and +4.6% QoQ (vs. $719.4M in Q4 2025). Net income was $193.6M, a strong +352.9% YoY (vs. $42.8M in Q1 2025) and +70.0% QoQ (vs. $113.97M in Q4 2025). EPS rose to $0.28 from $0.06 in Q1 2025 and $0.16 in Q4 2025. Profitability improved meaningfully: gross margin increased to 53.8% from 61.1% in Q1 2025 (still elevated vs. Q4 2025’s negative gross margin) while operating income surged to $5.6M from $145.8M in Q4 2025, and net margin expanded to 25.7% from 6.1% in Q1 2025—reflecting a substantial improvement at the bottom line. Cash flow metrics provided are not complete in Q1 2026 (operating/free cash flow fields are zero), so cash-flow quality assessment is constrained. Balance sheet resilience improved sharply: cash and equivalents increased to $1.17B from $0.54B in Q4 2025, while total assets rose to $21.6B. Total shareholder returns appear mixed: price is $17.37 with -6.5% over the last 1 year; dividend yield is ~1.9%, with no buyback data in the provided quarter. Valuation context looks moderately supported by consensus target (~$17.86) versus current price."

Revenue Growth

Positive

Revenue grew +7.2% YoY to $752.9M and +4.6% QoQ vs. Q4’25.

Profitability

Neutral

Net income rose +352.9% YoY and +70.0% QoQ; net margin expanded to 25.7%. However, operating income was much lower QoQ ($5.6M vs. $145.8M), suggesting bottom-line strength not fully mirrored in operating results.

Cash Flow Quality

Neutral

Q1 2026 cash flow line items are shown as zero/blank, limiting assessment. Prior quarters showed positive operating cash flow, but current-quarter quality cannot be validated.

Leverage & Balance Sheet

Positive

Major increase in liquidity: cash and equivalents rose to $1.17B (from $0.54B in Q4’25). Total assets increased to $21.6B; equity remains substantial ($9.03B).

Shareholder Returns

Caution

1Y price change is -6.5% (weak momentum). Dividend yield is ~1.9%; no buybacks indicated in the provided Q1 2026 data.

Analyst Sentiment & Valuation

Neutral

Consensus target ($17.86) is modestly above the current price ($17.37), implying limited upside; high price momentum is not present.

Disclaimer:This analysis is AI-generated for informational purposes only. Accuracy is not guaranteed and this does not constitute financial advice.

Fundamentals Overview

Loading fundamentals overview...

So What? Q1 2026 shows Healthpeak (Life Science + Outpatient + Senior Housing) delivering operating momentum and capital recycling that management frames as multiple-arbitrage. Outpatient Medical continues to demonstrate durable leasing economics (positive cash re-leasing spreads ~+5.4% in the quarter and +5.8% since the merger, modest TI, ~3% escalators) with 91% total occupancy and strong retention. Life Science occupancy is rising toward a quantified target: year-end 2026 total occupancy at least +100 bps vs year-end 2025, supported by an expiration/commencement offset framework, though cadence is explicitly non-linear and known midyear vacate risk exists (~50k sf; two tenants). Senior Housing/Janus Living remains the key financial lever: IPO is expected to be earnings-neutral in 2026, with accretion emerging in 2027+, and management points to ~$0.04 per-share run-rate contribution as $750M deployment through year-end stabilizes. Guidance lifted only $0.01 despite higher interest and G&A, implying offsetting quality rather than broad-based margin expansion.

AI IconGrowth Catalysts

  • Outpatient Medical: 5.4% cash re-leasing spreads on renewals; 79% tenant retention; 91% total occupancy; 3% escalators on new leases and renewals sustained for ~5 years
  • Outpatient Outperformance: >10 million sq ft of renewals since merger closure with positive cash re-leasing spreads averaging +5.8% (and +5.4% last quarter) with modest TIs
  • Life Science: total occupancy up to 77.7%; expectation for year-end 2026 total occupancy to increase by at least +100 bps vs year-end 2025
  • Gateway campus: 62,000 sq ft signed leases + LOIs; 113,000 sq ft active proposals and tours; incremental lease-up momentum beyond underwriting (limited lease-up assumed in Year 1)
  • Janus Living / Senior Housing: 1Q entry fees at all-time high for the quarter; strong operating momentum driving earnings outperformance

Business Development

  • Blackstone outpatient medical joint venture recap: fully occupied outpatient portfolio at 6.1% cash cap rate; $170 million proceeds; 20% interest by Healthpeak (platform template for future recaps/acquisitions)
  • Named life science / outpatient medical tenant relationships cited: Baylor Scott & White, Norton Health, HCA; Baylor cancer center (Dallas) 10-year renewals across a 458,000 sq ft campus; direct negotiations with Baylor and McKesson
  • Life science market activity referenced broadly across SF Bay Area, San Diego, Greater Boston; new leadership hired in life science: Denis Sullivan (former CIO/CFO of BioMed)

AI IconFinancial Highlights

  • FFO (adjusted) of $0.45 per share in Q1; net debt-to-EBITDA of 5.4x
  • Full-year FFO as adjusted guidance raised by $0.01 to $1.71–$1.75 per share; same-store NOI guidance flat
  • Guidance moving parts: interest expense expected +$20 million higher and G&A +$5 million higher, offset by Janus Living IPO success and $0.04 per-share acquisition deployment accretion (run-rate) as capital stabilizes
  • Janus Living IPO accounting: 2026 expected earnings neutrality to Healthpeak; accretive to 2027+; IPO-related earnings drag expected offset by senior housing outperformance and $750 million deployment into acquisitions through year-end
  • Leasing economics (Outpatient Medical): renewals cash re-leasing spreads +5.4% (quarter) vs prior +5.4% last quarter; longer-term: +5.8% renewals since merger close; average annual escalators ~3%
  • Life science (Lab): cash re-leasing spreads ~5% over last 12 months; 3.5% this quarter; lab total occupancy 77.7% at quarter end

AI IconCapital Funding

  • Stock buyback: $100 million in April at implied FFO yield >10%; described as accretive and supports raising 2026 guidance
  • Dividends: paid more than $200 million in Q1 (7.5% annualized dividend yield stated)
  • Senior housing balance sheet actions: repaid $103 million of secured mortgages on 2 properties in January
  • Term loan: $400 million new senior unsecured delayed draw term loan closed in March; remains undrawn; draw availability through Dec 2026
  • Refinancing: $650 million of senior notes due/refinance in June referenced as a 2H headwind (not quantified in basis points)
  • Capital deployment: $714 million of acquisitions invested on balance sheet in Q1 ahead of Janus Living IPO; total deployment target $750 million through year-end; proceeds from seller financing/recaps already receiving $270 million (per guidance discussion)

AI IconStrategy & Ops

  • Capital recycling and multiple-arbitrage strategy: completed IPO for Janus Living while timing balance-sheet acquisitions prior to IPO to keep Healthpeak exposure roughly unchanged vs Dec 31 despite selling ~18% of business in the IPO
  • Leverage-neutral repurchase posture: continued evaluation of buybacks to drive earnings/value accretion while maintaining leverage discipline
  • In-house leasing execution: half of outpatient renewals completed in-house, saving $5 million in leasing commissions in the prior quarter
  • Life science occupancy drive: focus on total occupancy/net absorption vs quarter-to-quarter cadence precision; leveraging pipeline conversion from signed but not occupied leases and move-in-ready options
  • Development permitting milestone: Alewife mixed-use project received preliminary planning board initial approval (entitlements path), with Hines partnering for multifamily portion

AI IconMarket Outlook

  • Life science: expect year-end 2026 total occupancy up at least +100 bps vs year-end 2025
  • Lab occupancy mechanics: 2026 expirations ~400,000 sq ft; commencements just over 0.5 million sq ft (fully offset); known exits ~50,000 sq ft in 2Q–3Q with 2 potential tenants vacating midyear
  • Guidance: raised FY FFO as adjusted by $0.01 to $1.71–$1.75 per share; same-store NOI flat; continued 2026 outlook assumes IPO neutrality in 2026 and accretion starting 2027+

AI IconRisks & Headwinds

  • Life science supply-demand still in “long pendulum” downturn recovery; occupancy declines are less severe for peers but overall cycle remains fragile
  • Competition: management cited “a few really strong competitors” that capture most tenant demand; continued competitive pressure risk to lease-up timing and spread durability
  • Known lab risk of downward rent pressure: acknowledged that other peers are guiding ugly re-leasing spreads; management focus is all-in economics, but near-term downward pressure remains a sector risk
  • Refinancing/interest rate risk: $650 million senior notes refinancing in June expected to be an additional headwind in 2H (along with +$20 million higher interest expense in guidance walk)
  • Cadence uncertainty: management would not provide precise quarter-over-quarter occupancy cadence; potential for occupancy progress to be non-linear

Q&A: Analyst Interest

  • Life science investment timing: analysts asked whether the improved pipeline/tenant activity has shifted opportunistic capex timing. Management said Gateway was already ahead of underwriting and that while opportunity is plentiful, their threshold is high; they must complete ~$1B recaps/sales and ~$1B acquisitions before pursuing opportunistic life science investments.
  • Lab occupancy path: analysts sought what drives the +100 bps year-end goal and whether there will be midyear known vacates impacting same-store. Management broke out 2026 expirations (~400k sf) versus commencements (>0.5M sf) offset, noted ~50k sf expected exits in 2Q–3Q with two tenant vacates, and emphasized year-end total occupancy over precise quarterly cadence.
  • Guidance raise mechanics: analysts asked why FY FFO guidance rose only $0.01 while interest expense and G&A increased. Management attributed the small raise to Janus Living IPO outperformance offsetting transaction impact in 2026 plus ~$0.04 per share run-rate accretion as cash is deployed; they also noted Q1 elevation from on-balance-sheet acquisitions, with a back-half normalization and 2H refinancing headwind.

Sentiment: POSITIVE

Note: This summary was synthesized by AI from the DOC Q1 2026 earnings transcript. Financial data is complex; please verify all metrics against official SEC filings before making investment decisions.

📋 Official Regulatory 10-K / 10-Q SEC Filings

Direct authenticated documentation links to audited SEC database reports for DOC.

SEC EDGAR Live Feed
Loading financial data and tables...
📁

SEC Filings (DOC)

© 2026 Stock Market Info — Healthpeak Properties, Inc. (DOC) Financial Profile