Gencor Industries, Inc.

Gencor Industries, Inc. (GENC) Market Cap

Gencor Industries, Inc. has a market capitalization of $208.7M.

Price: $14.24

-0.17 (-1.18%)

Market Cap: 208.73M

AMEX · time unavailable

CEO: Marc G. Elliott

Sector: Industrials

Industry: Industrial - Machinery

IPO Date: 2003-07-15

Website: https://www.gencor.com

Gencor Industries, Inc. (GENC) - Company Information

Market Cap: 208.73M|Sector: Industrials

Company Profile

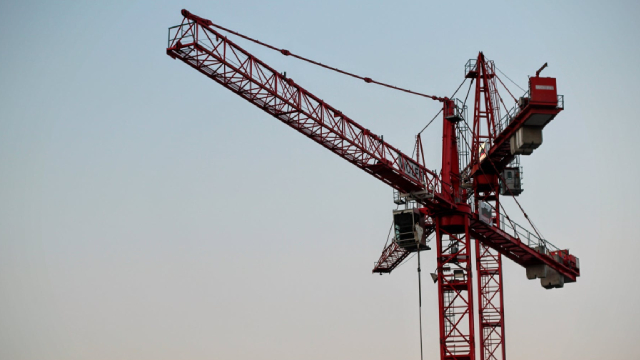
Gencor Industries, Inc., together with its subsidiaries, engages in the design, manufacture, and sale of heavy machinery used in the production of highway construction materials and environmental control equipment. The company offers hot-mix asphalt plants, hot-mix storage silos, fabric filtration systems, cold feed bins, and other plant components, as well as counter flow drum mix technology and batch plants. It also provides combustion systems for rotary dryers, kilns, fume and liquid incinerators, and fuel heaters; Hy-Way Heat and beverley lines of thermal fluid heat transfer systems, and specialty storage tanks; and asphalt pavers under the Blaw-Knox brand. In addition, the company services and sells spare parts for its equipment. It sells its products primarily to the highway construction industry through its sales representatives, and independent dealers and agents worldwide. The company was formerly known as Mechtron International Corporation and changed its name to Gencor Industries, Inc. in 1987. Gencor Industries, Inc. is based in Orlando, Florida.

Analyst Sentiment

83%
Strong Buy

From 1 Active Polls

1Y Forecast: $17.60

▲ +23.6% Potential Upside

Consensus Target Metrics

Low Bound

$18

Median

$18

High Bound

$18

Average

$18

Price & Moving Averages

Loading chart...

🎯 Wall Street Analyst Intelligence Report

1-Year structural target targets, chart projections, and sentiment maps.

Average 1Y Target
$17.60
▲ +23.60% Upside
Low Target
$17.60
24% Risk
Median Target
$17.60
24% Mid
High Target
$17.60
24% Max
Consensus
Buy
1 / 1 Buys

Consensus Trend Projection

Trailing closures vs. 12-month metrics map.

Analyst Vote Distribution

Aggregate institutional coverage sentiment weights.

📊 Historical Valuation Multiples

Real-time Trailing Twelve Month (TTM) momentum side-by-side with discrete quarterly metrics.

Fiscal QuarterTTMQ1 2026Q4 2025Q3 2025Q2 2025Q1 2025Q4 2024Q3 2024Q2 2024
Period EndingTrailing 12MMar 31, 2026Dec 31, 2025Sep 30, 2025Jun 30, 2025Mar 31, 2025Dec 31, 2024Sep 30, 2024Jun 30, 2024
Market Cap ($M)209219190214205178259306274
Enterprise Value ($M)165176153188178126219281246
Price to Earnings Ratio (P/E)13.839.1514.0928.1313.467.2416.9752.6227.50
Price/Earnings-to-Growth Ratio (PEG)0.210.560.330.34
Price to Sales Ratio (P/S)2.026.488.0611.397.604.678.2414.6110.73
Price to Book Ratio (P/B)0.940.990.881.010.980.871.291.561.41
Price to Free Cash Flow Ratio (P/FCF)-23.7032.5518.73-166.63-8.4113.4716.95-92.71-191.28
Enterprise Value to Sales (EV/Sales)5.206.519.996.593.316.9713.419.62
Enterprise Value to EBITDA (EV/EBITDA)7.7921.7229.5685.3130.9214.3437.8964.6461.98
Debt to Equity Ratio-2.040.000.000.000.000.000.000.000.00

📘 Full Research Report

ℹ️

AI-Generated Research: This report is for informational purposes only.

📘 GENCOR INDUSTRIES INC (GENC) — Investment Overview

🧩 Business Model Overview

GENCOR Industries Inc. operates as an industrial manufacturer and supplier of custom-engineered, application-specific products and solutions that get designed into industrial systems and then supported over the equipment life cycle. The business model typically follows a value chain of: (1) technical engagement and specification development with customers, (2) fabrication/production of engineered components, and (3) ongoing fulfillment of replacement parts and service-related needs that arise after installation.

Customer stickiness tends to come from engineering fit, qualification/approval processes, and the operational impact of downtime—factors that make switching vendors costly once designs are embedded in customer systems.

💰 Revenue Streams & Monetisation Model

Revenue is typically generated through a combination of project or order-based product sales and aftermarket/recurring fulfillment (spare parts, replacements, and follow-on orders tied to installed base utilization). Monetisation is driven by:

  • Custom content and engineering intensity that supports higher gross margins than commoditized components.
  • Aftermarket attach that improves revenue stability versus purely cyclical, single-cycle manufacturing.
  • Working-capital discipline: industrial manufacturing margin outcomes often hinge on lead times, billings, and inventory turns.

In this model, margin durability depends on the ability to maintain pricing discipline on custom work, manage material/input costs, and sustain aftermarket coverage for installed systems.

🧠 Competitive Advantages & Market Positioning

The core moat is primarily driven by switching costs and intangible know-how in application engineering:

  • Switching costs (qualification + design integration): Once a component is engineered into a customer’s system, changes require technical re-validation, safety/quality review, and downtime planning. This raises the friction for competitors to displace an incumbent.
  • Engineering track record: Competitors must match not just price, but fit, reliability, and delivery performance—capabilities that take time to build.
  • Operational risk management: Customers tend to favor suppliers that can consistently meet spec and quality requirements, particularly in high-utilization industrial environments.

Competitive benchmarking (illustrative peers): GENCOR competes with a range of industrial manufacturers whose offerings overlap with specific end markets. Comparable competitors can include:

  • SPX Technologies (SPXC) / engineered industrial solutions peers
  • Mueller Industries (MI) / industrial components and related distribution
  • GMS Inc. (GMS) / specialty engineered distribution/manufacturing models (end-market-dependent)

The key contrast versus broader industrial competitors is that GENCOR’s edge is typically more pronounced where application specificity and qualification barriers matter, rather than where purchasing is dominated by commodity pricing.

🚀 Multi-Year Growth Drivers

Over a 5–10 year horizon, growth tends to be supported by structural demand for industrial reliability, lifecycle support, and capacity expansion. Key drivers include:

  • Installed-base replacement cycles: As equipment ages, replacement parts and upgraded components become recurring sources of demand.
  • Industrial capex supporting “uptime” investments: Customers increasingly prioritize reliability and maintainability, increasing willingness to pay for proven engineered solutions.
  • Expansion of regulated/safety-critical applications: Processes that require strict adherence to specifications can increase the importance of qualified suppliers.
  • Customer qualification flywheel: Successful programs can lead to follow-on orders, expanding share once the supplier is embedded.

⚠ Risk Factors to Monitor

  • End-market cyclicality: Order flow can be sensitive to industrial production levels and capital spending decisions.
  • Execution and delivery risk: Engineered manufacturing can face schedule disruptions from suppliers, permitting/inspection timelines, or capacity constraints.
  • Cost and margin volatility: Material cost swings, labor inflation, and unfavorable production mix can pressure gross margins.
  • Competitive displacement: Competitors that match specifications and underprice on new projects may win share, particularly where switching friction is lower.
  • Quality/regulatory compliance: Defects or compliance failures can lead to warranty costs, customer rework, or loss of qualification.

📊 Valuation & Market View

Industrial engineered manufacturing companies are commonly valued using EV/EBITDA and earnings-multiple frameworks, with the market weighting quality of margins and cash conversion. For this type of business, valuation sensitivity typically correlates with:

  • Gross margin sustainability (pricing power vs. input cost pass-through)
  • Return on invested capital (how efficiently working capital and production assets translate into earnings)
  • Order visibility and backlog quality (where present)
  • Cash conversion (inventory, receivables, and billing terms)

When the market perceives that aftermarket/recurring contribution is rising and execution risk is contained, multiples tend to be supported; when margins or working capital weaken, the discount widens.

🔍 Investment Takeaway

GENCOR Industries Inc. presents an evergreen investment profile typical of engineered industrial suppliers: switching costs from qualification and design integration, coupled with engineering know-how and lifecycle-driven demand through after-sale needs. The long-term thesis hinges on maintaining margin discipline through input cycles, executing reliably on engineered projects, and sustaining installed-base follow-on revenue—factors that collectively support durability in cash generation across industrial cycles.


⚠ AI-generated — informational only. Validate using filings before investing.
📰 Market News & Coverage

15 Stories Available

Real-time institutional reporting and market updates for GENC.

seekingalpha.com2026-06-29

Gencor Industries, A Stable And Conservative Pick

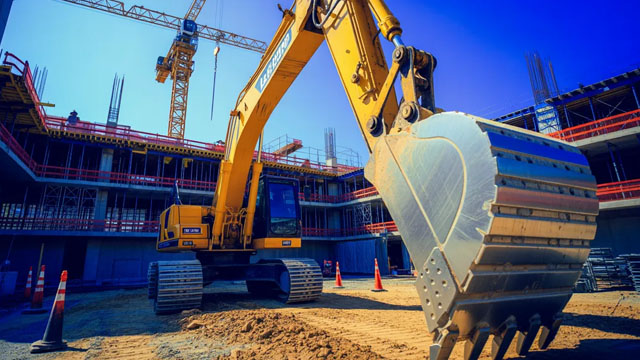
Gencor Industries, Inc. manufactures equipment for U.S. highway construction, mainly asphalt plants and pavers. GENC's business is highly dependent on U.S. government infrastructure spending for road building and maintenance, which creates stable long-term economic prospects for the company. Despite the soundness of GENC's operations, the company is trading close to NCAV per share.

zacks.com2026-06-18

Gencor Stock Decline Post Q2 Earnings Despite Record Backlog

GENC's weaker second-quarter fiscal 2026 results reflect lower revenues and higher trade show costs, while improved margins and record backlog offer support.

globenewswire.com2026-06-12

Gencor Releases Second Quarter Fiscal 2026 Results

ORLANDO, Fla., June 12, 2026 (GLOBE NEWSWIRE) -- Gencor Industries, Inc. (the “Company” or “Gencor”) (NYSE American: GENC) announced today net revenue for the quarter ended March 31, 2026 was $33,799,000 compared with $38,204,000 net revenue for the quarter ended March 31, 2025.

globenewswire.com2026-06-01

Gencor Announces Receipt of NYSE Regulation Notice Regarding Late Filing of the Quarterly Report on Form 10-Q for the period Ended March 31, 2026

ORLANDO, Fla., June 01, 2026 (GLOBE NEWSWIRE) -- Gencor Industries, Inc. (the “Company”) (NYSE American: GENC) announced that on May 19, 2026 it received a filing delinquency notification (the “Delinquency Notification”) from the NYSE Regulation (the “NYSE”) indicating that, as a result of its failure to timely file its Quarterly Report on Form 10-Q for the quarter ended March 31, 2026 (the “Form 10-Q”) with the Securities and Exchange Commission (the “SEC”) by the filing due date of May 18, 2026, the Company is not in compliance with NYSE American LLC's (“NYSE American”) continued listing standards and is now subject to the procedures and requirements set forth in Section 1007 of the NYSE American Company Guide. The receipt of the Delinquency Notification has no immediate effect on the listing or trading of the Company's common stock on NYSE American.

globenewswire.com2026-05-12

Gencor Industries, Inc. Withdraws and Retracts Preliminary Second Quarter Fiscal 2026 Earnings Release

ORLANDO, Fla., May 12, 2026 (GLOBE NEWSWIRE) -- Gencor Industries, Inc. (the “Company” or “Gencor”) (NYSE American: GENC) hereby withdraws and retracts its press release dated May 8, 2026, titled “Gencor Industries, Inc. Releases Second Quarter Fiscal 2026 Results” (the “Prior Release”). The Prior Release was issued before the Company had completed its review of the Company's financial statements for the quarter ended March 31, 2026 and should be disregarded in its entirety. Investors and other recipients should not rely on any information contained in the Prior Release, including the preliminary results of operations for the quarter ended March 31, 2026 reported therein.

globenewswire.com2026-05-08

Gencor Releases Second Quarter Fiscal 2026 Results

ORLANDO, Fla., May 08, 2026 (GLOBE NEWSWIRE) -- Gencor Industries, Inc. (the “Company” or “Gencor”) (NYSE American: GENC) announced today net revenue for the quarter ended March 31, 2026 was $33,799,000 compared with $38,204,000 net revenue for the quarter ended March 31, 2025.

globenewswire.com2026-04-14

Gencor Industries, Inc. Investigated by the Portnoy Law Firm

LOS ANGELES, April 14, 2026 (GLOBE NEWSWIRE) -- The Portnoy Law Firm advises Gencor Industries , Inc. , (“ Gencor " or the "Company") ( NYSE : GENC ) investors that the firm has initiated an investigation into possible securities fraud, and may file a class action on behalf of investors.

seekingalpha.com2026-03-26

Gencor Industries Is One Of The Best Prospects In The Market

Gencor Industries offers compelling value, trading at a deep discount to book and EV/EBITDA multiples versus peers. GENC boasts a fortress balance sheet, with $136.3 million in cash and no debt against a $197.2 million market cap. Despite mixed cash flow trends and tepid end-market growth, GENC's risk profile is minimal due to its liquidity and asset composition.

seekingalpha.com2026-02-24

Gencor: A Cash-Rich Micro-Cap Mispriced Ahead Of Highway Reauthorization

Gencor Industries, Inc. presents a compelling value opportunity, trading near cash value with a fortress balance sheet and zero debt. GENC's backlog rebounded sharply to $57.4M, signaling renewed demand as infrastructure spending uncertainties resolve and margin expansion continues. Key catalysts include resolution of SEC filing delays, leadership transition, and a likely highway bill reauthorization favoring GENC's core markets.

seekingalpha.com2026-02-19

Gencor: $57+ Million Backlog Poised To Drive Financials In Fiscal 2026

Gencor Industries maintains a bullish outlook, supported by rising gross margins, a robust backlog, and a pristine balance sheet. GENC's Q1 revenue declined year-over-year, but gross margin improved due to strong aftermarket sales and operational efficiency. The company's adjusted return on capital is materially higher than reported, reflecting efficient use of capital and significant cash reserves.

zacks.com2026-02-12

GENC Stock Up Post Q1 Earnings as Margins Improve Despite Lower Revenue

Gencor reports stronger margins and a growing backlog in its first-quarter fiscal 2026, as robust aftermarket sales cushion weaker equipment demand.

globenewswire.com2026-02-06

Gencor Releases First Quarter Fiscal 2026 Results

ORLANDO, Fla., Feb. 06, 2026 (GLOBE NEWSWIRE) -- Gencor Industries, Inc. (the “Company” or “Gencor”) (NYSE American: GENC) announced today net revenue for the quarter ended December 31, 2025 was $23,577,000 compared with $31,416,000 for the quarter ended December 31, 2024 a decrease of $7,839,000. Net revenue from contract equipment sales decreased in the quarter ended December 31, 2025. The decrease in contract equipment sales was due primarily to delays and uncertainty around replacement of the current five year Federal infrastructure spending bill which is scheduled to expire on September 30, 2026. As a percent of sales, gross profit margins were 28.7% in the quarter ended December 31, 2025, compared to 27.6% in the quarter ended December 31, 2024. The improved gross margins were driven by increased parts and components sales which typically have a higher margin compared to contract equipment sales.

zacks.com2026-01-30

2 Microcap Value Plays

AXR and GENC appear undervalued.

globenewswire.com2025-12-23

Gencor Announces the Retirement of EJ Elliott and Appointment of Marc Elliott

ORLANDO, Fla., Dec. 23, 2025 (GLOBE NEWSWIRE) -- Gencor Industries, Inc. (the “Company” or “Gencor”) (NYSE American: GENC) today announced the retirement of EJ Elliott, who serves as the Executive Chairman of the Company's Board of Directors (the “Board”), effective December 31, 2025.

zacks.com2025-12-15

Gencor Stock Gains Post Q4 Earnings on Strong Cash, Revenue Dip

GENC posts higher fourth-quarter fiscal 2025 net income despite lower revenue, margin pressure and a sharp drop in backlog.

📊 AI Financial Analysis

Powered by StockMarketInfo
Earnings Data: Q Ending 2026-03-31

"GENC reported Q2 2026 results (ended 2026-03-31): revenue of $33.8M and net income of $6.0M (EPS $0.41). On a YoY basis, revenue increased from $38.2M in Q2 2025 to $33.8M (+12.0% QoQ sequentially vs Q1 2026? actually QoQ is from $23.6M in Q1 2026, so Revenue +43.3% QoQ). Net income rose from $3.4M in Q1 2026 to $6.0M (+74.1% QoQ) and from $6.1M in Q2 2025 to $6.0M (-1.0% YoY). Profitability improved sequentially: gross margin expanded (31.7% vs 28.7% in Q1) while net margin rose to 17.7% from 14.6% QoQ. Over the last four quarters, margins were more volatile—operating income swung from a loss in Q4 2025 to strong profitability in Q2 2026, indicating a recovery in cost structure and/or mix. Operating cash flow in Q2 2026 was $6.9M and free cash flow was $6.7M, a strong QoQ step up from $11.1M operating cash flow in Q1 that benefited from working-capital dynamics. Balance sheet strength remains a key point: total assets were $239.2M, equity $221.2M, and net debt is deeply negative (~-$43.3M), reflecting substantial liquidity. Total shareholder return appears supported by price momentum: the stock is up 34.8% over the last year. With a consensus price target of $17.60 vs $15.03 current, upside is modest-to-moderate."

Revenue Growth

Positive

Revenue rose sharply QoQ to $33.8M from $23.6M (+43.3% QoQ) but declined YoY from $38.2M to $33.8M (-11.6% YoY). Trajectory looks improving sequentially, but not yet sustained YoY growth.

Profitability

Good

Net income was $6.0M, up +74.1% QoQ (from $3.4M) and roughly flat YoY (-1.0%). Margins expanded sequentially: net margin 17.7% vs 14.6% in Q1 2026; gross margin also improved (31.7% vs 28.7%).

Cash Flow Quality

Neutral

Q2 2026 delivered solid operating cash flow ($6.9M) and free cash flow ($6.7M). However, cash flow has been volatile across recent quarters (notably negative OCF in Q3/Q4 2025), suggesting working-capital sensitivity.

Leverage & Balance Sheet

Strong

Very strong balance sheet: total assets $239.2M and equity $221.2M. Net debt is negative (~-$43.1M), indicating substantial liquidity and resilience; no meaningful long-term leverage.

Shareholder Returns

Good

Total return is supported primarily by capital appreciation: 1-year price change +34.8% (>20% momentum). No dividends or buybacks were indicated in the cash flow data.

Analyst Sentiment & Valuation

Fair

Consensus target is $17.60 vs current ~$15.03 (~17% upside). Multiples (e.g., P/E ~9.1) look reasonable, but the valuation case depends on stabilizing YoY revenue and sustaining margin recovery.

Disclaimer:This analysis is AI-generated for informational purposes only. Accuracy is not guaranteed and this does not constitute financial advice.

Fundamentals Overview

Loading fundamentals overview...

📋 Official Regulatory 10-K / 10-Q SEC Filings

Direct authenticated documentation links to audited SEC database reports for GENC.

SEC EDGAR Live Feed
Loading financial data and tables...
📁

SEC Filings (GENC)

© 2026 Stock Market Info — Gencor Industries, Inc. (GENC) Financial Profile