Grocery Outlet Holding Corp.

Grocery Outlet Holding Corp. (GO) Market Cap

Grocery Outlet Holding Corp. has a market capitalization of $846.8M.

Price: $8.56

0.10 (1.18%)

Market Cap: 846.78M

NASDAQ · time unavailable

CEO: Jason Potter

Sector: Consumer Defensive

Industry: Grocery Stores

IPO Date: 2019-06-20

Website: https://www.groceryoutlet.com

Grocery Outlet Holding Corp. (GO) - Company Information

Market Cap: 846.78M|Sector: Consumer Defensive

Company Profile

Grocery Outlet Holding Corp. owns and operates a network of independently operated stores in the United States. The company's stores offer products in various categories, such as dairy and deli, produce, floral, and fresh meat and seafood products, as well as grocery, general merchandise, health and beauty care, frozen foods, and beer and wine. As of August 09, 2022, it had 425 stores in eight states. The company was founded in 1946 and is headquartered in Emeryville, California.

Analyst Sentiment

57%
Buy

From 13 Active Polls

1Y Forecast: $11.08

▲ +29.4% Potential Upside

Consensus Target Metrics

Low Bound

$9

Median

$11

High Bound

$15

Average

$11

Price & Moving Averages

Loading chart...

🎯 Wall Street Analyst Intelligence Report

1-Year structural target targets, chart projections, and sentiment maps.

Average 1Y Target
$11.08
▲ +29.44% Upside
Low Target
$9.00
5% Risk
Median Target
$11.00
29% Mid
High Target
$15.00
75% Max
Consensus
Hold
7 / 23 Buys

Consensus Trend Projection

Trailing closures vs. 12-month metrics map.

Analyst Vote Distribution

Aggregate institutional coverage sentiment weights.

📊 Historical Valuation Multiples

Real-time Trailing Twelve Month (TTM) momentum side-by-side with discrete quarterly metrics.

Fiscal QuarterTTMQ2 2026Q1 2026Q3 2025Q2 2025Q1 2025Q4 2024Q3 2024Q2 2024
Period EndingTrailing 12MApr 4, 2026Jan 3, 2026Sep 27, 2025Jun 28, 2025Mar 29, 2025Dec 31, 2024Sep 28, 2024Jun 29, 2024
Market Cap ($M)8477119971,5551,2391,2921,5211,7382,202
Enterprise Value ($M)2,6302,4932,7373,3142,9462,9833,1143,2513,661
Price to Earnings Ratio (P/E)-2.21-0.99-1.1433.5062.43-13.85164.4917.9739.32
Price/Earnings-to-Growth Ratio (PEG)-0.2812.96-5.494.45
Price to Sales Ratio (P/S)0.180.610.821.331.051.151.381.571.95
Price to Book Ratio (P/B)1.040.881.011.301.041.101.271.421.80
Price to Free Cash Flow Ratio (P/FCF)-264.78-3682.05164.12-66.2185.98-203.55-57.10-53.27-2725.09
Enterprise Value to Sales (EV/Sales)2.142.252.842.502.652.842.933.24
Enterprise Value to EBITDA (EV/EBITDA)7.5466.2515.3149.7044.78352.9275.1946.9467.86
Debt to Equity Ratio5.112.281.841.511.481.481.381.291.25
⚠️

Valuation Model Suspended

API Payload Error: Inverted or negative baseline Free Cash Flow margin detected (-0.3%).

Troubleshooting Notice: The upstream financial data supplier has uploaded corrupted or inverted baseline metrics for GO. The server sandbox cannot calculate an intrinsic value path from negative cash generation baselines.

📘 Full Research Report

ℹ️

AI-Generated Research: This report is for informational purposes only.

📘 GROCERY OUTLET HOLDING CORP (GO) — Investment Overview

🧩 Business Model Overview

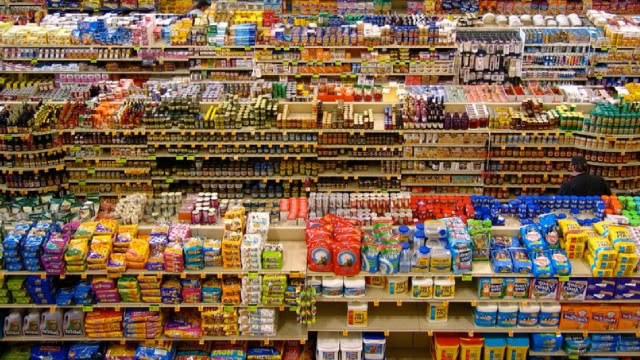
Grocery Outlet operates a value-focused grocery retail model built around opportunistic sourcing and disciplined store-level execution. Stores carry a mix of everyday grocery essentials alongside rotating “treasure hunt” products, where merchandise availability can vary by week based on inbound opportunities. The company’s distribution and purchasing function prioritizes cost-effective procurement, which enables a consistent pricing message even when product mix changes. The operating model relies on frequent customer visits, tight inventory controls for perishable categories, and store managers’ ability to translate buying opportunities into sellable assortment.

💰 Revenue Streams & Monetisation Model

Revenue is primarily generated through in-store sales of groceries and general merchandise. Monetisation is largely transactional, but the business exhibits a “habit loop” that can be measured through customer repeat behavior: when pricing and assortment create a perception of persistent value, shoppers tend to visit more often and convert into higher basket sizes. Margin drivers include (1) procurement economics versus mainstream peers, (2) the mix between national brands and store/private-label offerings, and (3) shrink and markdown discipline tied to perishable category performance. While the model is not inherently recurring in contract terms, it can still support durable unit economics through consistent store throughput and inventory turns.

🧠 Competitive Advantages & Market Positioning

Grocery Outlet’s moat is primarily a cost advantage from sourcing and scale/distribution leverage, reinforced by private-label resistance and a differentiated merchandising cadence.

  • Scale/distribution leverage: Central purchasing and distribution discipline improve the company’s ability to secure attractive purchase prices and manage inbound variability across a growing store base.
  • Private label + supplier relationships: House brands and proprietary product selection support margin resilience when branded items face cost pressure or when branded assortment becomes less favorable.
  • Treasure-hunt merchandising as a switching-avoidance mechanism: While grocery retail lacks traditional switching costs, the frequent-visit expectation acts like a practical retention lever. Customers return for deals and changing assortments, reducing “share drift” to competitors.

Competitive benchmarking (industry focus):

  • Aldi: Competes using tightly controlled store assortments, efficient operations, and a heavy emphasis on private label. Grocery Outlet differs by leaning more on opportunistic, rotating “treasure hunt” sourcing rather than a fixed, narrow SKU strategy.
  • Walmart: Competes through massive national scale, procurement leverage, and omnichannel logistics. Grocery Outlet’s competitive approach is more localized and assortment-driven, aiming to extract value from purchasing opportunities and store-level merchandise mix rather than competing on end-to-end supply chain breadth.
  • Kroger / other conventional grocers: Often focus on broader, more stable assortment, loyalty programs, and regional supplier relationships. Grocery Outlet’s advantage centers on cost structure and inventory/assortment tactics designed to sustain lower effective prices.

🚀 Multi-Year Growth Drivers

Growth potential over a 5–10 year horizon is driven by a combination of market share gains in value-driven grocery and continued store expansion, supported by procurement sophistication.

  • Value retail durability: Grocery demand is price sensitive; periods of higher inflation and consumer trade-down typically expand the addressable customer base for discount formats.
  • Unit growth and store economics: Store openings can compound if distribution coverage, inventory planning, and labor productivity scale effectively with footprint growth.
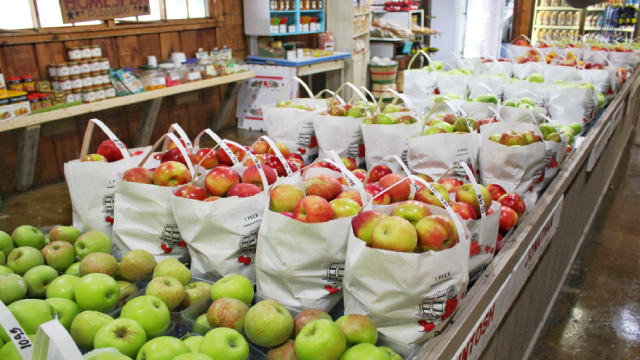
  • Assortment optimization: The “treasure hunt” model can grow by improving supplier access to overstock, discontinued lines, and opportunistic lots—turning supply variability into a pricing advantage.
  • Private-label mix progression: Increasing penetration of proprietary products can enhance margin stability and reduce exposure to branded price volatility.

⚠ Risk Factors to Monitor

  • Supply volatility: The model depends on access to favorable inbound opportunities. Deterioration in procurement economics or reduced availability of opportunistic inventory can pressure gross margin.
  • Inventory and perishables execution: Grocery is inherently shrink- and spoilage-sensitive. Ineffective demand forecasting can translate into markdowns and margin compression.
  • Competitive intensity: Discount grocers and mass retailers can intensify price competition, compressing spread versus mainstream grocery formats.
  • Real estate and labor costs: Store-level profitability is sensitive to rent, occupancy costs, and wage inflation.
  • Food safety and regulatory compliance: As a grocery retailer, operational controls must remain robust to manage recall risk and regulatory scrutiny.

📊 Valuation & Market View

Equity markets typically value grocery retail businesses on a blend of EV/EBITDA and P/S, with attention to store-level operating metrics rather than near-term earnings volatility. Valuation sensitivity often tracks:

  • Comparable sales quality: Whether growth is driven by sustainable pricing/mix versus temporary promotional pressure.
  • Gross margin durability: Procurement economics, private-label mix, and markdown/shrink performance.
  • Operating leverage: Labor productivity, distribution efficiency, and store-level throughput improvements.
  • Unit expansion returns: Payback periods and sustainability of economics for new stores as the company scales.

In practice, the market tends to re-rate value-oriented retailers when it gains confidence that discount economics will remain structurally supported by procurement advantages and execution, not only by cyclical consumer trade-down.

🔍 Investment Takeaway

Grocery Outlet’s long-term thesis rests on a structural cost advantage in procurement, reinforced by inventory/assortment discipline and private-label margin support. Unlike conventional grocers that compete primarily on breadth and loyalty ecosystems, GO competes by translating purchasing leverage and rotating merchandise access into persistent value, creating an operational “repeat visit” dynamic. The primary investment question is whether procurement quality, perishables execution, and store-level economics can remain durable through competitive pressure and supply variability.


⚠ AI-generated — informational only. Validate using filings before investing.

📰 Market News & Coverage

15 Stories Available

Real-time institutional reporting and market updates for GO.

zacks.com2026-06-05

Is Grocery Outlet Stock a Buy as Its Valuation Looks Cheap?

GO looks cheap, but the buy case hinges on turning traffic gains, store optimization and the "WOW!" mix into steadier margins and EBITDA.

zacks.com2026-06-05

Grocery Outlet Turnaround Watch: Mix, Margins, and Refreshes

Grocery Outlet's traffic is back, but baskets and margins lag as it rebuilds opportunistic deals, leans on private label, and prunes stores.

zacks.com2026-06-05

Why Grocery Outlet's Treasure-Hunt Model Could Spark a Rebound

GO's treasure-hunt WOW! deals are pulling in more shoppers, but smaller baskets and promo-led margin pressure keep comps down.

seekingalpha.com2026-05-22

Grocery Outlet Holding: Reiterate Sell Rating Given No Signs Of Strong Recovery Yet

Grocery Outlet Holding remains a Sell as core store performance and margins remain weak despite improved traffic. GO's Q1 saw CSS decline 1%, average transaction size fall 3.1%, and adjusted EBITDA margin drop to 3.7%. Promotions and opportunistic product mix lifted traffic, but profitability and basket size have not recovered, undermining the value proposition.

zacks.com2026-05-21

4 Consumer Staples Stocks Worth Watching Amid Market Challenges

Despite spending volatility and cost pressures, BJ, OLLI, GO and DNUT are driving growth through value offerings and strategic initiatives.

globenewswire.com2026-05-18

Bronstein, Gewirtz & Grossman LLC Urges Grocery Outlet Holding Corp. Investors to Act: Class Action Filed Alleging Investor Harm

NEW YORK, May 18, 2026 (GLOBE NEWSWIRE) -- Bronstein, Gewirtz and Grossman, LLC, a nationally recognized investor-rights law firm, announces that a class action lawsuit has been filed against Grocery Outlet Holding Corp. (NASDAQ: GO) and certain of its officers. This lawsuit seeks to recover damages against Defendants for alleged violations of the federal securities laws on behalf of all persons and entities that purchased or otherwise acquired Grocery Outlet securities between August 5, 2025 and March 4, 2026, both dates inclusive (the "Class Period").

globenewswire.com2026-05-18

Bronstein, Gewirtz & Grossman LLC Urges Grocery Outlet Holding Corp. Investors to Act: Class Action Filed Alleging Investor Harm

New class action for Grocery Outlet (GO) urges investors to seek recovery for alleged securities fraud violations – lead plaintiff deadline of 5/15/2026

newsfilecorp.com2026-05-15

Bronstein, Gewirtz & Grossman LLC Urges Grocery Outlet Holding Corp. Investors to Act: Class Action Filed Alleging Investor Harm

New York, New York--(Newsfile Corp. - May 15, 2026) - Bronstein, Gewirtz & Grossman, LLC, a nationally recognized investor-rights law firm, announces that a class action lawsuit has been filed against Grocery Outlet Holding Corp. (NASDAQ: GO) and certain of its officers. This lawsuit seeks to recover damages against Defendants for alleged violations of the federal securities laws on behalf of all persons and entities that purchased or otherwise acquired Grocery Outlet securities between August 5, 2025 and March 4, 2026, both dates inclusive (the "Class Period").

gurufocus.com2026-05-15

GO CLASS ACTION DEADLINE TONIGHT: Faruqi & Faruqi, LLP Reminds Grocery Outlet (GO) Investors of Securities Class Action Deadline on May 15, 2026

[url="]Faruqi and Faruqi, LLP[/url], a leading national securities law firm, is investigating potential claims against Grocery Outlet Holding Corp. (“Grocery O

globenewswire.com2026-05-15

Lost Money on Grocery Outlet Holding Corp. (GO)? Join Class Action Suit Seeking Recovery - Contact The Gross Law Firm

NEW YORK, May 15, 2026 (GLOBE NEWSWIRE) -- The Gross Law Firm issues the following notice to shareholders of Grocery Outlet Holding Corp. (NASDAQ: GO). Shareholders who purchased shares of GO during the class period listed are encouraged to contact the firm regarding possible lead plaintiff appointment.

businesswire.com2026-05-15

GO CLASS ACTION DEADLINE TONIGHT: Faruqi & Faruqi, LLP Reminds Grocery Outlet (GO) Investors of Securities Class Action Deadline on May 15, 2026

NEW YORK--(BUSINESS WIRE)---- $GO #ClassAction--Faruqi & Faruqi, LLP, a leading national securities law firm, is investigating potential claims against Grocery Outlet Holding Corp. (“Grocery Outlet” or the “Company”) (NASDAQ: GO) and reminds investors of the May 15, 2026 deadline to seek the role of lead plaintiff in a federal securities class action that has been filed against the Company. Faruqi & Faruqi is a leading national securities law firm with offices in New York, Pennsylvania, California and Georg.

prnewswire.com2026-05-14

INVESTOR ALERT: Pomerantz Law Firm Reminds Investors with Losses on their Investment in Grocery Outlet Holding Corp. of Class Action Lawsuit and Upcoming Deadlines - GO

NEW YORK, May 14, 2026 /PRNewswire/ -- Pomerantz LLP announces that a class action lawsuit has been filed against Grocery Outlet Holding Corp. ("Grocery Outlet" or the "Company") (NASDAQ: GO). Such investors are advised to contact Danielle Peyton at newaction@pomlaw.com or 646-581-9980, (or 888.4-POMLAW), toll-free, Ext.

prnewswire.com2026-05-14

GO 36 HOUR DEADLINE ALERT: Faruqi & Faruqi, LLP Reminds Grocery Outlet (GO) Investors of Securities Class Action Deadline on May 15, 2026

Faruqi & Faruqi, LLP Securities Litigation Partner James (Josh) Wilson Encourages Investors Who Suffered Losses In Grocery Outlet To Contact Him Directly To Discuss Their Options If you purchased or acquired securities in Grocery Outlet between August 5, 2025 and March 4, 2026 and would like to discuss your legal rights, call Faruqi & Faruqi partner Josh Wilson directly at 877-247-4292 or 212-983-9330 (Ext. 1310). [You may also click here for additional information] NEW YORK, May 14, 2026 /PRNewswire/ -- Faruqi & Faruqi, LLP, a leading national securities law firm, is investigating potential claims against Grocery Outlet Holding Corp. ("Grocery Outlet" or the "Company") (NASDAQ: GO) and reminds investors of the May 15, 2026 deadline to seek the role of lead plaintiff in a federal securities class action that has been filed against the Company.

prnewswire.com2026-05-14

Grocery Outlet Holding Corp. (GO) Shareholders Who Lost Money Have Opportunity to Lead Securities Fraud Lawsuit

LOS ANGELES, May 14, 2026 /PRNewswire/ -- Glancy Prongay Wolke & Rotter LLP announces that investors with losses have opportunity to lead the securities fraud class action lawsuit against Grocery Outlet Holding Corp. ("Grocery Outlet" or the "Company") (NASDAQ: GO). IF YOU SUFFERED A LOSS ON YOUR GROCERY OUTLET INVESTMENTS, CLICK  HERE BEFORE MAY 15, 2026 (LEAD PLAINTIFF DEADLINE) TO PARTICIPATE IN THE SECURITIES FRAUD LAWSUIT What Is The Lawsuit About?

newsfilecorp.com2026-05-14

Bronstein, Gewirtz & Grossman LLC Urges Grocery Outlet Holding Corp. Investors to Act: Class Action Filed Alleging Investor Harm

New York, New York--(Newsfile Corp. - May 14, 2026) - Bronstein, Gewirtz & Grossman, LLC, a nationally recognized investor-rights law firm, announces that a class action lawsuit has been filed against Grocery Outlet Holding Corp. (NASDAQ: GO) and certain of its officers. This lawsuit seeks to recover damages against Defendants for alleged violations of the federal securities laws on behalf of all persons and entities that purchased or otherwise acquired Grocery Outlet securities between August 5, 2025 and March 4, 2026, both dates inclusive (the "Class Period").

📊 AI Financial Analysis

Powered by StockMarketInfo
Earnings Data: Q Ending 2026-04-04

"GO (latest: 2026-04-04, Q1) reported revenue of $1.166B and an EPS of -$1.83. Net income was -$184.4M (net margin -15.8%). QoQ, revenue declined from $1.215B (2026-01-03, Q4) to $1.166B (down ~-4.1%), while net income deteriorated from -$218.2M to -$184.4M (improvement of ~+15.5% QoQ, still deeply unprofitable). YoY, revenue rose from $1.126B (2025-03-29, Q1) to $1.166B (up ~+3.5%), but net income swung from -$23.3M to -$184.4M (worsened ~-690% YoY), indicating a major cost/profitability step-down. Profitability is contracting sharply: gross margin held near ~29.6% (295.9 bps), but operating results collapsed (operating income -$1.8M vs -$22.5M last year Q1, yet far below prior profitable quarters such as 2025-06-28 and 2025-09-27). Cash flow quality is mixed: operating cash flow was +$52.6M, but free cash flow was -$0.19M due to capex. Balance sheet leverage remains heavy: total assets fell to $2.958B from $3.091B (QoQ), while total equity declined to $807.1M from $983.7M, and net debt increased to ~$1.309B. Shareholder returns appear weak. Stock price is $7.58 with 1y_change of -48.22% and dividend yield of 0%; no buybacks/dividends are reflected in the cash flow, so total shareholder return is primarily capital depreciation. Analyst consensus valuation inputs (target ~$12.08) suggest downside/upside potential versus current, but the fundamentals trend is negative."

Revenue Growth

Fair

Revenue was $1.166B in 2026-04-04 Q1: +3.5% YoY (vs $1.127B in 2025-03-29 Q1) but -4.1% QoQ (vs $1.215B in 2026-01-03 Q4).

Profitability

Neutral

Gross margin was stable near ~29.6% QoQ/YoY, but net profitability deteriorated materially: net income was -$184.4M vs -$23.3M YoY (~-690%), with EPS -$1.83 and net margin -15.8%. Operating margin is also negative (-0.16%).

Cash Flow Quality

Neutral

Operating cash flow was positive (+$52.6M) but free cash flow was slightly negative (-$0.19M) due to capex. No dividends; buybacks not shown (repurchases = 0).

Leverage & Balance Sheet

Neutral

Leverage remains elevated: total debt ~ $1.368B and net debt ~ $1.309B. Equity weakened to ~$807M from ~$984M QoQ, reducing balance-sheet resilience.

Shareholder Returns

Neutral

Total shareholder return signal is poor: price is down -48.22% over 1 year, dividend yield is 0%, and cash flow shows no buybacks.

Analyst Sentiment & Valuation

Caution

Consensus target (~$12.08) is above current ($7.58), implying potential upside on valuation, but analyst optimism contrasts with sharply worsening YoY profitability.

Disclaimer:This analysis is AI-generated for informational purposes only. Accuracy is not guaranteed and this does not constitute financial advice.

Fundamentals Overview

Loading fundamentals overview...

Grocery Outlet delivered Q1 results broadly in line while actively remaking the value engine. Revenue grew 3.6% to $1.17B, but comps still declined 1% as basket remained pressured (average transaction size -3.1%) even though traffic improved (~2.1%). The operating story is that opportunistic branded mix increased nearly 2 percentage points since early January, with shipments/inventory and mix on sales up 200+ bps; management believes traffic gains will translate into improving basket later. Gross margin was 29.6%, burdened by promotional investments and closure-related liquidations (~50 bps). For Q2, management guided comps down 1.5% to 2.0% and gross margin 29.8%–30.0%, reflecting continued promo bridge and some additional liquidation impact. Store closures (36) are complete, but store refresh pacing was reduced to ~100 year-end to reallocate resources toward op execution. Cash is $59M with $175M revolver availability and 1.8x net leverage; GAAP loss is dominated by restructuring and a noncash $158M goodwill impairment.

AI IconGrowth Catalysts

  • Increase in branded opportunistic product mix: nearly +2 percentage points since start of year; shipments and inventory up; mix on sales up over 200 bps
  • Promotional bridge / synthetic promotional support to stabilize comps while opportunistic mix ramps; targeted around high-traffic occasions (Super Bowl, Easter)
  • Extreme value campaign (at-home/digital + simplified in-store signage and elevated key value items) to make branded savings more visible and easier to shop
  • Store refresh program completed 34 in Q1 (58 total to date) to improve ease of shop, in-stock consistency, merchandising, and signage
  • Improved shrink performance driving better operator profitability trends

Business Development

  • Short-dated/opportunistic pilot launched with one major vendor; plan to expand to other vendors as supply-chain visibility improves
  • Expanded supplier outreach and increased supplier engagement at leadership level to accelerate opportunistic deal flow
  • Operator ABR process paired with field support to translate store-level performance gaps into profit opportunities

AI IconFinancial Highlights

  • Q1 revenue $1.17B (+3.6% YoY) with comp store sales -1% (traffic +~2.1% / transaction size -3.1%); slightly ahead vs outlook of -2.5% and -1.5%
  • Gross margin 29.6% within outlook; included ~50 bps impact from announced store closures and included ~$6M (50 bps) from inventory liquidations/write-downs
  • 50 bps year-over-year? (management cited 80 bps YoY decline in gross margin driven by promotional investments and store-closure impacts, partially offset by better inventory management)
  • Adjusted EPS $0.05, $0.01 above March guidance range; Adjusted EBITDA $43.1M at top end of range
  • Q1 SG&A $347M (+4.8% YoY), 29.8% of net sales (+40 bps YoY) due to higher professional fees/commissions/costs, partially offset by lower incentive comp
  • Effective tax rate 2.2% vs 19.7% prior year primarily due to $158M noncash goodwill impairment reducing effective tax rate by 13.2%
  • Net loss $180.3M (-$1.83 EPS) primarily restructuring charges ($18.2M) and goodwill impairment ($158M); Adjusted net income $4.6M ($0.05 EPS)

AI IconCapital Funding

  • Cash at quarter-end: $59M
  • Revolver available capacity: ~$175M
  • Total debt (net of issuance costs): $489.3M (down $3.6M vs end of 2025)
  • Net leverage: 1.8x adjusted EBITDA
  • Operating cash flow: $52.6M vs $58.9M prior year (working capital changes including inventory/accrued liabilities; partially offset by lower adjusted net loss after noncash charges)
  • CapEx: $56.8M in Q1 ($53.9M net of tenant improvement allowances); full-year CapEx expected ~$170M

AI IconStrategy & Ops

  • Store closures: closing 36 underperforming stores in 2026; closures complete (improves fleet quality/earnings profile); remaining 9 restructuring-tied closures occurred in April
  • Pace shift on store refreshes: completed 34 in Q1; 58 total completed as of call; now expect ~100 refreshes by year-end (reduced from prior pace implied by question)
  • Operator tooling upgrades: expanded real-time order guide functionality, enhanced benchmarking, streamlined commercial communications, and launched new annual business review (ABR) process comparing stores to top-quartile peers
  • Op execution focus (“all hands on deck”): reduced MTO and private label (to make room for op), improved extreme value messaging and reporting/visibility across supply chain

AI IconMarket Outlook

  • Q2 comp store sales guidance: decline 1.5% to 2.0% (includes ~50 bps headwind from Easter calendar shift)
  • Q2 gross margin guidance: 29.8% to 30.0% (promotional investments continuing to bridge ramp of opportunistic mix)
  • Q2 Adjusted EBITDA guidance: $55M to $58M
  • Q2 diluted EPS guidance: $0.11 to $0.13
  • Full-year guidance reiterated (details referenced as in earnings release; specific full-year numbers not included in transcript)

AI IconRisks & Headwinds

  • Continued basket pressure from lower units per transaction (UPT down 3.1% in Q1) despite traffic improvement
  • Promotional spending dependency: management expects gross margin to normalize only after promotional spend tapers in Q3 and is “totally” off in Q4
  • Inventory liquidation/write-down impacts tied to store closures contributed ~50 bps to gross margin in Q1 and additional ~$1.5M liquidation headwind expected in Q2
  • Supply chain/fuel cost risk: fuel impact cited at ~10 bps “so far” (indicates monitoring still needed)
  • Restructuring and noncash goodwill impairment created large GAAP losses and very low effective tax rate, increasing reported volatility

Q&A: Analyst Interest

  • Guidance assumptions vs macro (consumer pressure, supply chain costs): Management said the business is countercyclical, typically benefits when consumers face pressure, and expects current value-engine changes to drive improvement through the year. They emphasized prudence due to recent comp volatility rather than outright macro confidence.
  • Gross margin bridge and taper plan: Management connected Q2 gross margin to continued promotional spend ($20M mentioned for 2026) plus modest liquidation impacts. They stated gross margin should rise as opportunistic mix ramps in the back half, with promotions slowing in Q3 and ending in Q4.
  • Opportunistic mix targets and timeline: Management said a historical healthy mix for strongest stores is close to a 50/50 blend between opportunistic and made-to-order/private label, and they want to move “closer to a 50-50 blend.” They also noted they’re not releasing current chain-wide blend and cited ~200 bps improvement since quarter start.

Sentiment: MIXED

Note: This summary was synthesized by AI from the GO Q1 2026 earnings transcript. Financial data is complex; please verify all metrics against official SEC filings before making investment decisions.

📋 Official Regulatory 10-K / 10-Q SEC Filings

Direct authenticated documentation links to audited SEC database reports for GO.

SEC EDGAR Live Feed
Loading financial data and tables...
📁

SEC Filings (GO)

© 2026 Stock Market Info — Grocery Outlet Holding Corp. (GO) Financial Profile