Chart Industries, Inc.

Chart Industries, Inc. (GTLS) Market Cap

Chart Industries, Inc. has a market capitalization of $9.92B.

Price: $207.31

-0.22 (-0.11%)

Market Cap: 9.92B

NYSE · time unavailable

CEO: Gerald F. Vinci

Sector: Industrials

Industry: Industrial - Machinery

IPO Date: 2006-07-26

Website: https://www.chartindustries.com

Chart Industries, Inc. (GTLS) - Company Information

Market Cap: 9.92B|Sector: Industrials

Company Profile

Chart Industries, Inc. manufactures and sells engineered equipment for the energy and industrial gas industries worldwide. The company operates through four segments: Cryo Tank Solutions, Heat Transfer Systems, Specialty Products, and Repair, Service & Leasing. It provides bulk and packaged gas cryogenic solutions for the storage, distribution, vaporization, and application of industrial gases; cryogenic trailers, ISO containers, bulk storage tanks, loading facilities, and regasification equipment for delivering liquefied natural gas (LNG) into virtual pipeline applications; and large vacuum insulated storage tanks as equipment for purchasers of standard liquefaction plants. The company also offers process technology, liquefaction train, and critical equipment for the LNG, including small to mid-scale facilities, floating LNG applications, and large base-load export facilities; brazed aluminum, Core-in-Kettle, heat exchangers, cold boxes, air cooled heat exchangers, pressure vessels, and pipe works; and air cooled heat exchangers and axial cooling fans for the power, heating, ventilation, air conditioning, and refining applications. In addition, it provides highly engineered equipment that is used in specialty end-market applications for hydrogen, LNG, biogas, CO2 Capture, food and beverage, aerospace, lasers, cannabis, and water treatment; and cryogenic components, including vacuum insulated pipes, specialty liquid nitrogen, end-use equipment, and cryogenic flow meters. Additionally, it provides extended warranties, plant start-up, parts, 24/7 support, monitoring and process optimization, repairing, maintenance, and upgrading services; plant services on equipment, including brazed aluminum heat exchangers, cold boxes, etc.; and service locations that undertake installation, service, repair, maintenance, and refurbishment of cryogenic products, as well as equipment leasing solutions. The company was founded in 1859 and is based in Ball Ground, Georgia.

Analyst Sentiment

35%
Underperform

From 7 Active Polls

1Y Forecast: $193.81

▼ -6.5% Potential Upside

Consensus Target Metrics

Low Bound

$160

Median

$202

High Bound

$240

Average

$194

Price & Moving Averages

Loading chart...

🎯 Wall Street Analyst Intelligence Report

1-Year structural target targets, chart projections, and sentiment maps.

Average 1Y Target
$193.81
▼ -6.51% Upside
Low Target
$160.00
-23% Risk
Median Target
$201.50
-3% Mid
High Target
$240.00
16% Max
Consensus
Buy
20 / 37 Buys

Consensus Trend Projection

Trailing closures vs. 12-month metrics map.

Analyst Vote Distribution

Aggregate institutional coverage sentiment weights.

📊 Historical Valuation Multiples

Real-time Trailing Twelve Month (TTM) momentum side-by-side with discrete quarterly metrics.

Fiscal QuarterTTMQ1 2026Q4 2025Q3 2025Q2 2025Q1 2025Q4 2024Q3 2024Q2 2024
Period EndingTrailing 12MMar 31, 2026Dec 31, 2025Sep 30, 2025Jun 30, 2025Mar 31, 2025Dec 31, 2024Sep 30, 2024Jun 30, 2024
Market Cap ($M)9,9249,4209,3968,9957,3996,4868,1055,2205,889
Enterprise Value ($M)13,44312,93812,77212,24510,8329,91711,4388,8779,699
Price to Earnings Ratio (P/E)-359.13-137.7144.15-16.2424.3132.7625.4618.9125.12
Price/Earnings-to-Growth Ratio (PEG)-9.603.016.118.862.67
Price to Sales Ratio (P/S)2.3910.658.708.176.846.487.324.915.66
Price to Book Ratio (P/B)2.992.982.912.812.212.162.871.762.14
Price to Free Cash Flow Ratio (P/FCF)982.55-34.53141.9394.9860.65-80.9731.0729.9166.92
Enterprise Value to Sales (EV/Sales)14.6211.8311.1310.019.9010.338.359.32
Enterprise Value to EBITDA (EV/EBITDA)29.41245.9865.84-355.9544.2546.0943.6735.6242.13
Debt to Equity Ratio7.701.201.161.141.131.241.291.341.48

GTLS Growth Runway Model

🟢 Initial high growth rate - forecast is based on a long term bell curve % growth rate

Multi-Stage Discounted Cash Flow Sandbox

Market Price$207.31
Intrinsic Value$0.00
Market Alignment
Overvalued by 122.3%relative to calculated intrinsic value
9.00%
Exp: 37%37%
i

Growth runway slowdown

This value provides a time window for the growth rate to decline beyond Stage 1 toward the terminal rate. Longer windows are most useful for companies with high growth starting conditions or strong competitive advantages. This option stretches out the growth rate slowdown across 5, 10, or 15-year steps. A high-growth starting condition (exceeding a 25% initial growth rate) automatically applies a curve decay to simulate realistic, rapid market saturation.
i

Terminal growth rate

With long-term inflation between 3-5%, revenue must grow by that baseline to maintain flat real-world market share. This value sets the permanent terminal growth rate to factor into the valuation beyond the growth slowdown runway toward maturity.

3-Stage Financial Runway Horizon

🧠 Perpetuity Horizon Engine (Stage 3: Post-2035)

Terminal FCF Base$0.08B
Perpetuity TV Value$1.44B
Discounted TV (PV)$0.61B
TV Weighting %75.5%
⚠️
Financial Model Disclaimer & Risk Disclosure: This interactive scenario simulator is an educational sandbox provided strictly for informational and analytical research purposes. Core historical financial statements and consensus estimates are sourced directly via Financial Modeling Prep (FMP). All downstream outputs are entirely deterministic, hypothetical projections generated by combining automated mathematical formulas (including linear interpolation and Gaussian bell-curve decay models) with user-selected variables and third-party financial data inputs. Users assume all liability for trading decisions executed based on these sandbox calculations.

📘 Full Research Report

ℹ️

AI-Generated Research: This report is for informational purposes only.

📘 CHART INDUSTRIES INC (GTLS) — Investment Overview

🧩 Business Model Overview

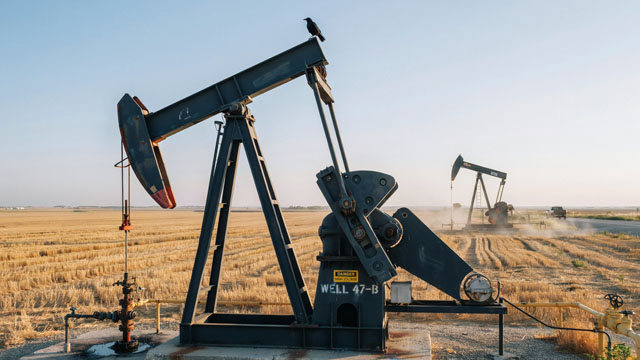
Chart Industries designs, manufactures, and services cryogenic and process equipment used to produce, store, and transport low-temperature gases. The company’s “how it works” centers on matching engineered systems—delivering strict thermal performance and safety requirements—to the operational needs of upstream and midstream gas customers, LNG operators, and industrial gas producers.

Revenue is supported by (1) project and equipment delivery tied to capacity buildouts, and (2) lifecycle support—parts, upgrades, field services, and service-driven relationships maintained after installation. This structure creates an installed base that behaves differently from pure “one-and-done” capital goods vendors.

💰 Revenue Streams & Monetisation Model

Chart monetizes through a mix of equipment sales and aftermarket/service revenue:

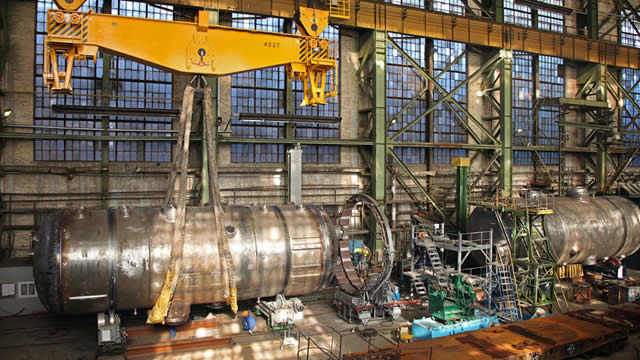
  • Systems and equipment sales (more transactional): Deliveries of engineered cryogenic systems and related components sold to customers building or expanding gas processing, LNG, and industrial gas infrastructure.
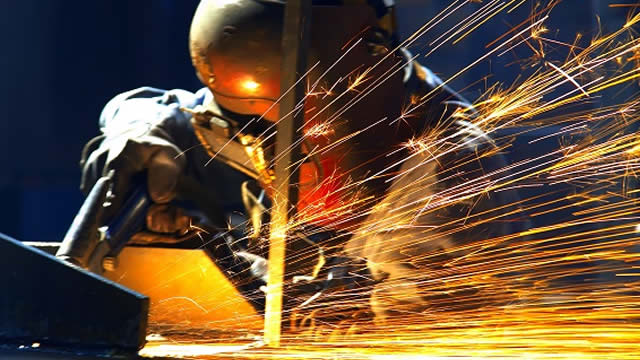
  • Aftermarket and service (more recurring): Ongoing revenue streams from spare parts, maintenance, refurbishments, and service programs that extend the operating life and reliability of installed equipment.
  • Upgrades and replacement cycles: Periodic reconditioning and modernization work driven by fleet age, operational performance targets, and compliance requirements.

Margin structure typically reflects a higher-margin tilt toward services/aftermarket versus commoditized manufacturing. For equipment projects, gross margin depends on engineering content, manufacturing execution, and procurement discipline; for service, margin resilience tends to improve with customer stickiness and backlog visibility from the installed base.

🧠 Competitive Advantages & Market Positioning

Chart’s competitive strength is rooted in hard technical requirements, customer qualification, and lifecycle service relationships—factors that support defensible switching costs.

  • Switching costs (installed base & qualification): Cryogenic systems require long qualification cycles, tight performance tolerances, and safety-critical integration. Once equipment is installed and certified, customers often prefer using established service partners for parts, repair procedures, and reliability-driven maintenance.
  • Engineering and application expertise (intangible capability): The business relies on specialist know-how in thermal management, reliability engineering, and system integration for gas handling at cryogenic temperatures.
  • Aftermarket penetration leverage (sticky service ecosystem): A broad installed fleet supports recurring service demand, creating a stabilizing offset to equipment-cycle volatility.

Competitive benchmarking:

  • Howden (industrial process and compressors/thermal systems): More frequently associated with broader rotating equipment and process engineering; Chart’s differentiation concentrates on cryogenic system specialization and lifecycle support for low-temperature gas applications.
  • Alfa Laval (heat transfer and separation technologies): Strong presence in thermal/heat exchange solutions; Chart’s focus emphasizes cryogenic performance and end-to-end cryogenic equipment needs for LNG and gas processing fleets, where service continuity can matter materially.
  • Baker Hughes (oilfield and process equipment/services): Diversified across upstream/midstream assets; Chart operates more narrowly in cryogenic and LNG-adjacent equipment/services, which can translate into deeper installed-base expertise.

In practice, Chart competes where deep cryogenic know-how and lifecycle service coverage are decisive, rather than where general-purpose thermal equipment or commoditized fabrication dominates.

🚀 Multi-Year Growth Drivers

Over a 5–10 year horizon, demand is supported by structural infrastructure and energy-transition-related buildouts:

  • LNG and gas processing expansion: Ongoing development and debottlenecking of LNG liquefaction, storage, and transfer systems sustain equipment replacement and upgrade needs.
  • Marine and port LNG infrastructure: Growth in LNG as a marine fuel drives demand for cryogenic handling and terminal-related equipment, along with service for operational continuity.
  • Industrial decarbonization pathways via hydrogen: Hydrogen supply chains require cryogenic or otherwise low-temperature handling solutions in certain routes; as projects scale, specialized equipment and reliability-focused service demand tend to follow.
  • Fleet lifecycle modernization: Older installed equipment supports upgrades, reconditioning, and compliance-driven improvements—creating a durable aftermarket component.

These drivers expand total addressable activity in both “build” and “support” cycles. Importantly, Chart’s installed-base service model can convert a portion of growth in infrastructure utilization into recurring revenue visibility.

⚠ Risk Factors to Monitor

  • Capital-cycle and project timing risk: Equipment-heavy revenue can be exposed to the timing of customer capex decisions across LNG, industrial gas, and hydrogen supply chains.
  • Execution and delivery risk: Cryogenic systems are complex; delays, cost overruns, or warranty/performance issues can compress margins.
  • Commodity and input cost exposure: Procurement cycles for materials and components can impact manufacturing economics.
  • Competitive pressure in engineered process equipment: Large industrial peers can compete for parts of value chains where bids emphasize price or general capability rather than cryogenic specialization.
  • Regulatory and safety compliance burden: Changes in safety standards and permitting requirements for LNG/hydrogen handling can affect design requirements and qualification pathways.
  • Technology-route uncertainty: Hydrogen and low-temperature processing adoption may favor different technical pathways; equipment demand remains tied to project choices and timelines.

📊 Valuation & Market View

The market typically values Chart-like industrial equipment/service firms using a blend of:

  • EV/EBITDA and operating margin expectations: Reflects the cyclical nature of equipment delivery and the importance of sustainable margins.
  • Revenue quality metrics (mix and aftermarket share): A higher proportion of service/aftermarket revenue generally improves earnings durability and downside protection versus pure capex cycles.
  • Order book/backlog conversion and service pipeline: Moving from awarded projects to delivered revenue drives how investors underwrite earnings power.

Key valuation drivers usually center on service penetration, normalized operating margins, and the sustainability of end-market capex programs for LNG and low-temperature gas infrastructure.

🔍 Investment Takeaway

Chart Industries offers a specialized cryogenic equipment and service platform with structurally advantaged customer stickiness. The moat is supported less by advertising or brand and more by engineering qualification barriers, safety-critical performance requirements, and an installed-base service ecosystem that can provide earnings resilience through industry cycles. For investors, the long-term thesis rests on continued LNG and low-temperature infrastructure investment, coupled with lifecycle modernization and aftermarket growth that converts infrastructure buildouts into recurring service economics.


⚠ AI-generated — informational only. Validate using filings before investing.

📰 Market News & Coverage

15 Stories Available

Real-time institutional reporting and market updates for GTLS.

reuters.com2026-05-22

EU regulators to decide on Baker Hughes' $13.6 billion Chart deal by June 26

EU antitrust regulators will decide by June 26 ​whether to clear oilfield services ‌firm Baker Hughes' $13.6 billion acquisition of Chart Industries , according to a ​European Commission filing.

zacks.com2026-04-30

Chart Industries (GTLS) Earnings Expected to Grow: What to Know Ahead of Q1 Release

Chart Industries (GTLS) doesn't possess the right combination of the two key ingredients for a likely earnings beat in its upcoming report. Get prepared with the key expectations.

defenseworld.net2026-04-23

Chart Industries (GTLS) to Release Earnings on Thursday

Chart Industries (NYSE: GTLS - Get Free Report) is anticipated to announce its Q1 2026 results before the market opens on Thursday, April 30th. Analysts expect the company to announce earnings of $2.34 per share and revenue of $1.0626 billion for the quarter. Individuals may visit the the company's upcoming Q1 2026 earning results page for

defenseworld.net2026-04-05

Braun Stacey Associates Inc. Sells 15,102 Shares of Chart Industries, Inc. $GTLS

Braun Stacey Associates Inc. lessened its holdings in Chart Industries, Inc. (NYSE: GTLS) by 20.5% in the undefined quarter, according to its most recent filing with the SEC. The firm owned 58,586 shares of the industrial products company's stock after selling 15,102 shares during the period. Braun Stacey Associates Inc. owned about 0.13%

fool.com2026-03-20

What's Behind a $49 Million Bet on This Energy Tech Stock Up 33% Amid Pending Buyout?

Whitebox Advisors added 242,395 shares of Chart Industries in the fourth quarter; the estimated trade size was $49.12 million based on quarterly average pricing. Meanwhile, the quarter-end position value increased by $51.92 million, reflecting both trading and stock price moves.

defenseworld.net2026-03-15

Angelo Gordon & CO. L.P. Makes New Investment in Chart Industries, Inc. $GTLS

Angelo Gordon and CO. L.P. acquired a new stake in shares of Chart Industries, Inc. (NYSE: GTLS) in the undefined quarter, according to the company in its most recent 13F filing with the Securities and Exchange Commission. The firm acquired 13,000 shares of the industrial products company's stock, valued at approximately $2,602,000. Several

defenseworld.net2026-03-15

Atlantic Investment Management Inc. Has $29.52 Million Position in Chart Industries, Inc. $GTLS

Atlantic Investment Management Inc. reduced its position in shares of Chart Industries, Inc. (NYSE: GTLS) by 46.3% in the third quarter, according to its most recent 13F filing with the Securities and Exchange Commission (SEC). The institutional investor owned 147,499 shares of the industrial products company's stock after selling 127,200 shares during the

defenseworld.net2026-03-07

Choreo LLC Sells 2,807 Shares of Chart Industries, Inc. $GTLS

Choreo LLC decreased its stake in Chart Industries, Inc. (NYSE: GTLS) by 58.5% in the undefined quarter, according to the company in its most recent disclosure with the Securities and Exchange Commission. The firm owned 1,993 shares of the industrial products company's stock after selling 2,807 shares during the period. Choreo LLC's holdings

fool.com2026-03-02

Chart Industries Just Delivered $1 Billion in Adjusted EBITDA, so Why Did One Investor Sell Off $54 Million in Stock?

No Street Capital sold 265,000 shares of Chart Industries in the fourth quarter; the estimated transaction value was $53.70 million based on Q4 2025 average price. Meanwhile, the quarter-end value of the stake decreased by $52.37 million, reflecting both trading and market price movement The post-trade holding stood at 110,000 shares valued at $22.69 million as of December 31, 2025.

zacks.com2026-02-27

Compared to Estimates, Chart Industries (GTLS) Q4 Earnings: A Look at Key Metrics

While the top- and bottom-line numbers for Chart Industries (GTLS) give a sense of how the business performed in the quarter ended December 2025, it could be worth looking at how some of its key metrics compare to Wall Street estimates and year-ago values.

zacks.com2026-02-27

Chart Industries (GTLS) Misses Q4 Earnings and Revenue Estimates

Chart Industries (GTLS) came out with quarterly earnings of $2.51 per share, missing the Zacks Consensus Estimate of $3.48 per share. This compares to earnings of $2.66 per share a year ago.

globenewswire.com2026-02-27

Chart Industries Reports Fourth Quarter and Full Year 2025 Financial Results

HOUSTON, Feb. 27, 2026 (GLOBE NEWSWIRE) -- Chart Industries, Inc. (NYSE: GTLS) today reported results for the fourth quarter and full year ended December 31, 2025.

defenseworld.net2026-02-25

First American Trust FSB Sells 20,995 Shares of Chart Industries, Inc. $GTLS

First American Trust FSB cut its position in Chart Industries, Inc. (NYSE: GTLS) by 95.0% in the third quarter, according to the company in its most recent disclosure with the Securities and Exchange Commission (SEC). The institutional investor owned 1,102 shares of the industrial products company's stock after selling 20,995 shares during the

defenseworld.net2026-02-23

Avalon Trust Co Has $15.33 Million Stock Holdings in Chart Industries, Inc. $GTLS

Avalon Trust Co decreased its stake in shares of Chart Industries, Inc. (NYSE: GTLS) by 5.5% in the undefined quarter, according to its most recent 13F filing with the SEC. The firm owned 76,594 shares of the industrial products company's stock after selling 4,485 shares during the period. Chart Industries accounts for about

defenseworld.net2026-02-21

BCK Capital Management LP Invests $4.13 Million in Chart Industries, Inc. $GTLS

BCK Capital Management LP bought a new stake in shares of Chart Industries, Inc. (NYSE: GTLS) during the undefined quarter, according to the company in its most recent 13F filing with the Securities and Exchange Commission. The institutional investor bought 20,628 shares of the industrial products company's stock, valued at approximately $4,129,000. Chart

📊 AI Financial Analysis

Powered by StockMarketInfo
Earnings Data: Q Ending 2026-03-31

"Headline (2026-03-31 / Q1): Revenue $884.8M and net income -$17.1M (net margin -1.9%). Operating income was $52.6M with an operating margin of 5.9%. EPS was not provided in the dataset for this quarter (eps=0), while prior quarters showed profitability (Q4 2025 net income +$53.2M; Q1 2025 net income +$49.5M). QoQ trend (Q4 2025 → Q1 2026): Revenue declined from $1.0796B to $884.8M (-18.1%). Net income deteriorated sharply from +$53.2M to -$17.1M (down $70.3M), with margins contracting materially (net margin 4.9% → -1.9%). Gross margin stayed broadly flat (28.7% → 28.4%), but profitability fell as pre-tax income turned negative (-3.0% vs +4.0% prior quarter). YoY trend (Q1 2025 → Q1 2026): Revenue rose from $1.0015B to $884.8M (down -11.6%), while net income declined from +$49.5M to -$17.1M (down -134.6%). Over the 4-quarter window, margins were volatile (notably negative in Q3 2025), and Q1 2026 returned to profitability pressure. Cash flow: Operating cash flow was -$248.0M and free cash flow -$272.8M, a major swing from positive FCF in Q4 2025 (+$66.2M), indicating working-capital/other cash impacts. Balance sheet resilience remains mixed for leverage: total assets were $9.69B, equity ~$3.16B, but net debt is still high at ~$3.52B and interest coverage weakened (0.72x). Shareholder returns: Stock price is up +66.9% over 1 year, which is strong momentum and should support total shareholder return (dividend yield is minimal in the provided ratios; no buybacks were recorded in Q1 2026). Valuation sentiment appears supportive (high multiples), but the quarter’s earnings/cash deterioration raises execution risk."

Revenue Growth

Neutral

Q1 2026 revenue of $884.8M fell 18.1% QoQ (from $1.0796B) and declined 11.6% YoY (from $1.0015B).

Profitability

Caution

Margins contracted: net margin swung from +4.9% (Q4 2025) to -1.9% (Q1 2026); operating margin fell from 12.0% to 5.9%. YoY net income dropped from +$49.5M to -$17.1M.

Cash Flow Quality

Neutral

Operating cash flow was -$248.0M and free cash flow -$272.8M in Q1 2026, a sharp deterioration vs positive Q4 2025 OCF (+$88.8M) and FCF (+$66.2M).

Leverage & Balance Sheet

Neutral

Equity is sizable ($3.16B) and total assets steady ($9.69B), but leverage remains high: net debt ~$3.52B and interest coverage weakened to ~0.72x.

Shareholder Returns

Strong

Strong momentum: +66.9% 1y stock gain. Dividend yield is very small in the provided data, and no buybacks were reported for Q1 2026.

Analyst Sentiment & Valuation

Neutral

Consensus target (~$193.8) is below the current price shown ($208.3), implying expectations may be slightly conservative despite strong price momentum.

Disclaimer:This analysis is AI-generated for informational purposes only. Accuracy is not guaranteed and this does not constitute financial advice.

Fundamentals Overview

Loading fundamentals overview...

Management sounded confident on demand visibility and backlog-driven newbuild plus growing aftermarket/RSL, reiterating full-year sales ($4.65B–$4.85B) and EBITDA ($1.175B–$1.225B). Operationally, Q1 showed strong margin recovery: adjusted operating income margin +190 bps and adjusted EBITDA margin +80 bps, with Specialty Products gross margin at 30.3% (>30% for first time since Q3 2022). However, the Q&A pressure centered on tariffs and macro risk framing: management’s tariff estimate is a gross ~$50M annualized (or ~$34M remainder-of-year if unmitigated) and—per Marc Bianchi—does not assume mitigations in the guidance math, though management claims “good progress” and specific actions (in-region sourcing, flexible manufacturing, exemptions, price increases, and duty-free aluminum parting sheets until Sept 2025). Macro risk was narrowed to industrial gas and hydrogen (Americas), with hydrogen project cancellations already seen once but no broader cancellation trend. Net: cautious because tariff mitigation is still actively being proven, despite unchanged guidance.

AI IconGrowth Catalysts

  • Woodside Louisiana LNG Phase 2 booked in Q1 using IPSMR process technology and equipment
  • First serial-run order for HLNG vehicle tanks with Volvo Aker (Q1)
  • Record Specialty Products gross margin >30% (30.3%)—first time above 30% since Q3 2022
  • Specialty Products backlog conversion growth in hydrogen, water treatment, and power generation
  • RSL aftermarket strength: carbon capture retrofit order for a coal-fired power plant (Q1)
  • Digital LNG dashboards testing at an LNG fueling-station customer in Europe; newly developed digital uptime tooling gaining traction
  • Data centers/AI demand support from installed base solutions (heat rejection, cryogenic storage, water treatment, digital monitoring)

Business Development

  • Woodside (LNG Phase 2) using IPSMR for liquefaction
  • Volvo Aker (first serial-run order for HLNG vehicle tanks)
  • Honeywell UOP (Abra aluminum heat exchanger order)
  • Space exploration customer (multiple tank and heat exchanger orders; > full-year 2024 orders in space exploration, HLNG vehicle tanks, nuclear, and marine)
  • Naon EDA (order for three regas plants in Europe)
  • Large industrial gas customer (multiple railcars; Q1)
  • Cheniere Sabine Pass (fans retrofit at a brownfield facility—favorable aftermarket feedback)
  • Customer mention: Europe nuclear application order for power generation using distillation recirculation and storage solutions (booked in April)

AI IconFinancial Highlights

  • Orders: $1.32B (+17.3% YoY), includes Woodside Louisiana LNG Phase 2
  • Sales: $1.0B; organically +6.6% YoY (FX headwind 1.3% per segment summary)
  • Gross margin: 33.9% (4th consecutive quarter above 33%)
  • Adjusted operating income margin: +190 bps (190-basis point expansion) driven by SG&A leverage/cost synergies
  • Adjusted EBITDA: $231.1M = 23.1% of sales (+80 bps)
  • EPS: reported adjusted diluted EPS $1.86 (+38.8% YoY); reported adjusted diluted earnings per share $0.99 (as stated)
  • Free cash flow: -$80.1M in Q1 (improvement of $55.6M vs Q1 2024), driven by seasonal cash outlays
  • Net leverage ratio: 2.91 at March 31, 2025; reiterated target net leverage 2.0–2.5 in 2025
  • Segment margins bps changes: CTS adjusted op margin +220 bps to 12.7%; HTS adjusted op margin +460 bps to 25.5%; Specialty Products adjusted op margin +560 bps to 18.9%; RSL adjusted op margin -270 bps to 32.4% (lower spare sales/timing)

AI IconCapital Funding

  • No material cash acquisitions or share repurchases until within target net leverage ratio (2.0–2.5)
  • CapEx guidance: 2025 anticipated at 2.0%–2.5% of sales
  • Q1 2025 free cash flow: -$80.1M (seasonal/customary uses)
  • 2025 year-end balance sheet policy: anticipate ~ $3B net debt
  • 2025 free cash flow target: $550M–$600M

AI IconStrategy & Ops

  • Automation/productivity: CapEx tied to compressors capacity and productivity/automation for throughput; tracking to medium-term 2026 goal of mid-30s gross margin
  • Chart business excellence to improve throughput; expanded manufacturing line productivity supporting margins and SG&A leverage
  • Aftermarket growth levers: expanded service/framework agreements +10.7% since end of 2024
  • E-commerce spares: website orders +9% in Q1 vs Q1 2024
  • In-region supply chain strategy and flexible manufacturing footprint (parts made in multiple locations) to reduce tariff exposure
  • RSL aftermarket expansion themes: screw compressors/axial fans expansion in Asia Pacific; recip compressors/steep turbines in the Middle East; brownfield retrofits and nitrogen rejection unit pipeline

AI IconMarket Outlook

  • Reiterated 2025 full-year outlook despite tariff uncertainty:
  • Sales: $4.65B–$4.85B
  • Adjusted EBITDA: $1.175B–$1.225B
  • Second half 2025 expected higher than first half due to timing of project revenue and service work in backlog
  • Orders timing expectation: Q2 2025 orders anticipated higher than Q2 2024
  • Net leverage: target sub-2.5 in 2025

AI IconRisks & Headwinds

  • Tariffs: gross annual estimated impact ~$50M; with 8 months remaining, remainder-of-year impact estimated ~$34M if not mitigated (as of yesterday)
  • Marc Bianchi clarification: tariff impact number does NOT assume mitigating actions; management indicates actions underway to bring the impact within guide range
  • China exposure mitigation: management stated gross exposure reduced by ~40% in the last week due to exemptions on China-specific inbound materials/commodity codes
  • Potential macro scenario risks centered on uncertainty in hydrogen in the Americas and industrial gas caution (management cites watch market; industrial gas orders increased sequentially in CTS by +10% from Q4 to Q1 but said watch market remains)
  • Backlog cancellation risk: only meaningful cancellation referenced was hydrogen project out of backlog; no trend of additional cancellations reported
  • Guidance high-end sensitivity: requires larger projects coming in first half to allow manufacturing time schedules (scheduling risk)
  • Seasonality: management sees no reason 2025 seasonality differs from prior years; expects typical 1Q→2Q patterns

Sentiment: MIXED

Note: This summary was synthesized by AI from the GTLS Q1 2025 earnings transcript. Financial data is complex; please verify all metrics against official SEC filings before making investment decisions.

📋 Official Regulatory 10-K / 10-Q SEC Filings

Direct authenticated documentation links to audited SEC database reports for GTLS.

SEC EDGAR Live Feed
Loading financial data and tables...
📁

SEC Filings (GTLS)

© 2026 Stock Market Info — Chart Industries, Inc. (GTLS) Financial Profile