Getty Realty Corp.

Getty Realty Corp. (GTY) Market Cap

Getty Realty Corp. has a market capitalization of $2.11B.

Price: $34.14

-0.10 (-0.29%)

Market Cap: 2.11B

NYSE · time unavailable

CEO: Christopher J. Constant

Sector: Real Estate

Industry: REIT - Retail

IPO Date: 1973-05-03

Website: https://www.gettyrealty.com

Getty Realty Corp. (GTY) - Company Information

Market Cap: 2.11B|Sector: Real Estate

Company Profile

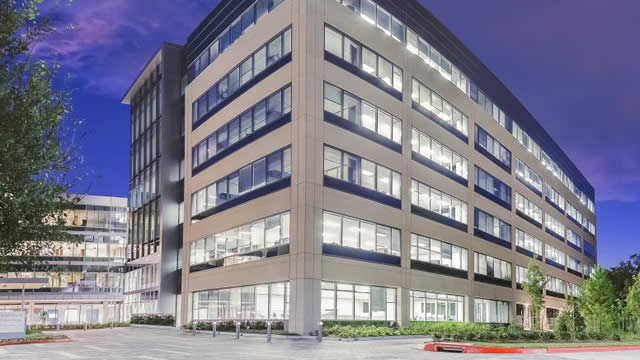
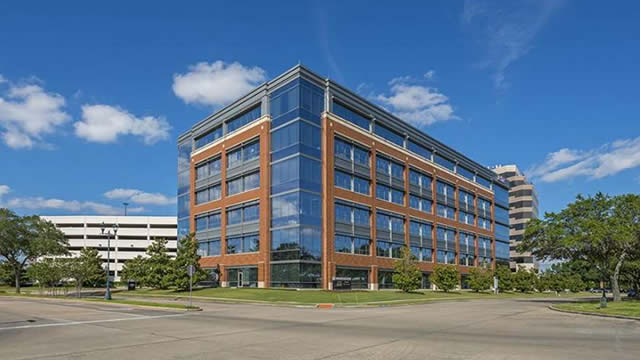
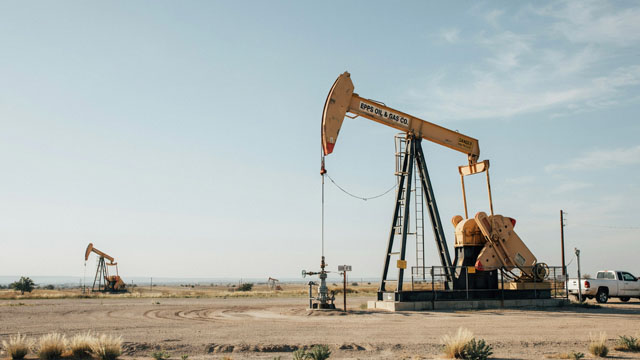
Getty Realty Corp. stands as a premier publicly traded real estate investment trust (REIT) in the United States, with its core business centered on the acquisition, rental, and funding of properties housing convenience stores and gas stations. By September 30, 2020, the company's extensive portfolio encompassed 896 properties under its direct ownership, alongside an additional 58 sites leased from external landlords, distributed across 35 states and the District of Columbia.

Analyst Sentiment

65%
Buy

From 8 Active Polls

1Y Forecast: $34.50

▲ +1.1% Potential Upside

Consensus Target Metrics

Low Bound

$33

Median

$35

High Bound

$36

Average

$35

Price & Moving Averages

Loading chart...

🎯 Wall Street Analyst Intelligence Report

1-Year structural target targets, chart projections, and sentiment maps.

Average 1Y Target
$34.50
▲ +1.05% Upside
Low Target
$33.00
-3% Risk
Median Target
$34.50
1% Mid
High Target
$36.00
5% Max
Consensus
Buy
8 / 14 Buys

Consensus Trend Projection

Trailing closures vs. 12-month metrics map.

Analyst Vote Distribution

Aggregate institutional coverage sentiment weights.

📊 Historical Valuation Multiples

Real-time Trailing Twelve Month (TTM) momentum side-by-side with discrete quarterly metrics.

Fiscal QuarterTTMQ2 2026Q1 2026Q4 2025Q3 2025Q2 2025Q1 2025Q4 2024Q3 2024
Period EndingTrailing 12MJun 30, 2026Mar 31, 2026Dec 31, 2025Sep 30, 2025Jun 30, 2025Mar 31, 2025Dec 31, 2024Sep 30, 2024
Market Cap ($M)2,1142,0091,9041,5861,4961,5281,7171,6581,726
Enterprise Value ($M)3,1803,0742,9032,6292,4422,4572,6302,5672,571
Price to Earnings Ratio (P/E)20.4423.8318.0714.5616.3628.7931.1819.3129.45
Price/Earnings-to-Growth Ratio (PEG)11.421.633.7316.256.429.61
Price to Sales Ratio (P/S)9.0734.0232.9126.1926.9128.7032.8131.2733.53
Price to Book Ratio (P/B)1.831.791.751.481.481.561.791.721.79
Price to Free Cash Flow Ratio (P/FCF)-172.98-18.4157.5747.4749.1844.2359.9746.2250.13
Enterprise Value to Sales (EV/Sales)52.0650.1943.4243.9246.1350.2548.4249.95
Enterprise Value to EBITDA (EV/EBITDA)11.3459.4652.8647.5720.5959.7761.9352.5062.10
Debt to Equity Ratio3.800.950.920.980.940.950.960.960.88

📘 Full Research Report

ℹ️

AI-Generated Research: This report is for informational purposes only.

```html

📘 GETTY REALTY REIT CORP (GTY) — Investment Overview

🧩 Business Model Overview

GETTY REALTY REIT CORP operates a specialty real estate model focused on owning and leasing retail properties tied to automotive fuel and convenience retailing. The value chain is straightforward: GTY acquires well-located sites, improves them when needed, and leases them to operating tenants under long-term arrangements that typically shift most property operating costs to the tenant. The core economic logic is location durability—customers follow the site for fuel and convenience access—while tenants depend on that specific address for traffic flow, brand footfall, and operational continuity.

This produces a portfolio-level, recurring income stream with property cash flows largely governed by lease contracts (rent escalators and renewal terms) and by tenant-site fit rather than by GTY’s ability to drive consumer demand directly.

💰 Revenue Streams & Monetisation Model

Revenue is dominated by lease income that is primarily contractual and recurring. Monetisation is driven by:

  • Base rent under net lease structures: recurring cash generation with tenant responsibility for many operating expenses.
  • Rent escalations: scheduled increases embedded in lease agreements that can partially offset inflationary pressures.
  • Lease re-leasing and redevelopment value: upside when properties are renewed, repositioned, or improved to support rent growth within the tenant ecosystem.

Margin drivers in this business are less about gross margin mechanics and more about (i) occupancy and lease duration, (ii) contractual cost pass-throughs, (iii) timing and size of capital expenditures, and (iv) property-level credit risk. A well-underwritten acquisition process—buying sites with durable tenancy and manageable landlord obligations—typically improves long-run cash yield.

🧠 Competitive Advantages & Market Positioning

GTY’s moat is primarily location-based switching costs and site scarcity, supported by underwriting and tenant-ecosystem knowledge. In practice, the tenant’s ability to move is constrained by high switching costs: replacing a convenience and fuel site requires securing a comparable address, rebuilding customer access and operational infrastructure, and navigating permitting and development timelines. The same site constraints make competitors’ acquisitions more difficult, particularly when demand concentrates in well-trafficked corridors.

Additional advantages include:

  • Tenant relationship depth and operational fit: specialized focus on fuel/convenience tenants improves lease execution and renewal outcomes versus generalized net-lease peers.
  • Underwriting selectivity: concentrating on properties where landlord obligations (capital needs and environmental exposure) can be modeled supports more consistent cash flow resilience.
  • Competitor 1: Realty Income (O) — diversified net-lease portfolio across many retail categories. Compared with GTY’s fuel/convenience specialization, Realty Income’s tenant mix is broader, which can diversify cash flow but can reduce focus-driven expertise.
  • Competitor 2: National Retail Properties (NNN) — net lease REIT with meaningful exposure to retail storefronts and other real estate types. NNN competes for stabilized net-lease cash flows, but GTY’s narrower site focus supports deeper tenant and location expertise.
  • Competitor 3: Gladstone Commercial (GOOD) — commercial REIT with a net-lease orientation across multiple property types. Gladstone competes in similar capital-market channels, while GTY maintains specialization in automotive fuel/convenience-linked real estate.

Overall, GTY competes on specialty underwriting and location durability, rather than attempting to match a broad-based net-lease portfolio across every retail sub-sector.

🚀 Multi-Year Growth Drivers

A 5–10 year investment horizon for GTY is supported by growth drivers that are structural for specialty net lease:

  • Persistent demand for convenience and accessible fuel retail locations: traffic-based convenience retailing tends to rely on established sites with customer routing behavior.
  • Rent escalator mechanics: long-lived contractual rent growth can compound over time as leases roll forward.
  • Acquisition pipeline and redeployment discipline: the specialty focus can expand the addressable set of sites where GTY can underwrite tenant-site fit and reasonable landlord capital requirements.
  • Refinancing and capital market access: incremental capital can be deployed to expand the portfolio when risk-adjusted acquisition spreads are attractive and leverage is managed conservatively.

While ultimate returns depend on lease roll schedules and acquisition discipline, the TAM for specialty retail sites remains anchored by urban/suburban travel patterns and the limited ability to rapidly create equivalent replacement sites.

⚠ Risk Factors to Monitor

  • Tenant credit and lease rollover risk: concentration in convenience/fuel operators means changes in tenant financial health or lease expirations can influence cash flow stability.
  • Environmental and remediation exposure: fuel-related properties can carry environmental liabilities; the magnitude and timing of remediation obligations are key underwriting inputs.
  • Interest rate and capital availability: higher borrowing costs can pressure acquisition economics and dividend coverage depending on how leverage is structured.
  • Property tax and regulatory changes: taxes and local regulations can affect net cash flows even when leases shift many operating costs.
  • Competitive acquisition intensity: net lease capital is cyclical; maintaining disciplined cap rate assumptions and expense modeling matters through the market cycle.

📊 Valuation & Market View

GTY, like other net-lease REITs, is typically valued through cash flow yield and stability rather than growth-rate narratives. Market pricing often tracks:

  • Cash flow resilience (AFFO/FFO quality): durability of tenant payments, expense pass-through, and rent escalator coverage.
  • Credit quality of tenants: stronger tenant balance sheets and lease structures generally support a lower risk premium.
  • Interest rate regime: REIT valuation can be sensitive to changes in real yields and the cost of capital.
  • Acquisition discipline: spreads versus replacement cost and the modeled landlord capital requirement influence long-run value creation.

Key valuation movers are therefore lease credit trends, expense pass-through effectiveness, and the ability to sustain portfolio-level cash flow without taking on uncompensated environmental or redevelopment risk.

🔍 Investment Takeaway

GTY offers a specialized net-lease model where location scarcity and tenant site dependence create practical switching costs for operating tenants. The primary long-term thesis is that disciplined acquisition underwriting and lease structuring can translate stable, recurring cash flows into compounding value over a full market cycle, provided that tenant credit, environmental exposure, and capital discipline remain within modeled bounds.


⚠ AI-generated — informational only. Validate using filings before investing.
```

📰 Market News & Coverage

15 Stories Available

Real-time institutional reporting and market updates for GTY.

defenseworld.net2026-07-30

Fifth Third Bancorp Has $549,000 Holdings in Getty Realty Corporation $GTY

Fifth Third Bancorp lifted its stake in Getty Realty Corporation (NYSE: GTY) by 808.1% during the undefined quarter, according to the company in its most recent Form 13F filing with the Securities and Exchange Commission. The fund owned 17,273 shares of the real estate investment trust's stock after acquiring an additional 15,371 shares

marketbeat.com2026-07-23

Getty Realty Q2 Earnings Call Highlights

Getty Realty NYSE: GTY reported higher second-quarter adjusted funds from operations and raised its full-year 2026 AFFO per-share guidance, citing continued investment activity, stable tenant performance and a strong capital position.

seekingalpha.com2026-07-23

Getty Realty Corp. (GTY) Q2 2026 Earnings Call Transcript

Getty Realty Corp. (GTY) Q2 2026 Earnings Call Transcript

seekingalpha.com2026-07-23

Getty Realty: This High-Quality REIT Is Still Being Overlooked

Getty Realty (GTY) remains a Strong Buy, with valuation still reflecting a significant discount to intrinsic value despite robust fundamentals. GTY delivered solid Q2 results: AFFO up 14.5%, occupancy up at 99.8%, and guidance raised once again, underscoring resilience amid macro headwinds while they continue investing. Balance sheet strength is evident: no debt maturities until 2028, $570M liquidity; sustainable 5.3% dividend yield with a 75–78% payout ratio could see a boost soon.

zacks.com2026-07-22

Getty Realty (GTY) Lags Q2 FFO and Revenue Estimates

Getty Realty (GTY) came out with quarterly funds from operations (FFO) of $0.62 per share, missing the Zacks Consensus Estimate of $0.63 per share. This compares to FFO of $0.59 per share a year ago.

globenewswire.com2026-07-22

Getty Realty Corp. Announces Second Quarter 2026 Results

– Completes $172 Million of Year-to-Date Investment Activity – – Increases 2026 Full Year Earnings Guidance –

globenewswire.com2026-07-21

Getty Realty Corp. Announces Regular Quarterly Cash Dividend

NEW YORK, July 21, 2026 (GLOBE NEWSWIRE) -- Getty Realty Corp. (NYSE: GTY) (“Getty” or the “Company”), a net lease REIT focused on convenience and automotive retail real estate, announced today that its Board of Directors declared a cash dividend of $0.485 per common share payable on October 8, 2026 to holders of record on September 24, 2026.

marketwatch.com2026-07-15

Small-cap outperformance is persisting — and these 15 quality stocks pay rich dividends

Think large caps are still the best bet? The data say you are looking in the wrong place.

247wallst.com2026-07-10

5 High-Yield Dividend Stocks Yielding 5% or More to Buy in July

Income investors got a mixed setup heading into the back half of 2026. Long rates are still stubborn, credit spreads are tight, and dividend growth has slowed at many blue chips.

seekingalpha.com2026-07-09

3 Solid Buys In High-Yield Net Lease REITs

This is an auspicious time to invest in REITs outyielding the no-risk rate by 100 bps or more. This article presents 3 Net Lease REITs that offer compelling yields, strong balance sheets, positive growth prospects, and favorable valuations. All 3 companies demonstrate superb occupancy, stable triple-net lease structures, and steady dividend growth, with yields outpacing Treasuries by 100 - 200 basis points.

zacks.com2026-07-02

PEB vs. GTY: Which Stock Should Value Investors Buy Now?

Investors interested in REIT and Equity Trust - Other stocks are likely familiar with Pebblebrook Hotel (PEB) and Getty Realty (GTY). But which of these two companies is the best option for those looking for undervalued stocks?

globenewswire.com2026-06-24

Getty Realty Corp. to Report Second Quarter 2026 Financial Results

NEW YORK, June 24, 2026 (GLOBE NEWSWIRE) -- Getty Realty Corp. (NYSE: GTY), a net lease REIT focused on convenience and automotive retail real estate, will release its financial results for the second quarter ended June 30, 2026 after the market closes on Wednesday, July 22, 2026. Getty Realty Corp. will host a conference call and webcast on Thursday, July 23, 2026, at 8:30 a.m.

seekingalpha.com2026-06-20

Getty Realty: High-Yield REIT At An Attractive Price

Getty Realty offers a 5.9% yield, robust dividend growth, and market-beating total returns, making it attractive for income-focused investors. GTY's diversified net lease portfolio, high occupancy, and disciplined acquisitions drive consistent AFFO and dividend per share growth. Strong balance sheet, ample liquidity, and no debt maturities until mid-2028 underpin dividend safety.

zacks.com2026-06-16

PEB or GTY: Which Is the Better Value Stock Right Now?

Investors with an interest in REIT and Equity Trust - Other stocks have likely encountered both Pebblebrook Hotel (PEB) and Getty Realty (GTY). But which of these two companies is the best option for those looking for undervalued stocks?

zacks.com2026-06-15

Getty Realty (GTY) Upgraded to Buy: Here's What You Should Know

Getty Realty (GTY) has been upgraded to a Zacks Rank #2 (Buy), reflecting growing optimism about the company's earnings prospects. This might drive the stock higher in the near term.

📊 AI Financial Analysis

Powered by StockMarketInfo
Earnings Data: Q Ending 2026-06-30

"GTY reported Q2’26 revenue of $59.1M and net income of $22.6M, with EPS of $0.35. YoY, revenue rose +10.9% (vs. Q2’25 $53.3M) and net income jumped +61.1% (vs. Q2’25 $14.0M). QoQ, revenue increased +2.1% (vs. Q1’26 $57.8M) while net income declined -15.3% (vs. $26.6M). Profitability was mixed. The quarter showed operating income of $35.1M and net margin of 38.2%, up meaningfully from Q2’25 (26.3%) but below Q1’26 (46.0%). Gross profit swung to a loss (-39.4% margin) in Q2’26 versus +40.3% in Q1’26 and +95.4% in Q2’25, indicating significant line-item volatility. Despite this, operating profit remained strong. Cash flow disclosure is limited/abnormal in Q2’26: operating cash flow and free cash flow are reported as 0, and there were no dividends/buybacks shown that quarter. Balance sheet strength deteriorated on leverage: total assets rose to $2.29B, while total equity increased to ~$1.12B; long-term debt is shown as zero in Q2’26, and net debt is slightly negative (-$4.8M), but this contrasts sharply with prior quarters and should be treated cautiously. Shareholder returns are supportive: the stock is up +19.7% over 1 year (capital appreciation) and the dividend yield is ~1.45%. Analysts’ consensus price target ($34.5) is slightly below the current price ($34.61), implying roughly neutral valuation sentiment."

Revenue Growth

Positive

Revenue grew +10.9% YoY (Q2’26 $59.1M vs. Q2’25 $53.3M) and rose +2.1% QoQ (vs. Q1’26 $57.8M), suggesting modest sequential expansion.

Profitability

Neutral

Net income grew +61.1% YoY, but fell -15.3% QoQ. Net margin improved vs. Q2’25 (38.2% vs. 26.3%) but contracted vs. Q1’26 (38.2% vs. 46.0%). Gross margin swung sharply negative in Q2’26.

Cash Flow Quality

Neutral

Q2’26 cash flow metrics are reported as 0 (operating cash flow/FCF), limiting confidence in cash conversion. Dividend and buyback activity also appears absent in the cash flow table for the quarter.

Leverage & Balance Sheet

Positive

Total assets increased to ~$2.29B and equity is ~$1.12B in Q2’26. However, the balance sheet shows large swings in debt/net debt vs. prior quarters (debt reported as 0), so resilience is directionally okay but data appears noisy.

Shareholder Returns

Positive

Total shareholder return tailwind from price appreciation: +19.72% over 1Y (strong momentum, though just below the >20% threshold). Dividend yield is ~1.45%.

Analyst Sentiment & Valuation

Neutral

Consensus target ($34.5) is slightly below the current price ($34.61), suggesting near-neutral valuation with modest upside/downside. No strong valuation re-rate signal from targets.

Disclaimer:This analysis is AI-generated for informational purposes only. Accuracy is not guaranteed and this does not constitute financial advice.

Fundamentals Overview

Loading fundamentals overview...

GTY delivered a strong Q2 with externally driven growth (annualized base rent +15% and AFFO/PS +5.1%) supported by sustained investment velocity. The company’s cost discipline improved meaningfully: G&A ratio down 60 bps in the quarter and 100 bps in first half. Coverage remains resilient with occupancy near full (99.8% excluding redevelopment) and trailing rent coverage at 2.5x; management attributed any sub-1x bucket changes to portfolio aging/ramp dynamics rather than tenant stress. Importantly, cap rate compression appears limited and transaction-specific—management reiterated mid-7% underwriting as the target range and cited improving cost of capital as enabling a broader deal opportunity set. Financially, liquidity is ample (>$570M) with no near maturities and active forward equity (gross ~$190.5M expected). Guidance rose again: FY2026 AFFO/PS to $2.52–$2.54. Key Q&A themes centered on QSR team traction, rent coverage sensitivity to fuel prices, and how pipeline and forward liquidity are managed to protect spreads and earnings growth.

AI IconGrowth Catalysts

  • Annualized base rent increased 15% (external growth via sale-leaseback underwriting and executed redevelopments)
  • AFFO per share growth of 5.1% in Q2 2026 (and 5% for first half 2026)
  • Investment activity deployment: $172.1M YTD at 7.6% initial cash yield supporting 2026 AFFO/PS guidance raise

Business Development

  • Take 5 Oil Change franchisee (Bergen County, NJ redevelopment; rent commenced during quarter)
  • Toyota/automotive service operators implied by expansion of automotive service/drive-thru QSR tenant base (6 new tenants added; majority automotive service/drive-thru QSR ~60% of ABR acquired)

AI IconFinancial Highlights

  • AFFO per share: $0.62 in Q2 2026; $1.25 for first half of 2026 (5.1% and 5% growth vs prior year periods)
  • G&A ratio (ex stock comp and nonrecurring retirement costs): 9.3% in Q2 2026, down 60 bps YoY; 9.2% for first half 2026, down 100 bps YoY
  • Guidance increase: full-year 2026 AFFO per share raised to $2.52–$2.54 from prior $2.50–$2.52 (investment activity does not include prospective investments/capital activities)
  • Liquidity/leverage: net debt to EBITDA 5.3x (4.3x including unsettled forward equity) within 4.5x–5.5x target; fixed charge coverage 4x
  • Lease portfolio durability: occupancy 99.8% ex active redevelopment; trailing 12-month rent coverage 2.5x

AI IconCapital Funding

  • Forward equity: settled ~1.5M shares for net proceeds ~$39.8M during quarter; entered new forward agreements for ~1.8M shares for anticipated gross proceeds ~$60.6M; total outstanding ~5.8M shares anticipated to raise gross proceeds ~$190.5M upon settlement
  • Debt/capital structure: ~$1.1B total debt; $1.0B senior unsecured notes at 4.6% weighted average interest, 5.5-year weighted average maturity; $73M drawn on $450M revolver
  • No debt maturities until June 2028
  • Total liquidity >$570M at quarter end

AI IconStrategy & Ops

  • Portfolio: 1,220 net lease properties; 1 active redevelopment site; weighted average lease term 10.3 years (excluding active redevelopment)
  • Investment mix: Q2 acquisitions $128.3M total, including acquisition of 35 properties ($117.7M) plus $10.6M incremental development funding; initial cash yield 7.4%; acquired assets weighted average lease term 18.3 years
  • Higher underwriting velocity attributed to improved cost of capital plus internal process/systems upgrades; pipeline and underwriting pace at or above record pace YTD
  • Redevelopment/asset management: rent commenced on NJ redevelopment leased to Take 5 Oil Change franchisee; extension of 1 unitary lease by 10 years (to Dec 31, 2039) increasing weighted average lease term and reducing ABR expiring through end of 2027 to ~2% of total ABR
  • Dispositions: sold 4 properties for gross proceeds ~$8.2M (described as selective; includes round-tripped former redevelopments with favorable disposition valuations vs equity market valuations)

AI IconMarket Outlook

  • Full-year 2026 AFFO per share guidance increased to $2.52–$2.54 (from $2.50–$2.52)
  • Management expects balanced volumes across the investment program as the year progresses; visibility in July into roughly last year’s acquisition activity with several months remaining
  • Next earnings call expected in October for Q3 2026 results

AI IconRisks & Headwinds

  • Credit loss risk remains modeled: 25 bps assumption retained in models (no realized credit losses to date), implying ongoing monitoring for variability
  • Cap rate compression cited as modest within activity blend; management frames as mid-7% ranges with volatility by transaction volume rather than broad deterioration
  • Macro/geopolitical volatility acknowledged, but management reports no material consumer demand deterioration across core categories and stable rent coverage

Q&A: Analyst Interest

  • QSR strategy/team expansion: Management said QSR momentum is driven by success of a dedicated hire plus time needed to build relationships through business development. They expect quarter-to-quarter wins to continue and anticipate balanced volumes across the investment program, including automotive retail asset classes, as the year unfolds.
  • Rent coverage and fuel/oil-price sensitivity: Management reaffirmed trailing rent coverage of 2.5x and said sub-1x bucket movement came from cars washes aging into reporting, not tenant deterioration. For convenience stores, they cited Q1 fuel margins $0.46/gallon (+10% vs Q1 2025) and expected margins to hold as tenants pass price swings.
  • Visibility/funding philosophy: Management explained pipeline is “under contract” at reporting and does not capture deals closing within the interquarter window, so analysts shouldn’t overfit incremental pipeline movements. On forward liquidity, they emphasized balancing funding risk and long-term spreads, avoiding “too long” prefunding that could reduce earnings by locking equity at lower prices.

Sentiment: POSITIVE

Note: This summary was synthesized by AI from the GTY Q2 2026 (quarter ended June 30, 2026) earnings transcript. Financial data is complex; please verify all metrics against official SEC filings before making investment decisions.

📋 Official Regulatory 10-K / 10-Q SEC Filings

Direct authenticated documentation links to audited SEC database reports for GTY.

SEC EDGAR Live Feed
Loading financial data and tables...
📁

SEC Filings (GTY)

© 2026 Stock Market Info — Getty Realty Corp. (GTY) Financial Profile