Ibotta, Inc.

Ibotta, Inc. (IBTA) Market Cap

Ibotta, Inc. has a market capitalization of $641M.

Price: $24.00

-2.39 (-9.06%)

Market Cap: 641.01M

NYSE · time unavailable

CEO: Bryan W. Leach

Sector: Technology

Industry: Software - Application

IPO Date: 2024-04-19

Website: https://www.ibotta.com

Ibotta, Inc. (IBTA) - Company Information

Market Cap: 641.01M|Sector: Technology

Company Profile

Ibotta, Inc. operates as a technology firm specializing in digital promotions. Its core offering, the Ibotta Performance Network (IPN), enables consumer packaged goods (CPG) brands to distribute digital offers directly to consumers. Through this IPN, the company extends its promotional services to a diverse range of partners, including publishers, retailers, and advertisers. Founded in 2011, this Denver, Colorado-based organization was initially known as Zing Enterprises, Inc. before officially rebranding to Ibotta, Inc. in 2012.

Analyst Sentiment

56%
Buy

From 9 Active Polls

1Y Forecast: $37.67

▲ +57.0% Potential Upside

Consensus Target Metrics

Low Bound

$28

Median

$40

High Bound

$45

Average

$38

Price & Moving Averages

Loading chart...

🎯 Wall Street Analyst Intelligence Report

1-Year structural target targets, chart projections, and sentiment maps.

Average 1Y Target
$37.67
▲ +56.96% Upside
Low Target
$28.00
17% Risk
Median Target
$40.00
67% Mid
High Target
$45.00
88% Max
Consensus
Buy
8 / 9 Buys

Consensus Trend Projection

Trailing closures vs. 12-month metrics map.

Analyst Vote Distribution

Aggregate institutional coverage sentiment weights.

📊 Historical Valuation Multiples

Real-time Trailing Twelve Month (TTM) momentum side-by-side with discrete quarterly metrics.

Fiscal QuarterTTMQ1 2026Q4 2025Q3 2025Q2 2025Q1 2025Q4 2024Q3 2024Q2 2024
Period EndingTrailing 12MMar 31, 2026Dec 31, 2025Sep 30, 2025Jun 30, 2025Mar 31, 2025Dec 31, 2024Sep 30, 2024Jun 30, 2024
Market Cap ($M)6417245978101,0421,2991,9991,8892,194
Enterprise Value ($M)5025844366128171,0261,6501,5501,879
Price to Earnings Ratio (P/E)-73.62-17.42-148.76127.05104.69586.116.5627.50-13.58
Price/Earnings-to-Growth Ratio (PEG)-23.5260.852.26-2.00
Price to Sales Ratio (P/S)1.888.776.749.7312.1215.3620.3219.1624.96
Price to Book Ratio (P/B)2.332.912.082.462.943.244.375.006.10
Price to Free Cash Flow Ratio (P/FCF)8.3226.5029.4476.4355.2872.30102.8451.5171.06
Enterprise Value to Sales (EV/Sales)7.084.927.359.4912.1316.7715.7221.37
Enterprise Value to EBITDA (EV/EBITDA)65.67-90.15160.7994.19166.14387.5799.4556.85-67.31
Debt to Equity Ratio-18.230.100.090.080.070.060.010.01

📘 Full Research Report

ℹ️

AI-Generated Research: This report is for informational purposes only.

📘 IBOTTA INC CLASS A (IBTA) — Investment Overview

🧩 Business Model Overview

IBOTTA operates a digital performance-marketing platform that connects three sides: consumer app users, retailers/CPG brands, and advertising partners (e.g., publishers and affiliates). Consumers engage with offers and receive rebates or rewards when purchases are made. Those purchase outcomes are tracked and verified through the platform, allowing advertisers to pay based on measurable results (typically post-transaction). The company’s operational value chain therefore centers on (1) demand activation via offers, (2) accurate attribution and verification, and (3) monetizing conversion outcomes by taking a negotiated share from advertising budgets.

💰 Revenue Streams & Monetisation Model

Monetisation is primarily performance-based, with revenue driven by advertising spend tied to completed consumer redemptions rather than simple impressions. This creates an outcomes-oriented model where margin dynamics depend on “take rate” mechanics, verification efficiency, and the economics of customer acquisition and retention. Key monetisation characteristics include:

  • Transactional / performance revenue: Predominantly tied to redeemed offers and conversion outcomes; margin can scale with volume if incremental verification and fulfillment costs grow slower than incremental revenue.
  • Platform revenue (contracted arrangements): Technology and managed services fees may exist alongside performance components, depending on advertiser/publisher contracts.
  • Margin drivers: Mix of advertiser categories, redemption rates, fraud controls, and operating leverage from technology-led attribution and customer servicing.

🧠 Competitive Advantages & Market Positioning

IBOTTA’s competitive position is best understood as a data-and-transaction verification marketplace with meaningful switching costs. Advertisers and publishers develop operational dependence on Ibotta’s offer mechanics, attribution accuracy, and measurement processes. Over time, performance partners are incentivized to remain within an ecosystem that produces reliable conversion tracking and reporting, particularly when campaigns require consistent verification.

Key moats:

  • High Switching Costs (data gravity & workflow integration): Advertisers/publishers integrate offer feeds, reporting, and campaign workflows. Recreating comparable measurement reliability and operational cadence is costly, and performance learning is path-dependent.
  • Verification & fraud controls: Reliable tracking of redemption and purchase outcomes is a structural requirement in performance marketing. Strong verification reduces wasted spend and sustains advertiser confidence.
  • Two-sided engagement loops: Consumer utilization supports advertiser offer depth, which improves consumer engagement, which then supports further conversion volume—an ecosystem dynamic that can be difficult to replicate quickly.

Competitive benchmarking (primary competitors):

  • Rakuten Advertising: Also operates in performance/affiliate-driven monetisation and commerce media. Rakuten competes for advertiser budgets and publisher distribution, with strengths rooted in broader network reach. Ibotta’s focus remains concentrated on retail/CPG rebate-style activation and conversion verification.
  • Quotient (Coupon and loyalty media networks; legacy coupon/redemption ecosystem): Competes in monetizing coupon engagement and retail offers through networks and data. Ibotta’s differentiation centers on its app-driven offer experience and outcome verification mechanics.
  • Fetch Rewards (receipt/rewards ecosystem) and similar consumer offer platforms: Competes for consumer engagement and redemption behavior. Ibotta competes by pairing consumer activation with advertiser measurement and a network of performance partners.

Compared with these rivals, IBOTTA’s industry focus is more tightly aligned to retail/CPG offer activation with measurable purchase outcomes, which supports the development of repeatable advertiser workflows and persistent measurement dependence.

🚀 Multi-Year Growth Drivers

Growth is supported by structural expansion in performance marketing and the broader shift toward measurable, conversion-based advertising. Over a 5–10 year horizon, primary drivers include:

  • Retail media & measurable commerce advertising: Retailers and CPG brands increasingly value campaigns with reliable attribution, verified conversions, and controllable budgets.
  • Shift from broad targeting to outcome-based spend: Advertisers seeking efficiency can reallocate budgets toward performance models with measurable impact.
  • Expansion of offer density and retailer coverage: Increasing breadth of participating retailers/brands can lift consumer engagement and improve advertiser campaign reach.
  • Publisher and affiliate channel growth: A larger partner ecosystem can increase incremental traffic and improve campaign scalability without proportionate increases in fixed costs.
  • Data improvements and automation: Ongoing enhancements to targeting, attribution, fraud mitigation, and user experience can strengthen both conversion performance and advertiser retention.

⚠ Risk Factors to Monitor

  • Privacy regulation and tracking constraints: Changes to mobile/consumer tracking practices can impair attribution and require operational redesign or reliance on less granular signals.
  • Fraud and redemption abuse: Performance models are exposed to adversarial behavior. Weakening verification can harm advertiser ROI and increase support costs.
  • Advertiser budget cyclicality: Performance marketing budgets can tighten when CPG and retail promotional spend is pressured.
  • Competitive intensity in incentives: Competitors offering stronger consumer rewards or broader networks may pressure offer economics and take-rate structures.
  • Concentration risk: Dependence on a limited set of large retailer/brand partners or publisher channels can increase negotiating leverage and churn risk.
  • Technology execution: Attribution, identity resolution, and app/partner integrations must remain dependable; disruptions can reduce conversion measurement quality.

📊 Valuation & Market View

Market valuation for performance marketing and software-enabled marketplaces typically reflects a combination of (1) revenue growth durability, (2) gross margin trajectory tied to verification efficiency and operating leverage, and (3) repeatability of advertiser/publisher retention. Investors often anchor to multiples such as EV/Sales or EV/Revenue growth profiles rather than asset-based measures, with multiple expansion generally linked to strengthening take-rate durability, improving contribution margin, and evidence that customer acquisition and partner scaling remain efficient. Key valuation sensitivities include changes in marketplace economics (conversion rates, redemption costs, fraud rates) and indicators of advertiser stickiness.

🔍 Investment Takeaway

IBOTTA’s long-term case rests on a performance-marketing marketplace with switching costs derived from measurement workflow integration, outcome verification reliability, and data gravity across advertiser and publisher partners. If attribution remains robust amid evolving privacy constraints and if offer economics sustain after competitive and regulatory pressures, the platform can compound engagement volume and advertiser spend share over time. The core underwriting focus should be on durability of unit economics (verification efficiency and take-rate mechanics), partner retention, and resilience of conversion measurement.


⚠ AI-generated — informational only. Validate using filings before investing.

📰 Market News & Coverage

15 Stories Available

Real-time institutional reporting and market updates for IBTA.

seekingalpha.com2026-07-21

Ibotta: A Credible Network Pivot That Is Already Priced In

Ibotta, Inc. is rated Hold, with a $32 target, as the current valuation reflects both risks and upside from its business transition. The high-margin D2C app is in secular decline, with Q1 D2C revenue down 25% and margins contracting sharply. Growth in the lower-margin Ibotta Performance Network is not yet offsetting D2C losses, resulting in overall revenue and margin declines.

businesswire.com2026-07-06

Ibotta To Announce Second Quarter 2026 Financial Results on August 3, 2026

DENVER--(BUSINESS WIRE)--Ibotta (NYSE: IBTA), which operates the largest digital promotions network in North America, announced today that it will report second quarter 2026 financial results after the market closes on August 3, 2026. Management will host a conference call and webcast to discuss Ibotta's financial results, recent developments, and business outlook at 2:30 p.m. MT/4:30 p.m. ET following the release of the financial results. What: Ibotta Second Quarter 2026 Financial Results Conf.

marketbeat.com2026-05-10

Ibotta Q1 Earnings Call Highlights

Ibotta NYSE: IBTA reported first-quarter results ahead of its prior guidance and said it still expects to return to year-over-year revenue growth in the third quarter of fiscal 2026, as the digital promotions company points to improving offer supply, growing third-party publisher activity and new partnerships with Uber and Giant Eagle.

businesswire.com2026-05-08

Ibotta to Participate in Upcoming Investor Conferences

DENVER--(BUSINESS WIRE)--Ibotta, Inc. (NYSE: IBTA), the performance marketing platform for promotions, announced today that company executives will participate in the following investor events: On May 13, 2026 at 10:30 a.m. PT/1:30 p.m. ET, Chief Financial Officer Matt Puckett will participate in a fireside chat at the 21st Annual Needham Technology, Media, & Consumer Conference in New York. A webcast of the event will be available here. On June 2, 2026 at 3 p.m. PT/6 p.m. ET, Chief Revenue.

seekingalpha.com2026-05-07

Ibotta, Inc. (IBTA) Q1 2026 Earnings Call Transcript

Ibotta, Inc. (IBTA) Q1 2026 Earnings Call Transcript

zacks.com2026-05-06

Ibotta (IBTA) Reports Q1 Loss, Tops Revenue Estimates

Ibotta (IBTA) came out with a quarterly loss of $0.43 per share versus the Zacks Consensus Estimate of a loss of $0.21. This compares to earnings of $0.02 per share a year ago.

businesswire.com2026-05-06

Ibotta Reports First Quarter 2026 Financial Results

DENVER--(BUSINESS WIRE)--Ibotta, Inc. (NYSE: IBTA), the performance marketing platform for promotions, today announced financial results for the first quarter ended March 31, 2026. “We started the year with strong operational momentum, delivering first quarter results that exceeded our expectations. This performance was driven by disciplined execution with our core product offering and the continued success of our LiveLift pilots,” said Ibotta CEO and Founder, Bryan Leach. “The expansion of the.

businesswire.com2026-05-06

Giant Eagle Taps Ibotta as its Exclusive Digital Promotions Partner in Support of its "Because It Matters" Value Strategy

DENVER & PITTSBURGH--(BUSINESS WIRE)--Ibotta (NYSE: IBTA), North America's leading digital promotions network, today announced a landmark exclusive partnership with Giant Eagle, Inc., one of the nation's largest multi-format food and pharmacy retailers. Giant Eagle has joined the Ibotta Performance Network, selecting Ibotta as its exclusive provider of digital promotions across its 200+ supermarkets and digital platforms. The partnership represents a significant step forward in Giant Eagle's re.

defenseworld.net2026-04-19

Ibotta (NYSE:IBTA) and Agrify (NASDAQ:AGFY) Head-To-Head Analysis

Ibotta (NYSE: IBTA - Get Free Report) and Agrify (NASDAQ: AGFY - Get Free Report) are both small-cap business services companies, but which is the superior stock? We will compare the two companies based on the strength of their earnings, analyst recommendations, valuation, dividends, risk, profitability and institutional ownership. Institutional and Insider Ownership 6.0% of Agrify shares

businesswire.com2026-04-09

Ibotta To Announce First Quarter 2026 Financial Results on May 6, 2026

DENVER--(BUSINESS WIRE)--Ibotta (NYSE: IBTA), which operates the largest digital promotions network in North America, announced today that it will report first quarter 2026 financial results after the market closes on Wednesday, May 6, 2026. Management will host a conference call and webcast to discuss Ibotta's financial results, recent developments, and business outlook at 2:30 p.m. MT/4:30 p.m. ET following the release of the financial results. What: Ibotta First Quarter 2026 Financial Result.

defenseworld.net2026-03-27

Analyzing Invesco Alerian Galaxy Blckchain Users & Decntralizd Comm. ETF (OTCMKTS:BLKCF) and Ibotta (NYSE:IBTA)

Ibotta (NYSE: IBTA - Get Free Report) and Invesco Alerian Galaxy Blckchain Users and Decntralizd Comm. ETF (OTCMKTS:BLKCF - Get Free Report) are both business services companies, but which is the better business? We will compare the two businesses based on the strength of their profitability, valuation, institutional ownership, dividends, risk, analyst recommendations and earnings. Profitability

businesswire.com2026-03-25

Uber Joins the Ibotta Performance Network in Exclusive, Multi-Year Partnership

DENVER & SAN FRANCISCO--(BUSINESS WIRE)--Ibotta, Inc. (NYSE: IBTA), the performance marketing platform for promotions, today announced a partnership with Uber Technologies, Inc. (NYSE: UBER) to deliver Ibotta-powered digital promotions across Uber's grocery and retail ecosystem in the United States. This partnership strengthens the Ibotta Performance Network's existing marketplace presence and gives CPG brands a direct path to shoppers at the final stage of the funnel — the point of purchase. T.

businesswire.com2026-03-11

Ibotta Announces a $100 Million Increase to Its Share Repurchase Program

DENVER--(BUSINESS WIRE)--Ibotta, Inc. (NYSE: IBTA), the performance marketing platform for promotions, announced that its Board of Directors authorized the purchase of up to an additional $100 million of the Company's Class A common stock, effective immediately. This new authorization follows prior Board approval for $300 million repurchase of the Company's Class A common stock. “This new authorization reflects the Board's continued confidence in our long-term growth prospects and our commitmen.

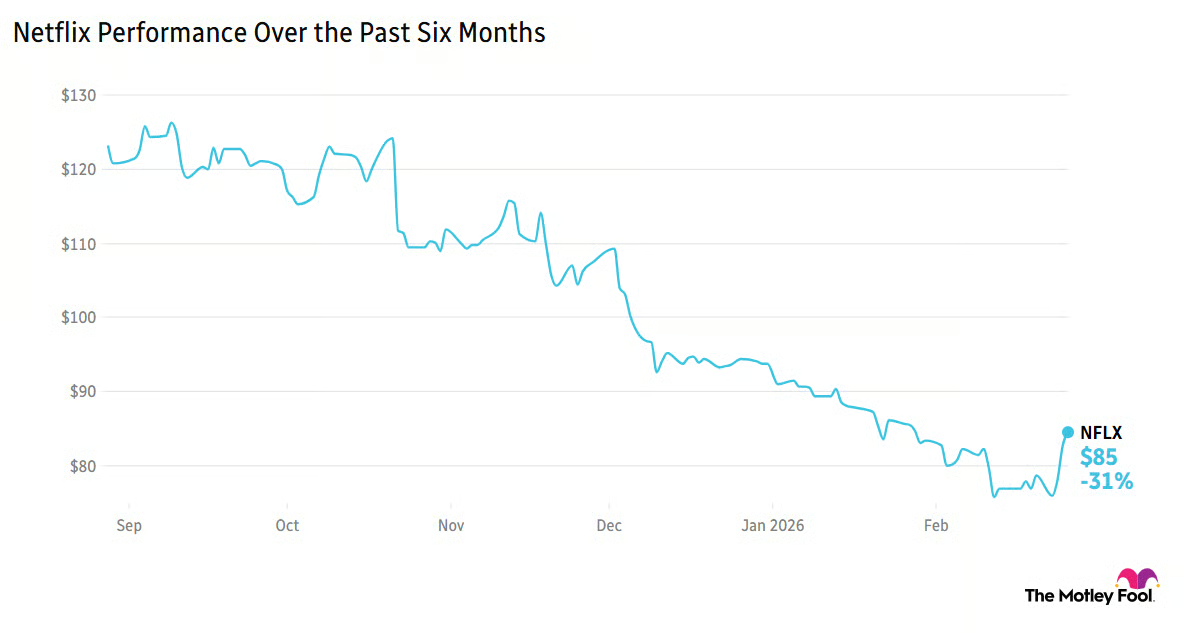
fool.com2026-02-27

Breakfast News: Investors Cheer Netflix's 'Loss'

Paramount beats Netflix in Warner bidding, Nvidia and Nasdaq fall on AI fears, and more

seekingalpha.com2026-02-25

Ibotta, Inc. (IBTA) Q4 2025 Earnings Call Transcript

Ibotta, Inc. (IBTA) Q4 2025 Earnings Call Transcript

📊 AI Financial Analysis

Powered by StockMarketInfo
Earnings Data: Q Ending 2026-03-31

"IBTA reported Q1’26 revenue of $82.5M and net income of -$10.3M (EPS -$0.43). Versus Q1’25, revenue increased by 0.7% (from $84.6M to $82.5M, essentially flat/slightly down), while net income deteriorated materially (from +$0.6M to -$10.3M), a swing of about -$10.9M YoY. QoQ, revenue fell 6.9% (from $88.5M in Q4’25), and net income declined sharply (from -$1.0M to -$10.3M). Profitability weakened: gross margin contracted to 76.4% from 79.4% in Q4’25, while operating margin swung from -1.9% to -13.1% and net margin fell to -12.5%. Cash flow was positive despite losses: operating cash flow was +$30.4M and free cash flow +$27.3M in Q1’26. Balance sheet resilience remains strong but is trending weaker—cash declined to $164.6M from $186.6M in Q4’25, total assets fell to $479.9M from $525.9M, and equity decreased to $249.0M from $287.7M, reflecting cumulative retained losses (negative equity base). There is no dividend and no buyback activity reported in Q1’26. Shareholder returns likely reflect price momentum: the stock is down -22.4% over 1 year (negative momentum), partially offset by +53.9% YTD and +12.1% over 6 months."

Revenue Growth

Fair

Revenue was essentially flat YoY (+0.7% from Q1’25) but down QoQ (-6.9% from Q4’25), indicating a soft near-term trajectory.

Profitability

Neutral

Net income swung from +$0.6M in Q1’25 to -$10.3M in Q1’26 (down ~10.9M YoY). QoQ net income deteriorated from -$1.0M to -$10.3M, and net margin fell to -12.5% from -1.1% in Q4’25.

Cash Flow Quality

Neutral

Despite losses, Q1’26 operating cash flow was +$30.4M and free cash flow +$27.3M. However, cash decreased QoQ (cash -$22.0M), so quality is supported but not strengthening.

Leverage & Balance Sheet

Fair

No short-term debt and modest total debt (~$25.3M). Liquidity remains adequate (current ratio ~1.80), but assets and equity declined QoQ (assets $525.9M->479.9M; equity $287.7M->249.0M), reflecting ongoing pressure.

Shareholder Returns

Caution

No dividends and no buybacks reported in Q1’26. Price performance is weak on a 1-year basis (-22.4%), which weighs heavily; YTD is strong (+53.9%) but does not offset the negative longer momentum.

Analyst Sentiment & Valuation

Fair

Consensus target (~$81.4) is above the current price ($35.25), implying upside. However, wide target range ($26-$114) suggests uncertainty given ongoing profitability deterioration.

Disclaimer:This analysis is AI-generated for informational purposes only. Accuracy is not guaranteed and this does not constitute financial advice.

Fundamentals Overview

Loading fundamentals overview...

Ibotta’s Q1 2026 results show stabilization and partial recovery: revenue was down 2% YoY to $82.5M, but adjusted EBITDA of $8.7M beat the guidance midpoint by 25%. Redemption revenue nearly recovered (-1% YoY), driven by +15% redeemer growth and +12% YoY third-party publisher redemption revenue, while direct-to-consumer remains weak (-25% YoY), indicating continued channel shift. However, monetization is still pressured: redemptions per redeemer fell 6% YoY and redemption revenue per redemption declined 7%, attributed to offer quantity/quality mix. Gross margin fell ~300 bps YoY to 78% and operating expense intensity rose ~470 bps, reflecting elevated sales/technology transformation costs, though free cash flow jumped 56% to $23.3M. Guidance points to sequential improvement in Q2 and a low-single-digit YoY revenue growth return in Q3, assuming only modest ramp from Uber and Giant Eagle (offer supply remains the governor). LiveLift appears on track but is still modestly contributing until eligibility requirements loosen.

AI IconGrowth Catalysts

  • Core promotions product demonstrating strong market fit
  • LiveLift early positive feedback; repeat-user behavior stable with ~80% re-up rates among completed campaigns and ~60% of LiveLift campaigns from repeat users
  • Sales execution deepening/broadening offer supply; “go-to-market” transformation enabling upstream client planning engagement

Business Development

  • Uber: added in late March 2026; multiyear exclusive partnership; later this year Ibotta digital promotions expected to appear within Uber, Uber Eats, and Postmates apps
  • Giant Eagle: announced as joining the Ibotta Performance Network; multiyear exclusive partnership (transition to Ibotta to access a more robust/relevant offer gallery)

AI IconFinancial Highlights

  • Delivered revenue $82.5M (down 2% YoY) and adjusted EBITDA $8.7M (25% above guidance midpoint); non-GAAP gross margin 78%, down ~300 bps YoY
  • Redemption revenue $73M (down ~1% YoY; -$0.4M); almost fully recovered YoY vs prior quarter declines (-15% in Q3 2025, -5% in Q4 2025)
  • Third-party publisher redemption revenue $54M (+12% YoY); direct-to-consumer redemption revenue $19M (-25% YoY) with shift to third-party publishers
  • Total redeemers 19.7M (+15% YoY); redemptions per redeemer 4.5 (-6% YoY); redemption revenue per redemption $0.83 (flat vs Q4, -7% YoY) driven by mix/offer quantity-quality
  • Adjusted EBITDA margin 11% (non-GAAP net income per diluted share $0.24); free cash flow $23.3M (+56% YoY)
  • Operating expense pressure: non-GAAP operating expenses 71% of revenue (+~470 bps YoY) driven by +17% sales & marketing (sales labor, Lift studies, B2B marketing) and partially offset by -21% R&D (higher capitalization and reallocation to cost of revenue)
  • Q1 guidance outperformance cited: revenue and adjusted EBITDA both 3% and 25% above midpoint, respectively

AI IconCapital Funding

  • Repurchased ~1.9M shares for ~$45M in Q1 at avg price $22.92
  • Cash and cash equivalents: $164.6M at quarter end
  • Share repurchase authorization: $90.3M remaining after Q1 spend; authorization increased by $100M on March 11
  • Free cash flow: $23.3M generated in Q1 (+56% YoY)

AI IconStrategy & Ops

  • LiveLift scaling requires greater automation: building a more sophisticated programmatic API layer; refining underlying models; AI enablement (documenting processes, SOPs, and simplifying product catalog)
  • Offer-supply governor on near-term growth: management expects offer supply to limit incremental demand capture from expanded publisher network
  • Q1 sales enablement and transformation updates: B2B marketing/training/enablement and client-specific insights; “multi-threading” outreach across client organizations
  • Cost allocation change impacting non-GAAP presentation: depreciation and amortization now included in non-GAAP operating expenses

AI IconMarket Outlook

  • Q2 2026 guidance: revenue $82M–$86M (2% YoY decline at midpoint; 2% sequential increase vs Q1 at midpoint)
  • Q2 adjusted EBITDA: $9M–$12M (about 12.5% adjusted EBITDA margin at midpoint)
  • Q2 assumption: at midpoint, redemption revenue returns to growth for the first time since Q1 2025
  • Q3 expectation: return to year-over-year growth in total revenue in the low single-digit range
  • Assumed impact from new publishers: immaterial impact in Q2; small benefit in 2H 2026 with ramp from testing/piloting

AI IconRisks & Headwinds

  • Redemptions per redeemer declined (-6% YoY) and redemption revenue per redemption fell (-7% YoY), driven by both quantity and quality of offers available per redeemer
  • Direct-to-consumer redeemers continued to pressure results (-25% YoY DTC redemption revenue) due to shift to third-party publishers
  • Near-term revenue expansion constrained by offer supply being the governor on demand-side gains from new publishers
  • Technology investment continues: cost of revenue gross margin down ~300 bps YoY and operating expense intensity up ~470 bps YoY
  • No specific numeric tariff/energy/yield risk given; management acknowledged macro/value sensitivity but framed spending as largely nondiscretionary

Q&A: Analyst Interest

  • LiveLift economics/margin outlook: Management said LiveLift does not materially change the margin profile versus core; gross/EBITDA expansion depends on investments lapping by year end. They expect the expense ramp to slow versus revenue growth as top-line stabilizes and LiveLift adoption grows.
  • Uber partnership progress and monetization: Management described Uber rollout as stepwise, not instant full activation across customer base, and stated they’re in early deployment with technology already built. They expect working on measurement/personalization and best practices to translate into strong redemption rates similar to the category.
  • Q3 revenue inflection assumptions: Management (Matt) said sequential improvement is driven by redemption revenue trends improving Q2 vs Q1 and Q3 vs Q2, with no step change from LiveLift adoption. They assumed only modest impact from Uber and Giant Eagle: less in Q3 and more in Q4.

Sentiment: POSITIVE

Note: This summary was synthesized by AI from the IBTA Q1 2026 earnings transcript. Financial data is complex; please verify all metrics against official SEC filings before making investment decisions.

📋 Official Regulatory 10-K / 10-Q SEC Filings

Direct authenticated documentation links to audited SEC database reports for IBTA.

SEC EDGAR Live Feed
No recent 10-K available.
No recent 10-Q available.
Loading financial data and tables...
📁

SEC Filings (IBTA)

© 2026 Stock Market Info — Ibotta, Inc. (IBTA) Financial Profile