Insteel Industries, Inc.

Insteel Industries, Inc. (IIIN) Market Cap

Insteel Industries, Inc. has a market capitalization of $552.7M.

Price: $28.44

β–Ό -0.34 (-1.18%)

Market Cap: 552.68M

NYSE Β· time unavailable

CEO: Howard Osler Woltz

Sector: Industrials

Industry: Manufacturing - Metal Fabrication

IPO Date: 1992-03-17

Website: https://www.insteel.com

Insteel Industries, Inc. (IIIN) - Company Information

Market Cap: 552.68M|Sector: Industrials

Company Profile

Insteel Industries, Inc., together with its subsidiaries, manufactures and markets steel wire reinforcing products for concrete construction applications. The company offers prestressed concrete strand (PC strand) and welded wire reinforcement (WWR) products. Its PC strand is a seven-wire strand that is used to impart compression forces into precast concrete elements and structures providing reinforcement for bridges, parking decks, buildings, and other concrete structures. The company's WWR engineered reinforcing product is used in nonresidential and residential construction. It produces a range of WWR products, such as engineered structural mesh, an engineered made-to-order product that is used as the primary reinforcement for concrete elements or structures serving as a reinforcing solution for hot-rolled rebar; concrete pipe reinforcement, an engineered made-to-order product, which is used as the primary reinforcement in concrete pipe, box culverts, and precast manholes for drainage and sewage systems, water treatment facilities, and other related applications; and standard welded wire reinforcement, a secondary reinforcing product for crack control applications in residential and light nonresidential construction, including driveways, sidewalks, and various slab-on-grade applications. The company sells its products through sales representatives to the manufacturers of concrete products, rebar fabricators, distributors, and contractors primarily in the United States, Canada, Mexico, and Central and South America. Insteel Industries, Inc. was founded in 1953 and is headquartered in Mount Airy, North Carolina.

Analyst Sentiment

50%
Hold

From 1 Active Polls

Consensus Target Matrix

Data feed parsing pending...

Price & Moving Averages

Loading chart...

🎯 Wall Street Analyst Intelligence Report

1-Year structural target targets, chart projections, and sentiment maps.

Average 1Y Target
$29.86
β–² +5.00% Upside
Low Target
$21.33
-25% Risk
Median Target
$29.01
2% Mid
High Target
$35.55
25% Max
Consensus
Buy
3 / 4 Buys

Consensus Trend Projection

Trailing closures vs. 12-month metrics map.

Analyst Vote Distribution

Aggregate institutional coverage sentiment weights.

πŸ“Š Historical Valuation Multiples

Real-time Trailing Twelve Month (TTM) momentum side-by-side with discrete quarterly metrics.

Fiscal QuarterTTMQ1 2026Q4 2025Q3 2025Q2 2025Q1 2025Q4 2024Q3 2024Q2 2024
Period EndingTrailing 12MMar 28, 2026Dec 27, 2025Sep 27, 2025Jun 28, 2025Mar 29, 2025Dec 28, 2024Sep 30, 2024Jun 29, 2024
Market Cap ($M)553643632750735513537606604
Enterprise Value ($M)541631620715686488504496508
Price to Earnings Ratio (P/E)13.0330.8020.8112.8812.1312.54124.2232.4722.99
Price/Earnings-to-Growth Ratio (PEG)β€”3.87β€”β€”1.010.53β€”β€”1.59
Price to Sales Ratio (P/S)0.803.723.954.234.093.194.144.514.14
Price to Book Ratio (P/B)1.521.761.762.022.061.501.621.731.74
Price to Free Cash Flow Ratio (P/FCF)83.06957.84-287.95-40.0327.32-92.5632.9241.7038.87
Enterprise Value to Sales (EV/Sales)β€”3.653.884.033.813.043.883.703.48
Enterprise Value to EBITDA (EV/EBITDA)7.7992.4243.7229.8928.0127.21306.6449.2740.39
Debt to Equity Ratio-0.170.010.010.010.010.010.010.000.01

⚑ IIIN Growth Runway Model

Standard long term linear growth fade

Multi-Stage Discounted Cash Flow Sandbox

Market Price$28.44
Intrinsic Value$28.41
Market Alignment
Overvalued by 0.1%relative to calculated intrinsic value
9.00%
Exp: 6%6%
i

Growth runway slowdown

This value provides a time window for the growth rate to decline beyond Stage 1 toward the terminal rate. Longer windows are most useful for companies with high growth starting conditions or strong competitive advantages. This option stretches out the growth rate slowdown across 5, 10, or 15-year steps. A high-growth starting condition (exceeding a 25% initial growth rate) automatically applies a curve decay to simulate realistic, rapid market saturation.
i

Terminal growth rate

With long-term inflation between 3-5%, revenue must grow by that baseline to maintain flat real-world market share. This value sets the permanent terminal growth rate to factor into the valuation beyond the growth slowdown runway toward maturity.

3-Stage Financial Runway Horizon

🧠 Perpetuity Horizon Engine (Stage 3: Post-2035)

Terminal FCF Base$0.08B
Perpetuity TV Value$1.42B
Discounted TV (PV)$0.60B
TV Weighting %60.6%
⚠️
Financial Model Disclaimer & Risk Disclosure: This interactive scenario simulator is an educational sandbox provided strictly for informational and analytical research purposes. Core historical financial statements and consensus estimates are sourced directly via Financial Modeling Prep (FMP). All downstream outputs are entirely deterministic, hypothetical projections generated by combining automated mathematical formulas (including linear interpolation and Gaussian bell-curve decay models) with user-selected variables and third-party financial data inputs. Users assume all liability for trading decisions executed based on these sandbox calculations.

πŸ“˜ Full Research Report

ℹ️

AI-Generated Research: This report is for informational purposes only.

πŸ“˜ INSTEEL INDUSTRIES INC (IIIN) β€” Investment Overview

🧩 Business Model Overview

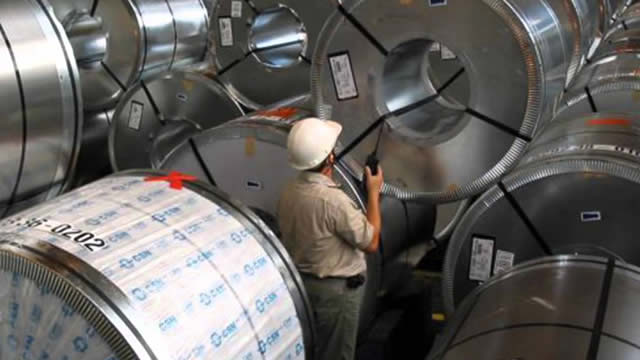
INSTEEL INDUSTRIES INC manufactures engineered products used in civil infrastructure and environmental projects, combining proprietary engineering know-how with steel-based reinforcement and geosynthetic applications. The value chain typically begins with upstream steel wire and polymer inputs (sourced and processed into specialized reinforcement components), followed by fabrication into customer-specified systems. Sales are driven by project-based demand through contractors, specifiers/engineers, and distributors, with product qualification and specification cycles creating customer stickiness.

The economic profile is shaped by (1) the ability to produce compliant, performance-engineered products at competitive yields and (2) the extent to which customers adopt INSTEEL solutions in recurring infrastructure categories (erosion control, soil reinforcement/stabilization, drainage, and related civil works).

πŸ’° Revenue Streams & Monetisation Model

Revenue is primarily transactional and project-linked, but the monetisation model benefits from repeatability in approved designs. Where projects recur by geography and agency (and where specifications repeat across similar jobs), INSTEEL can convert engineering pull-through into more consistent order flow.

  • Engineered product sales: Higher relative margins versus commodity-like steel inputs, supported by performance requirements, documented installation guidance, and design support.
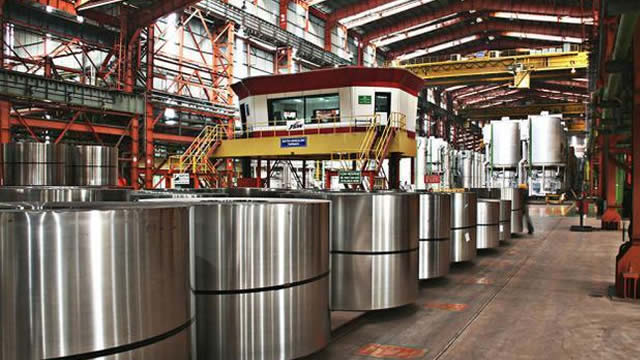
  • Fabrication and system integration: Revenue reflects both materials and value-added transformation (processing, reinforcement integration, and packaging to project needs).
  • Mix effects as a key margin driver: Operating margins are influenced by the spread between input costs (steel wire and polymer materials) and the company’s pricing discipline, as well as by manufacturing efficiency and product mix toward more engineered solutions.

🧠 Competitive Advantages & Market Positioning

INSTEEL’s moat is primarily based on switching costs and process/quality barriers rather than on network effects. Civil infrastructure and environmental products require compliance, performance data, and installation predictability; once a product is specified and qualified for a project class, replacements are costly in engineering time, re-approval, and risk management for contractors and agencies.

This structural stickiness is reinforced by manufacturing know-how and product qualification: competitors must match not only price but also performance documentation, installation guidance, and reliability of supply. In practice, qualification and design-specification cycles create inertia.

  • Competitive benchmarking (primary competitors):
    • TenCate (geosynthetics): Competes in soil reinforcement, separation, and drainage systems, emphasizing engineered spec compliance and long project qualification histories.
    • Tensar (Huesker/Tensar infrastructure systems): Competes on engineered stabilization and specification-driven adoption across transportation and civil markets.
    • Maccaferri (reinforcement & erosion control systems): Competes in erosion control and reinforcement solutions, including geosystems where engineering documentation and installation performance matter.

Contrast in positioning: INSTEEL focuses on delivering engineered, steel-reinforced and civil-environment solutions that fit into customer specifications and project qualification workflows. Versus broader geosynthetics leaders (TenCate, Tensar), the key differentiation is the ability to provide performance-engineered products while maintaining manufacturing execution and supply consistency. Versus system specialists (Maccaferri), the competitive arena hinges on product qualification, installation predictability, and the economics of fabrication and input sourcing rather than solely on catalog breadth.

πŸš€ Multi-Year Growth Drivers

Over a 5–10 year horizon, the addressable market expands with macro needs that are not dependent on short-cycle commodity cycles:

  • Infrastructure resilience spending: Ongoing demand for erosion control, soil stabilization, drainage, and durable civil systems driven by climate variability and aging assets.
  • Water and environmental compliance: Regulatory and permitting frameworks support growth in engineered environmental containment and ground-control applications.
  • Replacement of older, less durable systems: Many civil works require staged upgrades and rehabilitation where performance specifications drive adoption of qualified suppliers.
  • Specification-driven adoption: As design communities standardize solution approaches, qualified product vendors can capture share through documentation, installation support, and long-term reliability.

⚠ Risk Factors to Monitor

  • Input-cost volatility and pricing lag: Steel and polymer input costs can swing, and margin outcomes depend on the speed and ability to pass through costs and manage contract terms.
  • Cyclicality in construction and infrastructure budgets: Demand can be sensitive to public and private capital availability, especially for non-essential or delayed projects.
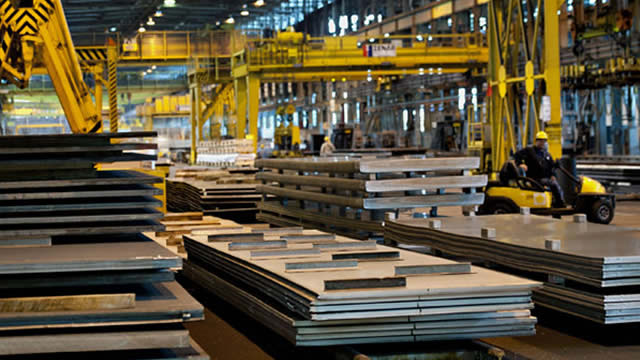
  • Execution and capacity utilization: Manufacturing leverage can amplify earnings swings if volumes fall below planned run-rates.
  • Competitive specification dynamics: Qualified status does not guarantee lifetime adoption; competitors can win projects by meeting documentation, pricing, and delivery requirements.
  • Working capital and logistics: Project timing, billing, and inventory levels affect cash conversion and can pressure liquidity in downcycles.

πŸ“Š Valuation & Market View

The market typically values industrial manufacturers using EV/EBITDA and P/E (when earnings quality is stable), while P/S can be used when earnings are muted by cycle effects. For INSTEEL specifically, valuation sensitivity is usually tied to:

  • Durability of margins: Whether engineered mix and pricing discipline can offset input inflation and utilization swings.
  • Cash conversion quality: Working capital discipline and project billing efficiency.
  • Evidence of share retention in specification-driven categories: Stability of order intake and repeat project classes.

A sustained rerating typically requires credible margin stability and an improved view of supply consistency and engineered product contribution, rather than a pure volume rebound.

πŸ” Investment Takeaway

INSTEEL INDUSTRIES INC is best viewed as a specification-driven civil engineering supplier where switching costs and qualification inertia support defensible share in qualified project classes. The core investment question is whether the company can maintain manufacturing execution and pricing discipline to protect margins through input volatility, while continuing to expand engineered product adoption across resilience, water, and environmental infrastructure end-markets.


⚠ AI-generated β€” informational only. Validate using filings before investing.

πŸ“° Market News & Coverage

15 Stories Available

Real-time institutional reporting and market updates for IIIN.

businesswire.comβ€’2026-06-04

Insteel Industries Announces Second Consecutive NCDOL Safety Achievement Award for Mount Airy Facility

MOUNT AIRY, N.C.--(BUSINESS WIRE)--Insteel Industries Inc. (NYSE: IIIN) (β€œInsteel”) the largest manufacturer of steel wire reinforcing products for concrete construction applications in the United States, announced that its Mount Airy, N.C. facility, operated by its wholly owned subsidiary Insteel Wire Products, has received the Certificate of Safety Achievement – Second Consecutive Year Gold from the North Carolina Department of Labor (β€œNCDOL”). The award recognizes the facility's outstanding.

businesswire.comβ€’2026-05-12

Insteel Industries Declares Quarterly Cash Dividend

MOUNT AIRY, N.C.--(BUSINESS WIRE)--Insteel Industries Inc. (NYSE: IIIN) today announced that its board of directors declared a regular quarterly cash dividend of $0.03 per share of common stock payable on June 26, 2026, to shareholders of record as of June 12, 2026. About Insteel Insteel is the nation's largest manufacturer of steel wire reinforcing products for concrete construction applications. Insteel manufactures and markets prestressed concrete strand and welded wire reinforcement, includ.

gurufocus.comβ€’2026-04-20

Insteel Industries Inc (IIIN) Shares Fall 4.8% -- What GF Score of 75 Tells Investors

On April 20, 2026, Insteel Industries Inc (IIIN) shares fell 4.8% to a current price of $24.95. This decline comes amid a challenging price performance, with th

fool.comβ€’2026-04-17

Tariffs Are Reshaping Retail. These 4 Stocks Are Positioned to Win.

Companies like Insteel Industries and Lifetime Brands benefit because they're less exposed to imports. Acushnet Holdings and Duluth Trading Company show that pricing power, sourcing control, and brand strength can offset even heavy cost pressure.

seekingalpha.comβ€’2026-04-17

Insteel Industries: Operational Volatility Hits Hard In Fiscal Q2

Insteel Industries faces persistent operational volatility due to unpredictable demand, input costs, and high operating leverage, despite sound management. Fiscal Q2 saw an 8% revenue rise but a 6% volume drop and gross margin contraction to 9.6%, driving a 50% decline in operating income. IIIN's near-term margin risk is elevated as wire rod supply constraints and rising costs temporarily outpace price increases, but infrastructure demand and a non-residential construction recovery offer some support.

fool.comβ€’2026-04-16

Here's Why Insteel Stock Crashed 20% Today

Rising raw material and freight costs are squeezing margins despite price hikes. Management anticipates a recovery in volumes in subsequent quarters, providing some optimism.

seekingalpha.comβ€’2026-04-16

Insteel Industries Inc. (IIIN) Q2 2026 Earnings Call Transcript

Insteel Industries Inc. (IIIN) Q2 2026 Earnings Call Transcript

zacks.comβ€’2026-04-16

Insteel Industries (IIIN) Q2 Earnings and Revenues Lag Estimates

Insteel Industries (IIIN) came out with quarterly earnings of $0.27 per share, missing the Zacks Consensus Estimate of $0.8 per share. This compares to earnings of $0.55 per share a year ago.

businesswire.comβ€’2026-04-16

Insteel Industries Reports Second Quarter 2026 Results

MOUNT AIRY, N.C.--(BUSINESS WIRE)--Insteel Industries Inc. (NYSE: IIIN) (β€œInsteel” or the β€œCompany”), the largest manufacturer of steel wire reinforcing products for concrete construction applications in the United States, today reported financial results for its second quarter of fiscal 2026, ended March 28, 2026. Second Quarter 2026 Highlights Net earnings of $5.2 million, or $0.27 per share Net sales of $172.7 million Gross profit of $16.5 million, or 9.6% of net sales Net cash balance of $1.

seekingalpha.comβ€’2026-03-25

20 March Dogcatcher Favorite Toy Dog Dividend Fetchers

Dividend-paying stocks are regaining appeal as interest rates ease and market volatility persists, offering higher returns and lower risk over time. Top ten 'Attractive Toy Dogs' are forecasted to deliver an average 39.99% net gain by March 2027, with risk/volatility 15% below the market. All top ten yielding 'Toy Dogs' currently trade at or below their ideal fair price, with dividends from $1K invested matching or exceeding share prices.

businesswire.comβ€’2026-03-16

Insteel Industries Announces Second Quarter 2026 Conference Call

MOUNT AIRY, N.C.--(BUSINESS WIRE)--Insteel Industries Inc. (NYSE: IIIN) today announced that its second quarter 2026 earnings conference call will be webcast live over the internet on Thursday, April 16, 2026, at 10:00 a.m. ET following the release of the Company's second quarter financial results at 6:30 a.m. ET on that same day. The conference call can be accessed on the Company's website at https://insteel.com and will be archived for replay. About Insteel Insteel is the nation's largest man.

zacks.comβ€’2026-02-27

IIIN vs. CRS: Which Stock Is the Better Value Option?

Investors with an interest in Steel - Speciality stocks have likely encountered both Insteel Industries (IIIN) and Carpenter Technology (CRS). But which of these two stocks is more attractive to value investors?

seekingalpha.comβ€’2026-02-26

Insteel Industries: Pricing Power Delivers Growth (Upgrade)

Insteel Industries is upgraded to "Strong Buy" with a $46/share target, reflecting robust industrial demand and strategic positioning in data center construction. IIIN's Q1'26 saw 23% YoY revenue growth, driven by 18.8% higher average selling prices and 3.8% shipment growth, despite margin compression from elevated input costs. Domestic wire rod shortages and import tariffs are pressuring margins, but IIIN maintains pricing power and reinvests in production to optimize costs and support growth.

defenseworld.netβ€’2026-02-19

Insteel Industries (NASDAQ:IIIN) Stock Crosses Above Two Hundred Day Moving Average – What’s Next?

Shares of Insteel Industries, Inc. (NASDAQ: IIIN - Get Free Report) passed above its 200-day moving average during trading on Wednesday. The stock has a 200-day moving average of $34.58 and traded as high as $37.68. Insteel Industries shares last traded at $37.0340, with a volume of 76,091 shares. Insteel Industries Stock Down 0.7% The

businesswire.comβ€’2026-02-10

Insteel Industries Declares Quarterly Cash Dividend

MOUNT AIRY, N.C.--(BUSINESS WIRE)--Insteel Industries Inc. (NYSE: IIIN) today announced that its board of directors declared a regular quarterly cash dividend of $0.03 per share of common stock payable on March 27, 2026, to shareholders of record as of March 13, 2026. About Insteel Insteel is the nation's largest manufacturer of steel wire reinforcing products for concrete construction applications. Insteel manufactures and markets prestressed concrete strand and welded wire reinforcement, incl.

πŸ“Š AI Financial Analysis

Powered by StockMarketInfo
Earnings Data: Q Ending 2026-03-28

"IIIN reported 1Q26 revenue of $172.7M and net income of $5.2M (EPS $0.27). QoQ revenue declined from $179.9M (down ~3.9%), while net income fell from $15.2M (down ~65.7%). YoY, revenue decreased from $159.9M (up ~8.0% vs 1Q25), but net income dropped from $7.6M (down ~31.4%). Over the last four quarters, profitability has been volatile: EPS peaked in 3Q25 ($0.75) and 2Q25 ($0.78) before compressing sharply in 4Q25 and remaining lower in 1Q26. Net margin contracted meaningfully in 1Q26 (~3.0% = $5.2M / $172.7M) versus ~8.4% in 4Q25 and ~8.4% in 2Q25, indicating margin pressure and/or non-operating/one-off effects. Cash flow quality also looks mixed. Free cash flow was strongly positive in 1Q26 ($0.67M) and 2Q25 ($26.9M) but negative in 4Q25 (-$2.2M) and 3Q25 (-$18.7M). The dividend appears small relative to net income (payout ratio ~11% in 1Q26), though the 4Q25 payout ratio was elevated (~263%), suggesting uneven earnings coverage. Balance sheet resilience is supported by consistent equity (~$364.5M in 1Q26) and net cash/negative net debt throughout (netDebt ranges from -$12M to -$50M). Total shareholder return is muted: the stock is down ~-1.9% over 1Y and ~-19.1% YTD, so momentum is not a tailwind. Revenue and earnings-based metrics were not flagged as pre-revenue; the company is producing reported results."

Revenue Growth

Neutral

1Q26 revenue was $172.7M: QoQ -3.9% but YoY +8.0%. The broader 4-quarter pattern shows a peak around 3Q–2Q25 (~177–180M) followed by a step-down into 4Q25 and 1Q26.

Profitability

Caution

Net income declined QoQ (-65.7%) and YoY (-31.4%). Margins contracted: 1Q26 net margin ~3.0% vs ~8%+ in prior quarters (e.g., 2Q25/4Q25). EPS fell from $0.39 (4Q25) and far below $0.75–$0.78 in 3Q–2Q25.

Cash Flow Quality

Caution

FCF turned positive in 1Q26 ($0.67M) after negative FCF in 3Q25 (-$18.7M) and 4Q25 (-$2.2M). Operating cash flow was weak in 4Q25 (-$0.7M) but strong in 2Q25 (+$28.5M), indicating inconsistent cash conversion.

Leverage & Balance Sheet

Positive

Equity remained stable-to-improving (~$364.5M in 1Q26 vs ~$356.2M in 2Q25). Net debt is consistently negative (net cash position), improving resilience versus leverage risk; total assets are broadly stable around $456–472M.

Shareholder Returns

Caution

Price performance is slightly negative over 1Y (-1.9%) and notably negative YTD (-19.1%); no strong momentum tailwind. Dividend yield is low (~0.09% in 1Q26) and coverage looks reasonable in 1Q26 (payout ~11%) but was much higher in 4Q25.

Analyst Sentiment & Valuation

Fair

No price target provided. Valuation multiples appear elevated (P/E ~31 in 1Q26), which can be justified only if earnings stabilize; given the recent EPS compression, near-term valuation risk remains.

Disclaimer:This analysis is AI-generated for informational purposes only. Accuracy is not guaranteed and this does not constitute financial advice.

Fundamentals Overview

Loading fundamentals overview...

IIIN’s Q2 2026 performance missed expectations, driven by severe, prolonged winter weather across 9 of 11 facilities, which disrupted construction activity and Insteel operations, compounded by lower spreads and higher unit conversion costs. Despite weakness in shipments (-5.9% YoY), April deliveries trended above forecast and sequential shipments grew (+6.9%), while pricing actions continued to show up in ASP (+14.2% YoY). The margin takeaway is stark: gross margin fell to 9.6% and contracted 170 bps sequentially, reflecting shipment slowdown delaying realization of prior price increases. Management expects gradual gross margin recovery in Q3 from improved demand seasonality, better raw material carrying values, and higher facility operating rates. Liquidity remains solid ($15.1M cash; no revolver borrowings), but reliance on offshore raw material supply tightened working capital (inventory roughly 3.4 months; net working capital up ~$45M over 12 months). Key uncertainties include freight/driver costs, tariff mechanics (AIBA rebate uncertainty), and whether delayed business converts as expected in the back half of FY26.

AI IconGrowth Catalysts

  • Engineered Structural Mesh (ESM) growth emphasized as supported by 2026 capex/information-systems investment and reduced production costs
  • Pricing actions implemented throughout fiscal 2025 and into 2026; additional April price increase expected to provide further margin benefit as realized pricing catches up
  • Seasonally stronger demand in Q3 with higher operating rates expected to improve fixed-cost absorption and support gradual gross margin recovery

Business Development

    AI IconFinancial Highlights

    • Net earnings $5.2M, $0.27 diluted EPS vs $10.2M, $0.52 last year (weaker than expected due to winter disruption, lower spreads, higher unit conversion costs)
    • Shipments down 5.9% YoY, up 6.9% sequentially; April shipments trending above forecast levels
    • Average selling prices up 14.2% YoY; +1.0% sequentially despite higher wire rod costs
    • Gross profit down $8.0M YoY to $16.5M; gross margin narrowed to 9.6%
    • Gross margin contracted 170 bps sequentially; cited lagged realization of recent price increases and extended spread pressure from shipment slowdown and weather inefficiencies
    • SG&A $9.7M (5.6% of net sales) vs $10.8M (6.7%) last year; compensation decline tied to return-on-capital-based incentive plan and a $203k unfavorable life-insurance cash surrender value change
    • Effective tax rate 23.3% vs 23.2% last year; guided to ~23% for remainder of year

    AI IconCapital Funding

    • Capital expenditures $4.4M in Q2; $5.9M through first half; full-year capex target remains $20M
    • Liquidity: $15.1M cash on hand and no borrowings outstanding on the $100M revolving credit facility
    • Operating cash flow provided $4.8M in Q2; working capital used $1.4M (receivables +$6.8M, inventory -$13.3M); inventory ~3.4 months of shipments on a forward-looking basis vs 3.9 months at end of Q1

    AI IconStrategy & Ops

    • Weather disruption impacted 9 of 11 facilities; roads impassable and sustained low temperatures reduced concrete pour feasibility and disrupted schedules
    • Management previously staffed up ahead of the seasonally more active period to expand operating hours; carried ramp-up costs but did not reach expected operating levels due to weather
    • Cost posture: will reduce costs if 2026 demand forecast fails to materialize; not planning demand-driven cost reduction at present
    • Inventory strategy shifted: increased early in year by supplementing domestic bar rod with offshore material; later easing as Q2 progressed, with modest inventory increase expected into the seasonal busy period

    AI IconMarket Outlook

    • Q3: recent price increases and more favorable current raw material carrying values expected to support gradual gross margin improvement as the quarter progresses
    • Tax guidance: effective tax rate approximately 23% for remainder of 2026 (subject to pretax earnings/book-to-tax items)
    • Demand indicators: Architectural Billing Index improved to 49.4 in February from 43.8 in January; Dodge Momentum Index up 1.8% in March with 7% improvement in commercial planning activity

    AI IconRisks & Headwinds

    • Winter weather severity and duration reduced construction activity and disrupted operating schedules; project delays described as business delays (not cancellations) but still reduced Q2 order flow and shipments
    • Lower spreads between selling prices and raw material costs and higher unit conversion costs from reduced production/inefficiencies
    • Section 232 steel tariff effects: domestic hot-rolled wire rod pricing tightened materially vs global; continued reliance on offshore supply increases working capital burden
    • Freight and logistics: rapid diesel and driver availability deterioration after conflict with Iran; carrier rejectionsβ€”management cited >40% load rejections in flatbed sector
    • AIBA tariff exposure and Supreme Court / Court of International Trade rebating requirements: management assessing vendor obligations/refund mechanics; stated no receivables booking due to low certainty

    Q&A: Analyst Interest

    • Project delays and volume impact: Management explained delays are operational timing issuesβ€”owners/contractors avoid opening sites early until materials/suppliers alignβ€”so the quarter’s shipment shortfall reflects postponement rather than cancellation. They said delays should benefit later in FY2026 and extend through 2027 completion, without precise quantification.
    • Freight costs and pass-through: Management rejected a simple inbound-vs-outbound bucket framework. They attributed freight inflation to diesel and driver shortages after the Iran-related conflict, plus carrier load rejections. They said they absorb some costs until price increases’ effective dates and chose price increases over surcharges to recover higher costs.
    • Tariff clarification and AIBA uncertainty: On April 2 clarifications, management said the Section 232 derivative-products confusion largely did not materially change their exposure because they validated PC strand tariff rates on entry docs. For AIBA, they discussed potential vendor rebate mechanics after Supreme Court action and said they will not record tariff receivable collections given low probability.

    Sentiment: MIXED

    Note: This summary was synthesized by AI from the IIIN Q2 2026 earnings transcript. Financial data is complex; please verify all metrics against official SEC filings before making investment decisions.

    πŸ“‹ Official Regulatory 10-K / 10-Q SEC Filings

    Direct authenticated documentation links to audited SEC database reports for IIIN.

    SEC EDGAR Live Feed
    Loading financial data and tables...
    πŸ“

    SEC Filings (IIIN)

    Β© 2026 Stock Market Info β€” Insteel Industries, Inc. (IIIN) Financial Profile