IRadimed Corporation

IRadimed Corporation (IRMD) Market Cap

IRadimed Corporation has a market capitalization of $1.16B.

Price: $90.86

-4.35 (-4.57%)

Market Cap: 1.16B

NASDAQ · time unavailable

CEO: Roger E. Susi

Sector: Healthcare

Industry: Medical - Devices

IPO Date: 2014-07-16

Website: https://www.iradimed.com

IRadimed Corporation (IRMD) - Company Information

Market Cap: 1.16B|Sector: Healthcare

Company Profile

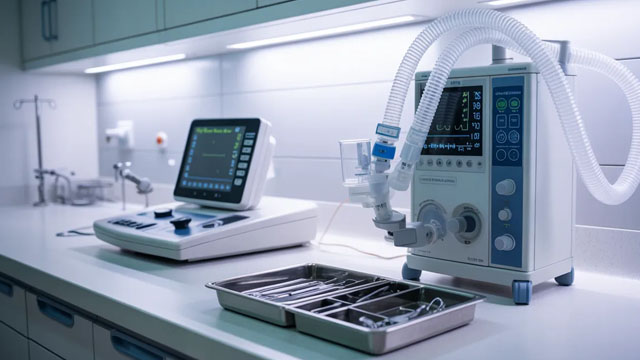
IRADIMED CORPORATION specializes in the engineering, production, and distribution of medical devices specifically designed for compatibility with magnetic resonance imaging (MRI) environments. The company supplies these specialized products, alongside their related accessories and support services, to both U.S. and international markets. Key offerings include the MRidium MRI-compatible intravenous (IV) infusion pump system, which comes with disposable tubing sets, and an MRI-compatible patient vital signs monitoring system. Furthermore, IRADIMED provides a range of complementary items such as non-magnetic IV poles, wireless remote displays/controls, side car pump modules, dose error reduction systems, and SpO2 monitoring solutions with sensors. Their clientele primarily consists of hospitals, acute care facilities, and outpatient imaging centers. Sales are conducted via direct field representatives, regional sales directors, clinical support specialists, and independent distributors. Founded in 1992, IRADIMED CORPORATION is headquartered in Winter Springs, Florida.

Analyst Sentiment

92%
Strong Buy

From 3 Active Polls

1Y Forecast: $120.00

▲ +32.1% Potential Upside

Consensus Target Metrics

Low Bound

$120

Median

$120

High Bound

$120

Average

$120

Price & Moving Averages

Loading chart...

🎯 Wall Street Analyst Intelligence Report

1-Year structural target targets, chart projections, and sentiment maps.

Average 1Y Target
$120.00
▲ +32.07% Upside
Low Target
$120.00
32% Risk
Median Target
$120.00
32% Mid
High Target
$120.00
32% Max
Consensus
Buy
2 / 2 Buys

Consensus Trend Projection

Trailing closures vs. 12-month metrics map.

Analyst Vote Distribution

Aggregate institutional coverage sentiment weights.

📊 Historical Valuation Multiples

Real-time Trailing Twelve Month (TTM) momentum side-by-side with discrete quarterly metrics.

Fiscal QuarterTTMQ2 2026Q1 2026Q4 2025Q3 2025Q2 2025Q1 2025Q4 2024Q3 2024
Period EndingTrailing 12MJun 30, 2026Mar 31, 2026Dec 31, 2025Sep 30, 2025Jun 30, 2025Mar 31, 2025Dec 31, 2024Sep 30, 2024
Market Cap ($M)1,1611,2221,2301,239905760667698637
Enterprise Value ($M)1,1021,1621,1741,188849707617646586
Price to Earnings Ratio (P/E)50.2059.7352.3247.6940.4333.2235.4633.5431.43
Price/Earnings-to-Growth Ratio (PEG)6.7910.417.2156.605.7814.19
Price to Sales Ratio (P/S)13.4559.6955.9854.6142.6937.2534.2035.9834.77
Price to Book Ratio (P/B)11.4212.0112.4913.109.208.067.418.047.64
Price to Free Cash Flow Ratio (P/FCF)46.59212.26156.02227.77154.78154.441122.13238.06124.83
Enterprise Value to Sales (EV/Sales)56.8053.4252.3540.0334.6531.6233.2931.96
Enterprise Value to EBITDA (EV/EBITDA)35.91181.89142.77141.34110.4989.30100.4998.7188.53
Debt to Equity Ratio-1.920.000.000.00

📘 Full Research Report

ℹ️

AI-Generated Research: This report is for informational purposes only.

📘 IRADIMED CORP (IRMD) — Investment Overview

🧩 Business Model Overview

IRadimed develops and sells medical imaging power injectors and related solutions used to administer contrast media for diagnostic imaging workflows (e.g., CT, MRI, and angiography). The company’s value chain typically spans device manufacturing, installation support, training, and ongoing servicing of an installed base.

Once equipment is deployed, hospitals and imaging centers tend to source compatible replacement parts, consumables, and service—creating stickiness around both the physical system and the operating procedures staff rely on.

💰 Revenue Streams & Monetisation Model

Revenue is commonly driven by a mix of:

  • Device sales (injectors/systems) tied to new imaging site builds and replacement cycles.
  • Service and maintenance revenues derived from the installed base, often supported by recurring service contracts and spare-part demand.
  • Related accessories/consumables that support ongoing operation and workflow integration.

Margin structure typically improves as the installed base grows, because service and parts generally exhibit more recurring characteristics than one-time device purchases. Over time, the primary monetisation lever is expanding serviceability and consumables usage around existing deployments rather than relying solely on new unit growth.

🧠 Competitive Advantages & Market Positioning

IRadimed’s competitive position is best understood through switching costs and installed-base economics. Hospitals integrate injectors into imaging workflows, radiology protocols, and staff training. Compatibility, maintenance familiarity, downtime risk, and procurement friction make re-platforming meaningfully costly.

These dynamics create a moat that becomes stronger with scale of deployments, because service, parts, and workflow adoption reinforce continued customer preference.

  • Competitive benchmarking: Key competitors include ACIST Medical Systems and Bayer (Medrad) (both active in medical imaging injection systems). Additional competition can also arise from regional device vendors offering overlapping injection hardware.
  • Positioning vs. rivals: Compared with larger global brands that compete across broad imaging capital categories, IRadimed’s industry focus is centered on injector solutions and the operational ecosystem around contrast administration—areas where installed-base service and workflow compatibility can tilt purchasing behavior.

🚀 Multi-Year Growth Drivers

  • Secular imaging demand: Ongoing procedure growth in CT/MRI/angiography supports incremental injector placements and replacement cycles.
  • Shift toward contrast-enhanced imaging: Wider adoption of contrast protocols increases demand for reliable injection systems designed for precision and safety.
  • Installed-base expansion: New equipment deployments expand the future service and parts opportunity, supporting a durable revenue base across cycles.
  • Workflow standardisation and safety expectations: As radiology departments standardize protocols, injector reliability, operational control, and support responsiveness become procurement differentiators.
  • Geographic and modality penetration: Growth in imaging infrastructure—particularly in outpatient and ambulatory settings—expands total addressable demand for injection systems and supporting services.

⚠ Risk Factors to Monitor

  • Regulatory and quality systems: Medical device manufacturing requires sustained compliance and product quality controls; adverse findings or recalls can impair supply and revenue.
  • Capital expenditure sensitivity: Demand for new injector systems depends on hospital and imaging center budget cycles and replacement timing.
  • Competitive pressure: Larger competitors and regional vendors may pressure pricing or increase marketing/contract bundling, particularly in conversion opportunities.
  • Technology and product lifecycle risk: Customers may favor next-generation automation or integration features; failure to maintain product competitiveness can slow adoption.
  • Supply chain and input cost volatility: Dependence on manufactured components can affect margin performance if component availability and costs shift.

📊 Valuation & Market View

Market participants typically value medical device and healthcare equipment providers using a combination of revenue-based multiples (e.g., EV/Sales) and earnings power metrics where service intensity and gross margin trends are visible. For IRadimed-like models, the key valuation drivers generally include:

  • Installed-base growth (future service/parts visibility)
  • Service mix and service profitability (recurring cash-flow characteristics)
  • Device unit growth durability (new placements vs. replacement cycles)
  • Gross margin and operating leverage as manufacturing scales and service penetration increases

Investors generally underwrite a longer-duration thesis around durability of customer relationships and the ability to convert installed equipment into recurring service and parts demand.

🔍 Investment Takeaway

IRadimed’s investment case rests on a structurally resilient installed-base moat driven by switching costs, workflow integration, and service/parts economics. Over a multi-year horizon, imaging procedure growth and the expansion of installed deployments can support continued conversion of one-time device sales into more recurring service-related revenue, while ongoing compliance and product competitiveness remain the principal determinants of outcomes.


⚠ AI-generated — informational only. Validate using filings before investing.
📰 Market News & Coverage

15 Stories Available

Real-time institutional reporting and market updates for IRMD.

marketbeat.com2026-07-31

iRadimed Q2 Earnings Call Highlights

iRadimed NASDAQ: IRMD reported second-quarter 2026 revenue of $20.5 million, up 0.5% from a year earlier, as the company began general-release production of its new 3870 MRI IV pump system and worked through the costs associated with an initial manufacturing ramp.

seekingalpha.com2026-07-31

IRADIMED CORPORATION (IRMD) Q2 2026 Earnings Call Transcript

IRADIMED CORPORATION (IRMD) Q2 2026 Earnings Call Transcript

globenewswire.com2026-07-31

IRADIMED CORPORATION Reports Second Quarter 2026 Financial Results

Announces Regular Quarterly Cash Dividend of $0.20 Per Share  Reaffirms Full-Year 2026 Revenue and Earnings Guidance Reports revenue of $20.5 million for the second quarter of 2026, which increased by $0.1 million, or 0.5% compared to the same period in 2025. Reports GAAP diluted EPS of $0.41 and non-GAAP diluted EPS of $0.46 for the second quarter of 2026.

globenewswire.com2026-07-24

IRADIMED CORPORATION to Hold Second Quarter 2026 Financial Results Conference Call on July 31, 2026

ORLANDO, Fla., July 24, 2026 (GLOBE NEWSWIRE) -- IRADIMED CORPORATION (NASDAQ: IRMD) announced today that the Company will release its 2026 second quarter financial results before the market opens on Friday, July 31, 2026. Iradimed management will host a conference call the same day beginning at 11:00 a.m. Eastern Time to discuss those results and to answer questions.

fool.com2026-06-02

IRADIMED's CEO Is Selling Steadily — The Plan, Not the Stock, Is Driving It

This medical device maker, known for MRI-compatible equipment, reported a notable insider sale amid strong one-year stock performance.

globenewswire.com2026-05-20

IRADIMED CORPORATION to Present at the Goldman Sachs 47th Annual Global Healthcare Conference

ORLANDO, Fla., May 20, 2026 (GLOBE NEWSWIRE) -- IRADIMED CORPORATION (NASDAQ: IRMD), a leader in developing innovative MRI-compatible medical devices, today announced that Roger Susi, President and Chief Executive Officer, and Jack Glenn, Chief Financial Officer, will attend the Goldman Sachs 47th Annual Global Healthcare Conference, to be held June 8–10, 2026, at the Loews Miami Beach Hotel, Miami Beach, Florida.

fool.com2026-05-01

Why Iradimed Stock Topped the Market Today

Yet again, it posted growth and robust profitability in its latest quarter.

gurufocus.com2026-05-01

iRadimed Corp (IRMD) Shares Surge 4.4% -- What GF Score of 95 Tells Investors

On May 01, 2026, iRadimed Corp (IRMD) shares rose 4.4%, bringing the current price to $87.15. This movement comes amid a 52-week range that has seen a high of $

seekingalpha.com2026-05-01

IRADIMED CORPORATION (IRMD) Q1 2026 Earnings Call Transcript

IRADIMED CORPORATION (IRMD) Q1 2026 Earnings Call Transcript

zacks.com2026-05-01

iRadimed (IRMD) Beats Q1 Earnings and Revenue Estimates

iRadimed (IRMD) came out with quarterly earnings of $0.49 per share, beating the Zacks Consensus Estimate of $0.45 per share. This compares to earnings of $0.42 per share a year ago.

globenewswire.com2026-05-01

IRADIMED CORPORATION Reports First Quarter 2026 Financial Results

Announces Regular Quarterly Cash Dividend of $0.20 Per Share Reaffirms Full-Year 2026 Revenue and Earnings Guidance  Reports revenue of $22.0 million for the first quarter of 2026, an increase of $2.5 million, or 13%, compared to the same period in 2025. Reports record GAAP diluted EPS of $0.45 and non-GAAP diluted EPS of $0.49 for the first quarter of 2026, which are increases of 22% and 17%, respectively, compared to the same period in 2025.

globenewswire.com2026-04-27

IRADIMED CORPORATION to Hold First Quarter 2026 Financial Results Conference Call on May 1, 2026

ORLANDO, Fla., April 27, 2026 (GLOBE NEWSWIRE) -- IRADIMED CORPORATION (NASDAQ: IRMD) announced today that the Company will release its 2026 first quarter financial results before the market opens on Friday, May 1, 2026. Iradimed management will host a conference call the same day beginning at 11:00 a.m. Eastern Time to discuss those results and to answer questions.

globenewswire.com2026-04-10

IRADIMED CORPORATION to Participate at the 25th Annual Needham Virtual Healthcare Conference

ORLANDO, Fla., April 10, 2026 (GLOBE NEWSWIRE) -- IRADIMED CORPORATION (NASDAQ: IRMD) today announced that it will participate in the 25th Annual Needham Virtual Healthcare Conference.

defenseworld.net2026-04-09

Roger Susi Sells 5,000 Shares of iRadimed (NASDAQ:IRMD) Stock

iRadimed Corporation (NASDAQ: IRMD - Get Free Report) CEO Roger Susi sold 5,000 shares of iRadimed stock in a transaction on Monday, April 6th. The shares were sold at an average price of $96.02, for a total transaction of $480,100.00. Following the sale, the chief executive officer directly owned 2,220,000 shares of the company's stock, valued

defenseworld.net2026-03-27

Roger Susi Sells 5,000 Shares of iRadimed (NASDAQ:IRMD) Stock

iRadimed Corporation (NASDAQ: IRMD - Get Free Report) CEO Roger Susi sold 5,000 shares of the stock in a transaction that occurred on Monday, March 23rd. The stock was sold at an average price of $100.38, for a total value of $501,900.00. Following the completion of the transaction, the chief executive officer directly owned 2,235,000 shares

📊 AI Financial Analysis

Powered by StockMarketInfo
Earnings Data: Q Ending 2026-06-30

"IRMD reported Q2’26 revenue of $20.47M and net income of $5.22M (EPS $0.40, diluted $0.41). Versus Q2’25, revenue increased ~0.27% YoY (from $20.41M) while net income declined ~-9.7% YoY (from $5.77M). QoQ, revenue fell ~-6.8% (from $21.98M in Q1’26) and net income fell ~-10.3% (from $5.82M). Profitability was mixed: gross margin improved slightly QoQ to ~74.1% (from ~76.5% Q1’26) ending below Q4’25 (~75.1%) and Q2’25 (~78.2%), while net margin slipped to ~25.5% (from ~26.5% Q1’26). Operating income margin also softened to ~31.2%. Cash flow remains a key strength. Operating cash flow in Q2’26 was $5.94M and free cash flow $5.76M, with dividends paid of $2.56M, indicating continued capital returns funded by earnings power. Balance sheet resilience is strong with no debt; cash and equivalents rose to ~$59.1M and total equity increased to ~$101.7M. Total shareholder returns look favorable given strong price momentum: the stock is up ~80.35% over the last 1 year, which materially supports the overall return despite modestly pressured earnings trends. Revenue and Earnings-based metrics were not applicable for this analysis due to the company's pre-revenue status. The evaluation focused on cash runway, burn rate, and market sentiment instead."

Revenue Growth

Caution

Q2’26 revenue was $20.47M, +0.27% YoY but -6.8% QoQ (from $21.98M). Indicates stagnation with sequential decline.

Profitability

Fair

Net income fell -9.7% YoY and -10.3% QoQ; net margin slipped to ~25.5% from ~26.5% QoQ, suggesting margin contraction.

Cash Flow Quality

Good

Operating cash flow was $5.94M and free cash flow $5.76M in Q2’26. Dividends of $2.56M were covered by strong cash generation, supporting capital return.

Leverage & Balance Sheet

Strong

Net cash position improved (net debt ~- $59.1M) with zero debt. Total equity rose to ~$101.7M and cash grew QoQ to ~$59.1M, indicating resilience.

Shareholder Returns

Good

Market momentum is strong: +80.35% 1Y price change. Dividend yield is small (~0.21%), but total return is supported primarily by price appreciation.

Analyst Sentiment & Valuation

Caution

Consensus price target is $120 versus current price $93.71 (implied upside ~28%). However, valuation multiples remain high (P/E ~59.7), limiting score.

Disclaimer:This analysis is AI-generated for informational purposes only. Accuracy is not guaranteed and this does not constitute financial advice.

Fundamentals Overview

Loading fundamentals overview...

IRadimed delivered strong Q1 2026 execution: revenue $22M (+13% YoY) and GAAP EPS $0.45 (+22%), supported by 3860 backlog fulfillment plus early 3870 momentum. Gross margin rose to 77% (+100 bps YoY). The core story is the MRI IV 3870 replacement ramp: initial quoting and orders are yielding ~20% higher ASP versus the prior 10%-14% expectation, and early demand is skewing to Quad (4-channel) configurations—more than half of orders—driving materially higher system economics (>$100k per Quad system). Management reiterated a controlled revenue ramp in Q2 because 130-135 units ship while 3860 revenue declines, but expects greater back-half impact. Risks center on manufacturing ramp execution and near-term revenue timing, while tax rate normalization from discrete windfall deductions may improve later-year EPS trajectory.

AI IconGrowth Catalysts

  • MRI-compatible IV infusion pump growth driven by continued fulfillment of 3860 pump backlog and strong early traction for the new 3870 MRI IV pump
  • Higher-than-expected initial 3870 ASP uplift (~20% vs historical 3860 ASP assumptions of +10% to +14%) supporting back-end 2026 bookings and revenue
  • Ferro-magnetic Detection System growing revenue support (Q1 contributed $600k)

Business Development

  • No specific named customers/partners disclosed; repeated references to 'existing customers' and customer facilities where sales teams are invited to demonstrate the 3870 at high rates
  • Domestic replacement opportunity framed around installed-base 3860/3861 pump channels (6,400 channels, 5+ years old) and annual selling of ~1,100 channels to replacement; greenfield explicitly not yet factored into channel targets

AI IconFinancial Highlights

  • Revenue $22.0M, +13% YoY (vs $19.5M in Q1 2025); IV infusion pump systems $7.7M (+28% YoY); patient monitoring $7.1M (+9% YoY)
  • Gross margin 77% vs 76% prior-year quarter (+100 bps YoY); gross profit $16.8M
  • Operating income $7.2M, +33% YoY; disciplined expense management including modified commission structure
  • GAAP net income $5.8M, $0.45 diluted EPS (+22% YoY); non-GAAP net income $6.4M, $0.49 non-GAAP diluted EPS (+17% YoY)
  • Effective tax rate ~25% increased due to discrete timing of windfall deduction for equity grants; expects tax rate to trend down later in 2026 as most vesting occurs in Q4
  • Q2 guidance: Revenue $20M-$21M; GAAP EPS $0.40-$0.44; non-GAAP EPS $0.44-$0.48
  • FY 2026 reaffirmed: Revenue $91M-$96M; GAAP EPS $1.90-$2.05; non-GAAP EPS $2.06-$2.21

AI IconCapital Funding

  • Cash and cash equivalents $56.4M at quarter end
  • Operating cash flow $8.3M (+93% YoY); non-GAAP free cash flow $7.8M after capex ~$0.5M
  • Board declared quarterly dividend of $0.20/share payable May 29, 2026 (record date May 15, 2026)
  • No buyback authorization/amount and no new debt figures mentioned in transcript

AI IconStrategy & Ops

  • Q2 3870 production/shipping plan: target shipping 130 to 135 units in Q2; company will not exceed ~135 due to ramp/stabilization needs
  • Back-end 2026 emphasis: bookings and higher ASP expected to show more fully in the back half as ramp increases and 3860 declines
  • Manufacturing ramp constrained by need to stabilize know-how and supply chain; despite sales team desire for >200 shipments in Q2, management remains conservative
  • Q2 mix expectation: controlled ramp where declining 3860 domestic revenue (orders trailed off) is offset by increasing 3870 revenue as production ramps

AI IconMarket Outlook

  • 3870 replacement-led channel target: start Q2 through rest of 2026 and beyond; target adding ~1,000 additional replacement channels per year on top of prior ~1,100 channels annually (management framing: not step-change; ramp controlled)
  • Domestic replacement opportunity quantified: ~6,400 5-plus-year-old or older 3860/3861 pump channels up for replacement; greenfield not yet included in near-term upside
  • Domestic 3870 channel run-rate expectation: selling north of 2,000 3870 channels annually with higher ASP, driving pumps revenue toward ~$50M annual run rate; with disposables/maintenance/international/monitoring/ferro-magnetic, management expects $100M+ revenue run rate as 2026 progresses
  • Q2 guidance date context: provided for quarter ending June 30, 2026 (Q2 2026 guidance released with the call)

AI IconRisks & Headwinds

  • Tax headwind/volatility in comparability: effective tax rate elevated in Q1 due to discrete windfall equity-grant deduction timing; could distort near-term EPS trend even if rate trends down
  • Manufacturing/ramp execution risk: management capped Q2 shipments at 130-135 (sales wanted >200) due to production, know-how, and supply chain stabilization needs
  • Revenue timing risk: Q2 revenue will not fully reflect high order activity because shipping/declining 3860 offsets limit near-term revenue step-up
  • Customer adoption concentration risk: rapid adoption observed, but ramp assumptions depend on continued replacement cycle execution; greenfield upside explicitly not included yet

Q&A: Analyst Interest

  • Quad-channel ordering behavior: Management explained that more than half of early 3870 orders are Quad (4 channels) rather than dual-channel replacements. They attributed it to salesforce customer proximity, ease of Quad stacking/handling, and existing customers recalling past needs for third/fourth channels.
  • Financials of Quad vs dual: Management said Quad systems carry higher pump ASP, not a discount. They compared pricing points: prior pump list price ~$20k with an additional channel roughly +$10k; typical ASP just under $40k including sidecar/pole/remote, while Quad systems exceed $100k.
  • Scaling and manufacturing ramp constraints: Management confirmed they planned 130-135 3870 shipments in Q2, despite a sales-team push for >200, citing caution to get it right. They expect scaling in Q3 and accelerating in Q4 as supply chain stabilizes and new facility capacity is leveraged.

Sentiment: POSITIVE

Note: This summary was synthesized by AI from the IRMD Q1 2026 earnings transcript. Financial data is complex; please verify all metrics against official SEC filings before making investment decisions.

📋 Official Regulatory 10-K / 10-Q SEC Filings

Direct authenticated documentation links to audited SEC database reports for IRMD.

SEC EDGAR Live Feed
Loading financial data and tables...
📁

SEC Filings (IRMD)

© 2026 Stock Market Info — IRadimed Corporation (IRMD) Financial Profile