Joby Aviation, Inc.

Joby Aviation, Inc. (JOBY) Market Cap

Joby Aviation, Inc. has a market capitalization of $9.39B.

Price: $9.55

β–Ό -1.59 (-14.27%)

Market Cap: 9.39B

NYSE Β· time unavailable

CEO: JoeBen Bevirt

Sector: Industrials

Industry: Airlines, Airports & Air Services

IPO Date: 2020-11-09

Website: https://www.jobyaviation.com

Joby Aviation, Inc. (JOBY) - Company Information

Market Cap: 9.39B|Sector: Industrials

Company Profile

Joby Aviation, Inc., a vertically integrated air mobility company, engages in building an electric vertical takeoff and landing aircraft optimized to deliver air transportation as a service. It intends to build an aerial ridesharing service. The company was founded in 2009 and is headquartered in Santa Cruz, California.

Analyst Sentiment

60%
Buy

From 11 Active Polls

1Y Forecast: $16.50

β–² +72.8% Potential Upside

Consensus Target Metrics

Low Bound

$13

Median

$18

High Bound

$18

Average

$17

Price & Moving Averages

Loading chart...

🎯 Wall Street Analyst Intelligence Report

1-Year structural target targets, chart projections, and sentiment maps.

Average 1Y Target
$16.50
β–² +72.77% Upside
Low Target
$13.00
36% Risk
Median Target
$18.00
88% Mid
High Target
$18.00
88% Max
Consensus
Hold
2 / 8 Buys

Consensus Trend Projection

Trailing closures vs. 12-month metrics map.

Analyst Vote Distribution

Aggregate institutional coverage sentiment weights.

πŸ“Š Historical Valuation Multiples

Real-time Trailing Twelve Month (TTM) momentum side-by-side with discrete quarterly metrics.

Fiscal QuarterTTMQ1 2026Q4 2025Q3 2025Q2 2025Q1 2025Q4 2024Q3 2024Q2 2024
Period EndingTrailing 12MMar 31, 2026Dec 31, 2025Sep 30, 2025Jun 30, 2025Mar 31, 2025Dec 31, 2024Sep 30, 2024Jun 30, 2024
Market Cap ($M)9,3947,79311,80913,6318,4064,6175,9583,4963,357
Enterprise Value ($M)9,2557,65411,62913,4688,1014,5265,7893,3753,212
Price to Earnings Ratio (P/E)-9.41-17.72-24.29-8.49-6.47-14.01-6.05-6.07-6.81
Price/Earnings-to-Growth Ratio (PEG)β€”β€”-0.66-0.00β€”β€”-0.06β€”-0.57
Price to Sales Ratio (P/S)120.94321.43382.97603.84560414.90β€”108318.79124853.84119893.18
Price to Book Ratio (P/B)4.603.988.3815.219.365.376.534.483.75
Price to Free Cash Flow Ratio (P/FCF)-14.21-35.05-70.72-89.00-70.82-36.66-43.83-29.09-31.29
Enterprise Value to Sales (EV/Sales)β€”315.70377.13596.63540054.90β€”105256.65120548.02114714.46
Enterprise Value to EBITDA (EV/EBITDA)-8.82-32.77-106.30-34.45-25.73-29.36-41.23-22.84-23.69
Debt to Equity Ratio0.130.380.040.050.030.040.030.040.03

⚑ JOBY Growth Runway Model

Standard long term linear growth fade

Multi-Stage Discounted Cash Flow Sandbox

Market Price$9.55
Intrinsic Value$1.84
Market Alignment
Overvalued by 80.7%relative to calculated intrinsic value
9.00%
Exp: 3%3%
i

Growth runway slowdown

This value provides a time window for the growth rate to decline beyond Stage 1 toward the terminal rate. Longer windows are most useful for companies with high growth starting conditions or strong competitive advantages. This option stretches out the growth rate slowdown across 5, 10, or 15-year steps. A high-growth starting condition (exceeding a 25% initial growth rate) automatically applies a curve decay to simulate realistic, rapid market saturation.
i

Terminal growth rate

With long-term inflation between 3-5%, revenue must grow by that baseline to maintain flat real-world market share. This value sets the permanent terminal growth rate to factor into the valuation beyond the growth slowdown runway toward maturity.

3-Stage Financial Runway Horizon

🧠 Perpetuity Horizon Engine (Stage 3: Post-2035)

Terminal FCF Base$0.01B
Perpetuity TV Value$0.11B
Discounted TV (PV)$0.05B
TV Weighting %61.6%
⚠️
Financial Model Disclaimer & Risk Disclosure: This interactive scenario simulator is an educational sandbox provided strictly for informational and analytical research purposes. Core historical financial statements and consensus estimates are sourced directly via Financial Modeling Prep (FMP). All downstream outputs are entirely deterministic, hypothetical projections generated by combining automated mathematical formulas (including linear interpolation and Gaussian bell-curve decay models) with user-selected variables and third-party financial data inputs. Users assume all liability for trading decisions executed based on these sandbox calculations.

πŸ“˜ Full Research Report

ℹ️

AI-Generated Research: This report is for informational purposes only.

πŸ“˜ JOBY AVIATION INC CLASS A (JOBY) β€” Investment Overview

🧩 Business Model Overview

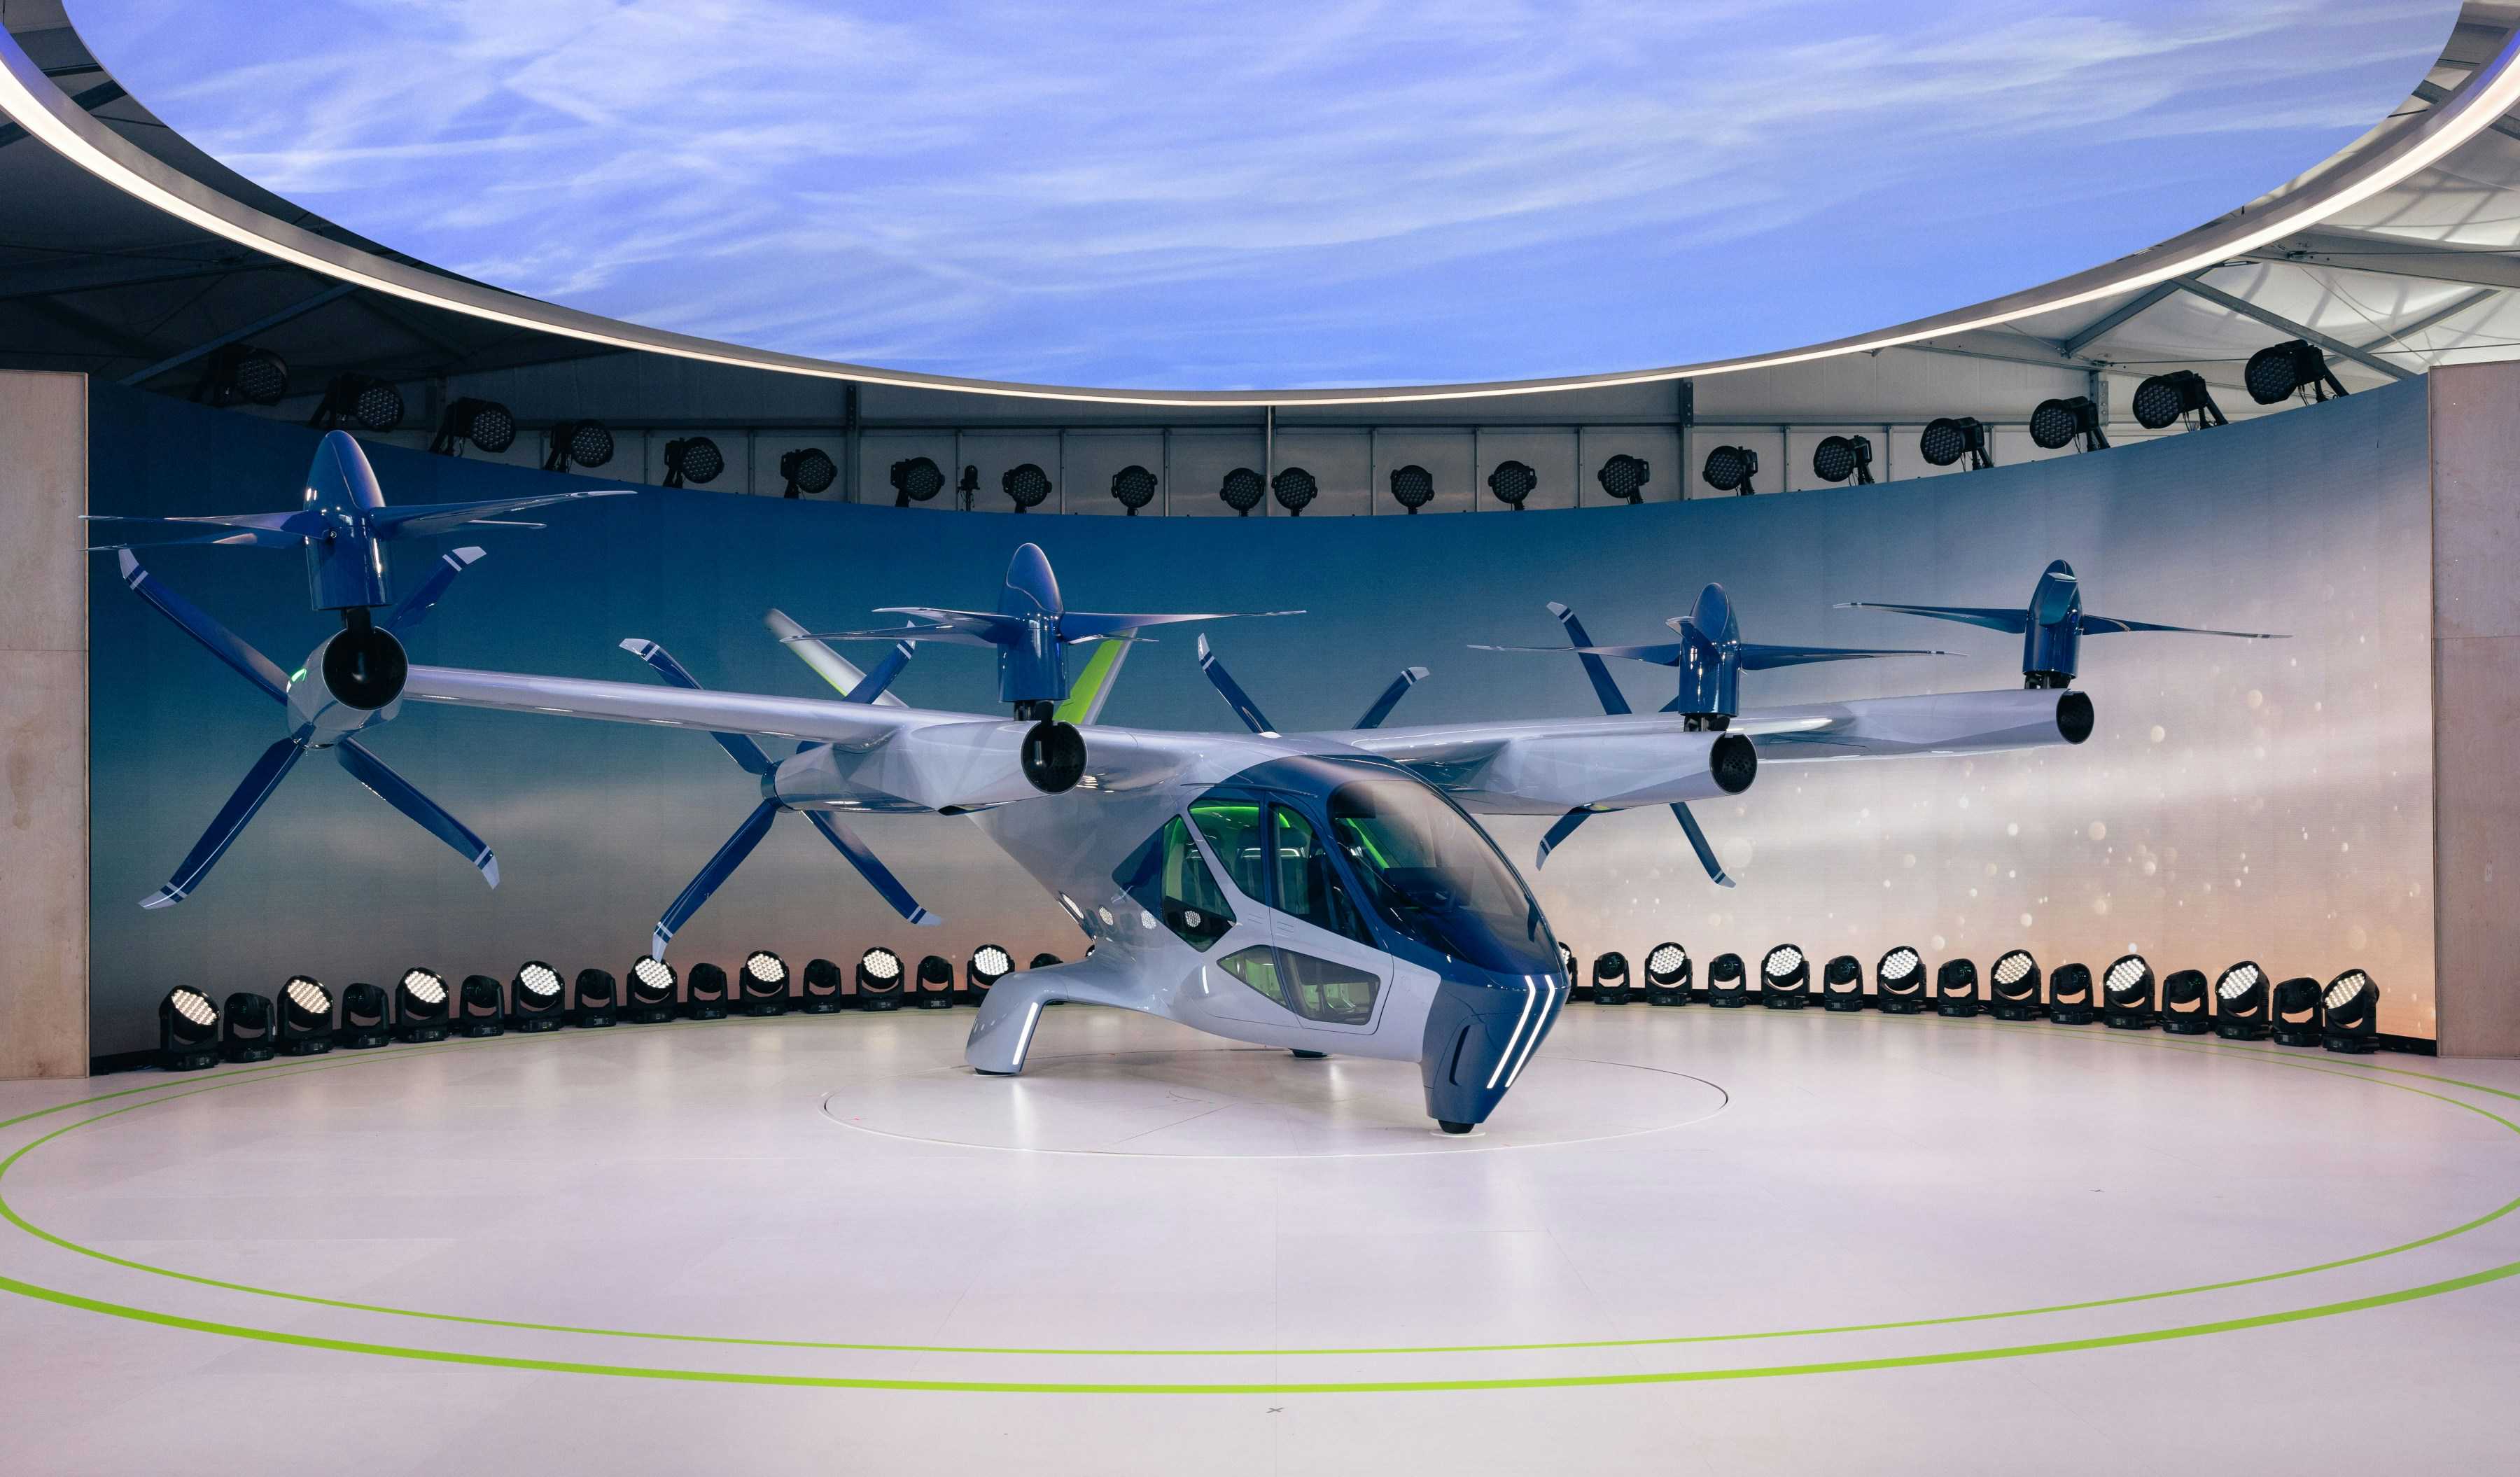
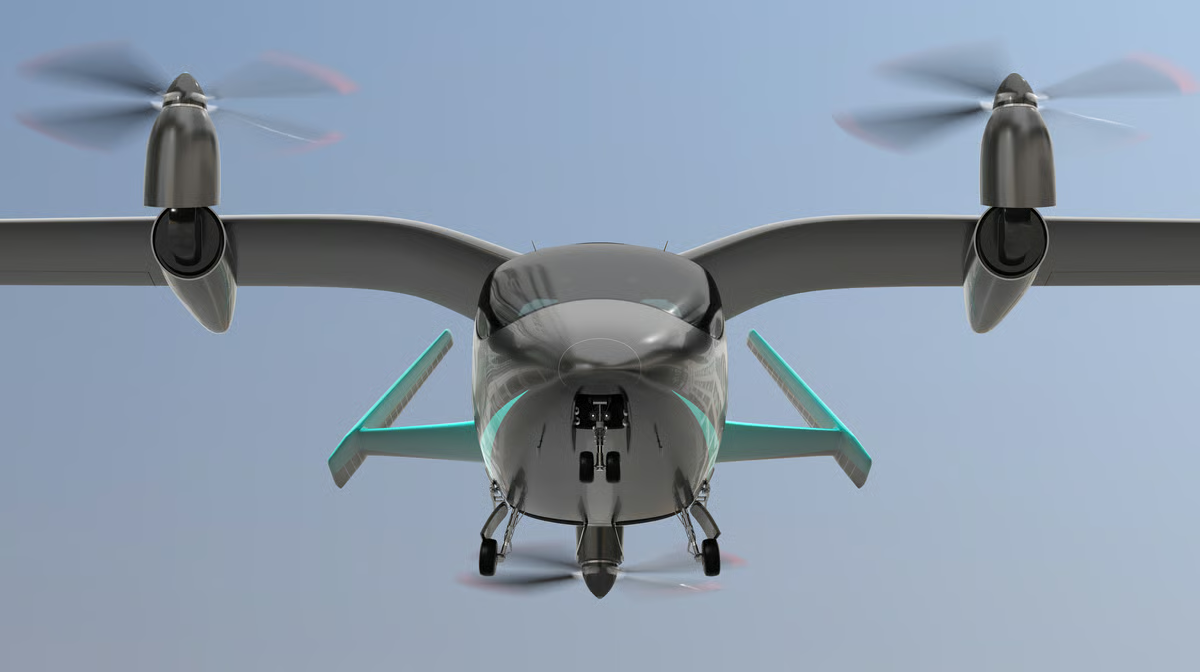
Joby Aviation develops an electric vertical takeoff and landing (eVTOL) aircraft intended for short-haul passenger β€œair taxi” missions. The economic value chain centers on (1) aircraft certification and manufacturing, (2) operating readiness (training, maintenance, flight operations), and (3) enabling infrastructure such as vertiports and charging/ground-handling arrangements.

In the model, Joby is positioned less as a simple OEM and more as an aircraft platform provider whose commercial success depends on reaching operational certification, sustaining aircraft reliability, and coordinating with route/vertiport partners to translate aircraft availability into repeatable flight demand.

πŸ’° Revenue Streams & Monetisation Model

Joby’s monetisation path typically combines several components, evolving from development and program execution toward fleet commercialisation:

  • Aircraft sales: delivery of eVTOL aircraft to customers/operators, generating revenue as fleets are commissioned.
  • Operating/maintenance support (platform services): recurring economics can emerge from maintenance programs, spares supply, and engineering support tied to installed aircraft bases.
  • Fleet-backed commercial arrangements: where partnerships structure demand and route execution, the revenue mix can blend transactional aircraft economics with longer-duration commercial relationships.

Margin drivers are largely tied to (1) achieving certification milestones that unlock revenue visibility, (2) manufacturing scale that lowers unit costs, and (3) high utilization and reliability that support serviceability economics over the installed base.

🧠 Competitive Advantages & Market Positioning

The moat in eVTOL is less about β€œbrand” and more about regulatory permission + operational execution. For a new aircraft category, the practical barrier is the ability to demonstrate safety, reliability, and maintainability to aviation authorities and to translate certification into scalable manufacturing and dependable service.

  • Regulatory/Certification moat (hard barrier): Achieving and maintaining type certification (and satisfying ongoing airworthiness requirements) creates a durable barrier to entry. Competitors can design aircraft, but certification readiness and repeatable compliance become the gating factor.
  • Operational know-how and installed-base learning: As fleets accumulate, Joby can compound reliability data, maintenance procedures, and supply-chain performanceβ€”improving turnaround times and reducing lifecycle costs.
  • Switching costs via ecosystem lock-in (emerging): Once operators standardize around a specific aircraft type for pilot training, maintenance tooling, spare parts, and compliance processes, switching becomes costly and operationally disruptive.
  • Intangible assets: proprietary flight control system development, validated safety cases, and manufacturing process maturity are not easily replicated on a short timeline.

Competitive benchmarking:

  • Archer Aviation (eVTOL competitor; urban air mobility focus): competes on aircraft platform readiness and partner/operator relationships, aiming to reach commercialization through certified aircraft and operator contracts.
  • Lilium (eVTOL competitor; air taxi/regional air mobility focus): pursues a different system architecture while similarly relying on certification and operational economics to convert development progress into fleet revenue.
  • Volocopter (eVTOL competitor): has emphasized operational pilots/partnerships and certification pathways for its aircraft and service concepts.

Joby’s industry focus is unified around building an aircraft platform capable of commercial airline-style operations (repeatable safety case, fleet servicing discipline, and enabling infrastructure coordination). While rivals pursue different design philosophies and commercialization routes, the core competitive differentiator remains the same: converting certification progress into scalable manufacturing and dependable service economics.

πŸš€ Multi-Year Growth Drivers

Over a 5–10 year horizon, the growth thesis rests on an expanding total addressable market for short-distance point-to-point travel, subject to regulatory clearance and infrastructure rollout:

  • Urban/suburban mobility demand: rising congestion and constrained ground transport create a structural rationale for air taxi services where economics and safety support operations.
  • Regulatory normalization and network adoption: once authorities establish credible certification frameworks and operational rules, adoption can accelerate as operators gain confidence.
  • Infrastructure deployment (vertiports and charging): demand materializes as routes become operationally practical, linking aircraft supply with ground ecosystem readiness.
  • Manufacturing learning curve: scaling production typically improves unit economics through learning-by-doing, supplier maturation, and design-for-manufacture.

The TAM expansion is therefore conditional: the market grows when aircraft availability, operating reliability, and infrastructure deployment reach a self-reinforcing cadence.

⚠ Risk Factors to Monitor

  • Certification and regulatory timeline risk: delays in achieving or maintaining required approvals can defer revenue and increase capital needs.
  • Technology and safety risk: battery performance, redundancy effectiveness, and overall safety case robustness remain critical for long-term viability.
  • Manufacturing scale risk: transitioning from prototype to high-throughput, consistent production can stress supply chains and quality systems.
  • Capital intensity and financing risk: eVTOL commercialization can require substantial ongoing funding before meaningful operating cash generation.
  • Operational economics risk: route-level profitability depends on aircraft utilization, maintenance cost per flight hour, and the pace of infrastructure buildout.
  • Competitive and consolidation risk: rivals may secure earlier certification, partnerships, or production advantages, altering market share dynamics.

πŸ“Š Valuation & Market View

Markets typically value early-stage, pre-scale aerospace and deep-tech platforms using a mix of option-value thinking and forward revenue scaling potential, often reflected through multiples such as EV/Sales or milestone-adjusted expectations rather than mature profitability metrics.

Key valuation drivers generally include: certification progress credibility, evidence of operational reliability, the trajectory toward manufacturing cost reduction, the quality and enforceability of customer/partner agreements, and improving expected unit economics (gross margin and serviceability economics) as fleets scale.

πŸ” Investment Takeaway

Joby’s long-term investment case centers on the ability to convert eVTOL technical progress into a regulator-certified, repeatably manufacturable, and operationally dependable aircraft platform. In an industry where designs are abundant but approvals and scalable execution are scarce, the primary moat is the combination of certification credibility, accumulating operational learning, and emerging ecosystem lock-in that can create practical switching costs for operators. Upside depends on disciplined execution through commercialization and on reaching fleet economics that justify broader adoption of air taxi networks.


⚠ AI-generated β€” informational only. Validate using filings before investing.

πŸ“° Market News & Coverage

15 Stories Available

Real-time institutional reporting and market updates for JOBY.

fool.comβ€’2026-06-04

Prediction: Joby Aviation Will Soar Over the Next 5 Years. Here's 1 Reason Why.

Joby Aviation demonstrated a point-to-point flight of an electric air taxi in Manhattan -- the first ever to do so. The company has a legitimate shot at flying eVTOLs commercially within the next five years.

zacks.comβ€’2026-06-04

Joby Aviation, Inc. (JOBY) Up 8.7% Since Last Earnings Report: Can It Continue?

Joby Aviation, Inc. (JOBY) reported earnings 30 days ago. What's next for the stock?

fool.comβ€’2026-06-04

Cathie Wood Is Loading Up on This Air Taxi Stock -- Should You Follow Her Lead?

Flying taxis could be coming to a city near you, and Joby Aviation is one company leading the way.

fool.comβ€’2026-06-03

ARKX vs. XAR: Two ETFs Worthy of Consideration

One fund leans into disruptive tech, while the other sticks to industry stalwarts-cost, volatility, and sector focus set them apart for investors.

fool.comβ€’2026-06-02

Buying for the Long Haul? These 3 Stocks Could Generate 10x Returns

Joby Aviation, Curaleaf Holdings, and Pony AI may not be the safest stocks to own, but they possess some attractive upside in the future.

247wallst.comβ€’2026-06-02

Live Nasdaq Composite: Tech Bulls Lose Their Grip in a Seesaw Session

Live Updates The analyst who called NVIDIA in 2010 just named his top 10 AI stocks This analyst's 2025 picks are up 106% on average. He just named his top 10 stocks to buy in 2026. Get them here FREE. Fed Speaking Rounds 47 minutes ago Live Cleveland Fed President Beth Hammack added a hawkish... Live Nasdaq Composite: Tech Bulls Lose Their Grip in a Seesaw Session

247wallst.comβ€’2026-06-01

Prediction: Can Joby Aviation Soar to $20 in 2027?

Joby Aviation (NYSE:JOBY | JOBY Price Prediction) is finally turning into a revenue story.

nytimes.comβ€’2026-05-31

Joby Demonstrated its Air Taxi in Manhattan, but You Can't Fly in It Yet

Aviation start-ups and the Trump administration want to replace helicopters with electric aircraft, but the new vehicles still have to pass arduous tests before the public can use them.

seekingalpha.comβ€’2026-05-30

Joby Aviation: Buy The Future, Not The 2026 Revenue

Joby Aviation: Buy The Future, Not The 2026 Revenue

247wallst.comβ€’2026-05-29

Forget Self-Driving Cars. This Company Just Flew Passengers Over New York City.

Everyone is still looking at Tesla (NASDAQ:TSLA | TSLA Price Prediction), because the robotaxi is always six months away and Optimus is always one demo away from changing the world.

cnbc.comβ€’2026-05-29

Infighting, court battles could put long-hyped air taxi breakthrough in jeopardy

Heated battles are unfolding in the courtroom between Joby, Archer and Vertical, threatening to sidetrack certification aspirations and investor appetite. eVTOL makers have long pushed back certification timelines, but the Trump administration's pilot program is providing the support to get them across the finish line.

benzinga.comβ€’2026-05-29

Jim Cramer: Buy GE Aerospace, 'Two Thumbs Up' For This Life Sciences Stock

On CNBC's β€œMad Money Lightning Round,” Jim Cramer said he likes Joby Aviation Inc (NYSE:JOBY) for its "terrific spec," and the US federal government is investing in drones. The stock has almost doubled in value this month, after reporting its first-quarter results on May 5.

fool.comβ€’2026-05-28

This $12 Stock Has 10X Potential, According to Wall Street

Joby Aviation shares are slowly bouncing back, as a spate of positive news drives renewed enthusiasm for the stock. Analysts still hold lofty price targets for this top name in the eVTOL, aka the "urban mobility" or the "flying taxi" space.

fool.comβ€’2026-05-27

Best Transportation Stocks to Buy in 2026

Joby Aviation and Canadian National Railway are still worthwhile investments.

gurufocus.comβ€’2026-05-27

Why Joby Aviation Stock Is Climbing Today

Joby Aviation (JOBY) climbed about 2% in early Wednesday trading after a New York City demo flight helped keep investors focused on the company's electric air-t

πŸ“Š AI Financial Analysis

Powered by StockMarketInfo
Earnings Data: Q Ending 2026-03-31

"Headline (2026-03-31, Q1): Revenue $24.25M; Net income -$109.95M; Diluted EPS -$0.12. Gross margin was 22.4% (gross profit $5.44M). QoQ (Q1’26 vs Q4’25): Revenue fell to $24.25M from $30.84M (-21.4%). Net income loss improved in dollars to -$109.95M from -$121.54M (+9.5% improvement). Gross margin expanded from 1.7% to 22.4%, indicating a sharp improvement in cost/revenue dynamics, though profitability remains deeply negative with operating loss still driven by very high R&D. YoY (Q1’26 vs Q1’25): Revenue increased from $0 to $24.25M (from non-reporting/near-zero to meaningful scale). Net loss widened from -$82.41M to -$109.95M (worsened by -33.4%), and EPS deteriorated from -$0.11 to -$0.12. Cash flow & balance sheet: Operating cash flow was -$144.44M and free cash flow -$222.36M, with heavy investing activity (primarily purchases of investments). Liquidity increased materially: cash and short-term investments rose to $2.47B from $1.41B in the prior quarter, reducing near-term balance-sheet stress. Total equity increased to $1.96B from $1.41B. Shareholder returns/valuation: Shares are up +59.2% over 1 year, a strong momentum tailwind. With a consensus target of ~$15.42 vs price ~$9.22, implied upside is meaningful, supporting sentiment despite ongoing losses. Revenue and Earnings-based metrics were not applicable for this analysis due to the company's pre-revenue status. The evaluation focused on cash runway, burn rate, and market sentiment instead."

Revenue Growth

Caution

Revenue was $24.25M in Q1’26 vs $30.84M in Q4’25 (-21.4% QoQ) and $0 in Q1’25 (effectively -/not meaningful base YoY). Profitability is not yet sustainable.

Profitability

Neutral

Net loss persisted: -$109.95M in Q1’26 vs -$121.54M in Q4’25 (slightly improved) and -$82.41M in Q1’25 (worsened YoY). Operating margin remains deeply negative (net margin -4.53%).

Cash Flow Quality

Caution

Operating cash flow was -$144.44M and free cash flow -$222.36M in Q1’26. However, liquidity improved sharply (cash+ST investments $2.47B), supporting runway despite continued burn.

Leverage & Balance Sheet

Positive

Very strong liquidity and balance-sheet capacity: total assets rose to $2.93B from $1.80B QoQ, equity increased to $1.96B, and net debt remains negative (net cash position).

Shareholder Returns

Good

Total shareholder momentum is strong: price up +59.2% over 1 year (>20% threshold). No dividends; buybacks not indicated.

Analyst Sentiment & Valuation

Positive

Consensus price target ~$15.42 vs current ~$9.22 implies upside. Despite losses, sentiment appears constructive given strong momentum and liquidity.

Disclaimer:This analysis is AI-generated for informational purposes only. Accuracy is not guaranteed and this does not constitute financial advice.

Fundamentals Overview

Loading fundamentals overview...

Joby’s Q1 2026 focused less on speculative milestones and more on execution visibility around certification, production scale-up, and eIPP commercialization prep. The biggest operational catalyst is selection of 11 states across 5 applications for the eIPP program, with OTA agreements underway and a stated operational start in the back half of 2026. Management anchored credibility via New York/JFK-to-downtown demonstrations in Class B airspace, using Blade infrastructure, plus completion of FAA SR3 audit for the final certification phase. Financially, Q1 showed $24M revenue (mostly Blade) and a GAAP net loss of $110M, but the key movement was cash positioning: ~$2.5B in cash and ~$1.3B net capital proceeds in the quarter, offset by ~$195M cash use including the Ohio facility purchase. Operational ramp is intensifying (third composites shift, 2.5x output), with explicit quality targets (MCRs/nonconformances toward zero). Main risks remain schedule execution across manufacturing, supply chain, and FAA pilot readiness.

AI IconGrowth Catalysts

  • Selection of 11 states (5 applications) for the White House-backed eIPP program, enabling aircraft and service deployment to communities this year ahead of FAA type certification
  • FAA SR3 audit completion confirming test results meet FAA expectations for the final phase of type certification
  • Demonstration flights linking international airports and downtown heliports (Oakland to JFK; JFK to Wall Street, West 30th Street, East 34th Street heliports) including Class B airspace operations
  • Ramping conforming-production: producing parts for the 9th conforming aircraft; moving from prototype to conforming parts with a stated focus on quality and driving MCRs/nonconformances toward zero
  • Transition flights of turbine-electric VTOL aircraft (148-mile flight at max takeoff weight of 2,400 kg) and maneuverability/endurance demonstration to the U.S. Army with L3Harris
  • Beginning passenger-flight readiness: management frames β€˜two shots on goal’ for 2026 passenger flights later this year (Dubai and eIPP markets)

Business Development

  • FAA and DOT OTA agreement pathway under the eIPP (finalizing OTA agreements with FAA/DOT for selected state programs)
  • Blade infrastructure partnership referenced as enabling New York/JFK-to-downtown route demonstrations (Blade customers tied to demonstrated use cases)
  • State-level partners: Port Authority of New York and New Jersey (solicitation for a vertiport on LaGuardia Terminal C parking garage roof)
  • New York: EDC and Port Authority relationships explicitly cited in community flights and regulatory coordination
  • Texas: secured MRO facility to support regional operations
  • Florida: Orlando International Airport development work for a dedicated vertiport for air taxis
  • L.A.: partnership with Ruben Brothers for a vertiport at Century Plaza towers
  • San Jose/Bay Area: partnership with SAP Center to develop a vertiport in a key San Jose location
  • Dubai: completion of a purpose-built commercial vertiport next to Dubai International Airport serving as the operational hub
  • Defense/airspace modernization: partnership with Air Space Intelligence (ASI) for airspace modernization software/4D modeling/AI tools; planned real-life demonstrations later this year for scaled operations integration
  • Simulation/flight training: partnership with CAE for flight simulator hardware (Joby develops flight dynamics/controls running on CAE hardware)
  • U.S. Army demonstration: L3Harris cited as partner alongside the turbine-electric transition-flight effort

AI IconFinancial Highlights

  • Cash balance: approximately $2.5B cash/cash equivalents/short-term investments at Q1 end; $1.3B net proceeds raised during the quarter via equity/convertible offerings and Delta warrants exercise
  • Q1 cash use (excluding net capital raise proceeds): ~$195M total, including ~$32M net purchase impact for the new Ohio manufacturing facility (gross purchase price $62M; financed ~half)
  • Onetime Ohio purchase excluded: Q1 cash use ~$163M vs $157M in Q4; property/equipment investment ~$78M ($62M Ohio purchase plus $16M facility build-out/tooling/production equipment)
  • GAAP net loss: $(110)M, $12M improvement vs $(122)M in Q4; sequential drivers included a $33M noncash favorable change in fair value of warrants/earn-out shares and $4M higher interest income, partially offset by $27M higher loss from operations
  • Revenue: $24M (mostly Blade); down $7M vs Q4 due to absence of one-time Japan flight demonstration revenue recognized in Q4
  • Full-year revenue guidance reiterated trajectory: $105M to $115M for 2026
  • Operating expenses: $258M vs $238M in Q4 (+$20M) driven by continued investment for certification, manufacturing ramp, and commercial readiness
  • Adjusted EBITDA (non-GAAP): loss of $(179)M in Q1 vs loss of $(154)M in Q4; sequential change tied to revenue/expense dynamics described
  • No explicit bps margin/cost bps changes disclosed in the transcript; the call emphasizes noncash volatility and operating expense ramp as primary financial movements

AI IconCapital Funding

  • Net proceeds raised in Q1: ~$1.3B from equity/convertible offerings and warrants exercised by Delta Airlines
  • Cash runway implied by $2.5B cash/cash equivalents/short-term investments and stated ability to fund certification/scaling while preserving financial flexibility
  • No buyback amount disclosed in transcript; no explicit net debt level disclosed beyond cash and quarterly cash use

AI IconStrategy & Ops

  • Manufacturing ramp: added a third shift to composites layup and automated fiber placement team; training batches of new technicians each month
  • Composites production throughput: composites team producing 2.5x volume vs this time last year
  • Quality-first conforming build: producing conforming parts for conforming aircraft; focus stated on driving MCRs (nonconformances) to zero and achieving parts with β€˜0 defects’ aided by Toyota production system practices
  • Toyota integration: use of Gemba Walks and Obeya rooms to centralize project information and accelerate decision-making
  • Certification: completed FAA SR3 audit reviewing aircraft design/safety requirements/test results/development standards for final phase certification
  • FAA pilot testing preparation: simulator installed and being prepared to train FAA pilots; simulator built in partnership with CAE (Joby provides flight dynamics/controls)
  • Ohio manufacturing timeline: propeller blade manufacturing ramp going well; two parallel work streamsβ€”building workforce/capabilities and building out the additional 730,000 sq ft facility across the street for production processes

AI IconMarket Outlook

  • eIPP program operational ramp expectation: agreements begin signing in Q3, with operations starting in the back half of 2026
  • Fleet prioritization: management expectation to build out fleets in New York, Florida, and Texas for the back half of 2026 and first half of 2027
  • Passenger flights: management frames β€˜two shots on goal’ for passenger flights later this yearβ€”Dubai and eIPP markets
  • Full-year 2026 revenue trajectory: $105M to $115M

AI IconRisks & Headwinds

  • Noncash volatility: fair value revaluation of warrants and earn-out shares driven primarily by share price can introduce meaningful quarter-to-quarter noncash volatility
  • Manufacturing bottleneck risk acknowledged implicitly: need for supply chain, manufacturing ramp, and pilots available for FAA simulator/flight training to avoid schedule slippage
  • Program ramp execution risk: eIPP sequencing depends on infrastructure readiness and regulatory OTA agreements; management indicates decisions will balance infrastructure availability and revenue opportunity

Q&A: Analyst Interest

  • eIPP sequencing and ramp model: Management said scaling is driven by both infrastructure readiness and where revenue opportunity exists, plus regulatory timing. They highlighted rapid state infrastructure deployment and New York’s existing infrastructure/customer base as a catalyst for acoustic-demand differentiation.
  • Full credit testing timeline for conforming aircraft: Management described parallel workstreamsβ€”test articles/components and reports submission, Joby pilot testing on the first conforming aircraft, and FAA pilot simulator training. They framed the next step as both component/test article readiness and FAA DER/VAR-driven processes.
  • Bottlenecks prevention for eIPP rollout (manufacturing, supply chain, pilots): Management emphasized proactive mitigation across three areasβ€”supply chain, manufacturing ramp, and early flight-simulator investment. They credited CAE as simulator hardware provider and Joby’s role in flight dynamics/controls, preparing FAA pilot training early.

Sentiment: POSITIVE

Note: This summary was synthesized by AI from the JOBY Q1 2026 earnings transcript. Financial data is complex; please verify all metrics against official SEC filings before making investment decisions.

πŸ“‹ Official Regulatory 10-K / 10-Q SEC Filings

Direct authenticated documentation links to audited SEC database reports for JOBY.

SEC EDGAR Live Feed
Loading financial data and tables...
πŸ“

SEC Filings (JOBY)

Β© 2026 Stock Market Info β€” Joby Aviation, Inc. (JOBY) Financial Profile