Liberty Energy Inc.

Liberty Energy Inc. (LBRT) Market Cap

Liberty Energy Inc. has a market capitalization of $3.05B.

Price: $18.71

0.76 (4.23%)

Market Cap: 3.05B

NYSE · time unavailable

CEO: Ron Gusek

Sector: Energy

Industry: Oil & Gas Equipment & Services

IPO Date: 2018-01-11

Website: https://www.libertyenergy.com

Liberty Energy Inc. (LBRT) - Company Information

Market Cap: 3.05B|Sector: Energy

Company Profile

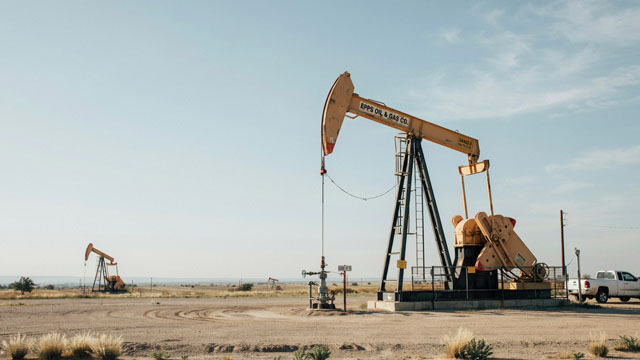
Liberty Energy Inc. operates across North America, delivering crucial hydraulic fracturing and wireline services, along with associated products, to land-based companies focused on oil and natural gas exploration and production. Its extensive service portfolio encompasses specialized hydraulic fracturing pressure pumping, including both general pressure pumping and pumpdown perforating services. The company also provides advanced wireline solutions, efficient proppant delivery systems, sophisticated data analytics, and a variety of related technologies and supplies. Further augmenting its capabilities, Liberty Energy owns and operates two sand mines strategically located in the prolific Permian Basin. As of the close of 2021, the company maintained approximately 30 active frac fleets. Liberty Energy's primary operational focus is centered in major North American unconventional resource plays, including the Permian Basin, the Eagle Ford Shale, the Denver-Julesburg Basin, the Williston Basin, and the Powder River Basin. Originally founded in 2011 as Liberty Oilfield Services Inc., the company officially adopted its current name, Liberty Energy Inc., in April 2022. Its corporate headquarters are situated in Denver, Colorado.

Analyst Sentiment

84%
Strong Buy

From 13 Active Polls

1Y Forecast: $33.00

▲ +76.4% Potential Upside

Consensus Target Metrics

Low Bound

$29

Median

$32

High Bound

$40

Average

$33

Price & Moving Averages

Loading chart...

🎯 Wall Street Analyst Intelligence Report

1-Year structural target targets, chart projections, and sentiment maps.

Average 1Y Target
$33.00
▲ +76.38% Upside
Low Target
$29.00
55% Risk
Median Target
$32.00
71% Mid
High Target
$40.00
114% Max
Consensus
Buy
13 / 21 Buys

Consensus Trend Projection

Trailing closures vs. 12-month metrics map.

Analyst Vote Distribution

Aggregate institutional coverage sentiment weights.

📊 Historical Valuation Multiples

Real-time Trailing Twelve Month (TTM) momentum side-by-side with discrete quarterly metrics.

Fiscal QuarterTTMQ2 2026Q1 2026Q4 2025Q3 2025Q2 2025Q1 2025Q4 2024Q3 2024
Period EndingTrailing 12MJun 30, 2026Mar 31, 2026Dec 31, 2025Sep 30, 2025Jun 30, 2025Mar 31, 2025Dec 31, 2024Sep 30, 2024
Market Cap ($M)3,0534,2694,6672,9901,9991,8582,5633,2393,145
Enterprise Value ($M)4,1115,3275,5913,8362,6112,3563,1033,7533,593
Price to Earnings Ratio (P/E)24.8025.1851.4354.6211.436.5232.9815.5410.61
Price/Earnings-to-Growth Ratio (PEG)1.545.660.989.18
Price to Sales Ratio (P/S)0.733.594.572.882.111.782.623.432.76
Price to Book Ratio (P/B)1.552.172.401.440.970.911.301.641.60
Price to Free Cash Flow Ratio (P/FCF)-9.64-47.01-31.41-300.43-29.7456.1844.06-123.6340.37
Enterprise Value to Sales (EV/Sales)4.485.473.692.762.263.173.983.16
Enterprise Value to EBITDA (EV/EBITDA)6.6741.9736.3926.0913.8210.0418.7818.8915.56
Debt to Equity Ratio1.720.820.830.420.300.250.290.270.24

📘 Full Research Report

ℹ️

AI-Generated Research: This report is for informational purposes only.

📘 LIBERTY ENERGY INC CLASS A (LBRT) — Investment Overview

🧩 Business Model Overview

Liberty Energy provides hydraulic fracturing (pressure pumping) and completion-related services to upstream oil and gas operators. The value chain centers on converting operator drilling activity into high-intensity well completions: Liberty supplies (i) frac crews and execution teams, (ii) pumping equipment and proppant handling capabilities, and (iii) operational planning that aligns service design with target reservoir performance. Revenue is driven by well-schedule adherence, pump-rate execution, and frac spread utilization, with repeat engagements tied to operator performance expectations and turnaround discipline.

💰 Revenue Streams & Monetisation Model

Liberty’s monetisation is largely transaction-based at the well level, with economics shaped by volume, mix, and execution efficiency:
  • Service revenue per completed well / frac job: Predominantly tied to pumping intensity, job duration, and proppant usage.
  • Consumables and logistics pass-throughs (where applicable): Certain inputs may be partially recoverable or structured into contracts, moderating exposure to input inflation.
  • Margin drivers: Utilization of frac fleet, crew productivity, equipment reliability, and cost control on key inputs (labor, power/fuel, logistics, and inventory management).
Because oilfield activity is cyclical, the profitability profile tends to compress when utilization falls and expand when execution teams can sustain operating rates and manage input cost volatility.

🧠 Competitive Advantages & Market Positioning

Liberty’s moat is primarily grounded in logistical and operational execution, supported by low-cost feedstock logistics in North American unconventionals.
  • Low-cost feedstock alignment (North American basin economics): In pressure pumping, the competitive edge often comes from shortening the end-to-end logistics chain for proppant, water (where applicable), and equipment movements. Proximity to production-adjacent supply lanes and disciplined supply contracting can reduce unit costs and job execution variability.
  • Logistical infrastructure & execution capacity: A large operating footprint requires yards, transportation planning, maintenance cadence, and frac fleet availability. Competitors can bid on individual jobs, but consistently delivering reliability at scale is harder when fleets are mismatched to basin demand and when maintenance/scheduling execution lags.
  • Customer stickiness via performance and scheduling: Operators prefer service partners that reliably meet pumping schedules and manage operational risk, particularly when multiple wells demand concurrent execution. While switching is feasible, the cost of repeated underperformance (timing, reservoir outcomes, and operational friction) creates practical switching costs.
Competitive benchmarking (industry focus):
  • Halliburton (HAL) and Baker Hughes (BKR): Diversified oilfield services with broader portfolios. Their fracking businesses compete through scale and integrated offerings, but they often carry higher complexity across product lines.
  • ProFrac (PFG): A more direct peer in pressure pumping, typically competing with a basin-focused model similar to Liberty’s core service.
Liberty’s positioning: Liberty generally focuses on competitive execution within core North American unconventional basins, where logistics, fleet availability, and cost discipline determine bid-to-delivery performance. Compared with diversified majors, the company’s competitive model emphasizes operational throughput and basin-aligned execution rather than broad cross-segment integration.

🚀 Multi-Year Growth Drivers

A 5–10 year horizon for Liberty is best framed around completion intensity and the economics of decline-curve management in North American resource plays:
  • Sustained need for completions: Unconventional reservoirs typically require ongoing drilling and re-completions to offset declines, sustaining demand for frac capacity across cycles.
  • Higher intensity and efficiency improvements: Operators continually optimize well designs (pumping rates, proppant strategies, and operational sequencing). Service partners that execute efficiently and manage risk can capture incremental value.
  • Refract and production enhancement: As operators chase incremental recovery, demand can shift toward repeat completion services and improvement programs that still rely on high-quality execution.
  • Operational resilience amid input volatility: Over time, advantaged logistics and disciplined sourcing can better navigate proppant and labor cost swings, supporting relative market share during basin activity rebuilds.

⚠ Risk Factors to Monitor

  • Cyclicality and utilization risk: Pressure pumping is highly sensitive to drilling and completion budgets; lower activity can depress pricing and utilization.
  • Input cost volatility: Proppant, labor, power/fuel, and transportation costs can move unevenly, creating margin pressure if contracts do not fully pass through changes.
  • Capital intensity and equipment utilization: Maintaining and modernizing frac fleet and support infrastructure can create fixed-cost drag in low-demand environments.
  • Regulatory and environmental constraints: Water management rules, emissions controls, and local permitting can raise operating costs or affect basin development pace.
  • Execution and safety performance: Service quality and safety record influence customer retention and contract renewal, especially when multiple wells compete for frac capacity.

📊 Valuation & Market View

Oilfield services businesses such as Liberty are typically valued on cycle-adjusted earnings power rather than asset-only frameworks. Market models often reference:
  • EV/EBITDA: Multiples tend to expand when utilization and pricing hold up and contract/working-cost structures stabilize.
  • Cash flow quality: Investors evaluate whether operating leverage converts into free cash flow after capex and working-capital needs.
  • Balance sheet and liquidity: Leverage and liquidity affect resilience across downturns, influencing the perceived risk of impairment to fleet-heavy operations.
Key valuation drivers typically include utilization trends, pricing discipline, execution efficiency, and relative cost position versus peers.

🔍 Investment Takeaway

Liberty Energy’s long-term case is anchored in basin-aligned logistical execution and cost-advantaged service delivery in North American unconventional oil and gas. The practical moat emerges from operating capacity, fleet reliability, and the ability to manage input and logistics risk—factors that shape customer outcomes and translate into share gains when demand rebuilds, while still exposing the equity to the inherent cyclicality of upstream development spending.

⚠ AI-generated — informational only. Validate using filings before investing.
📰 Market News & Coverage

15 Stories Available

Real-time institutional reporting and market updates for LBRT.

gurufocus.com2026-07-31

EnerCom Announces SM Energy as a Keynote Speaker at the 31st EnerCom Denver - The Energy Investment Conference, on August 19, 2026, in Denver, Colorado

EnerCom Announces SM Energy as a Keynote Speaker at the 31st EnerCom Denver - The Energy Investment Conference, on August 19, 2026, in Denver, C

zacks.com2026-07-27

Is LBRT Stock Attractive After Its Sharp Pullback and Earnings Beat?

Liberty Energy beats Q2 estimates and trades below its subindustry on forward sales, but margin pressure and heavy growth spending keep the outlook mixed.

etftrends.com2026-07-27

The Gas-to-Nuclear Bridge for AI Data Centers

Amentum (AMTM) announced that the U.S. Department of Energy's National Nuclear Security Administration (DOE/NNSA) selected them to negotiate a phased lease at the Savannah River Site in South Carolina. The proposed public-private project would pair a 1-gigawatt (GW) AI data center with approximately 2 GW of dedicated on-site generation.

zacks.com2026-07-24

Liberty Energy Q2 Earnings Surpass Estimates, Revenues Increase Y/Y

LBRT tops Q2 earnings and revenue estimates as record utilization, pricing gains and AI-focused initiatives fuel growth despite higher costs.

gurufocus.com2026-07-23

Liberty Energy Inc (LBRT) Shares Fall 22.0% -- What GF Score of 80 Tells Investors

On July 23, 2026, Liberty Energy Inc (LBRT) shares fell 22.0% to a current price of $19.62, marking a significant drop in the context of its 52-week range of $9

marketbeat.com2026-07-23

Liberty Energy Q2 Earnings Call Highlights

Liberty Energy NYSE: LBRT reported stronger second-quarter 2026 results as utilization improved from early-year lows, while management outlined expanding ambitions in power generation for data centers and other large-load customers.

seekingalpha.com2026-07-23

Liberty Energy Inc. (LBRT) Q2 2026 Earnings Call Transcript

Liberty Energy Inc. (LBRT) Q2 2026 Earnings Call Transcript

zacks.com2026-07-22

Liberty Energy (LBRT) Q2 Earnings and Revenues Surpass Estimates

Liberty Energy (LBRT) came out with quarterly earnings of $0.09 per share, beating the Zacks Consensus Estimate of $0.07 per share. This compares to earnings of $0.12 per share a year ago.

businesswire.com2026-07-22

Liberty Energy Inc. Announces Second Quarter 2026 Financial and Operational Results

DENVER--(BUSINESS WIRE)--Liberty Energy Inc. (NYSE: LBRT; “Liberty” or the “Company”) today reported second quarter 2026 financial and operational results. Summary Results and Highlights Revenue of $1.2 billion, a 14% year-over-year increase Net income of $43 million, or $0.26 fully diluted earnings per share (“EPS”) Adjusted EBITDA1 of $151 million Distributed $15 million to shareholders through cash dividends Announced a joint venture (“JV”) with PowerBridge LLC (“PowerBridge”) to support the.

businesswire.com2026-07-22

Liberty Energy and PowerBridge Form Strategic Joint Venture to Support Powered Data Center Campus Development

DENVER & HOUSTON--(BUSINESS WIRE)--Liberty Energy Inc. (NYSE: LBRT) ("Liberty") and PowerBridge LLC ("PowerBridge") today announced the formation of a strategic joint venture (“JV”) that leverages PowerBridge's digital campus development assets and operating platform with the integrated power generation, energy management, and operational capabilities of Liberty Power Innovations ("LPI"), a Liberty Energy company. The JV's current scope is expected to support a planned 2 gigawatt (“GW”) powered.

zacks.com2026-07-17

Liberty Energy Q2 Earnings on Deck: Here's How It Will Fare

Liberty Energy Inc. LBRT is set to report second-quarter 2026 earnings on July 22, after the closing bell. The Zacks Consensus Estimate for earnings is pegged at 7 cents per share, and the same for revenues is pinned at $1.09 billion.

marketbeat.com2026-07-16

AI's Power Crunch Fuels a Pivot for These 2 Oilfield Stocks

The physical constraints of artificial intelligence (AI) are no longer bound by silicon or compute capacity. Today, the singular bottleneck choking global technology expansion is electricity.

zacks.com2026-07-15

Liberty Energy (LBRT) Expected to Beat Earnings Estimates: What to Know Ahead of Q2 Release

Liberty Energy (LBRT) possesses the right combination of the two key ingredients for a likely earnings beat in its upcoming report. Get prepared with the key expectations.

zacks.com2026-07-15

Liberty Energy and SLB Team Up to Supply Power to Data Centers

LBRT joins forces with SLB to deliver modular AI data center power and infrastructure, targeting faster deployment and scalable energy solutions.

seekingalpha.com2026-07-15

Liberty Energy: Oh My, Have Things Changed (Rating Upgrade)

Liberty Energy is upgraded to BUY as it aggressively expands its power generation business, targeting 3 GW deployable capacity by 2029. LBRT's power division, supported by a strategic SLB partnership, is projected to deliver 20% CAGR and high-teen returns through long-term PPAs. The company's diversified earnings base—power plus recovering completions—supports a higher, sustainable 9x EV/EBITDA multiple and robust long-term growth.

📊 AI Financial Analysis

Powered by StockMarketInfo
Earnings Data: Q Ending 2026-06-30

"LBRT reported Q2’26 revenue of $1.19B and net income of $43.1M, or EPS of $0.26. On a YoY basis (vs Q2’25), revenue rose about +14.0% (from ~$1.04B) and net income fell about -39.3% (from ~$71.0M), indicating a profitability slowdown despite top-line growth. QoQ (vs Q1’26), revenue increased about +16.4% (from ~$1.02B) while net income nearly doubled (+91.2%, from ~$22.6M). Profitability was volatile across the last four quarters: gross margin in Q2’26 was ~17.5%, up meaningfully from ~6.2% in Q1’26, but still below stronger periods earlier in 2025. Net margin improved to ~3.6% in Q2’26 from ~2.2% in Q1’26, yet it remains well below the ~6.8% net margin in Q2’25—consistent with YoY net income pressure. Cash flow quality weakened in Q2’26: operating cash flow was positive at ~$133M, but free cash flow was negative (~-$91M) due to heavy capex (~-$224M) and working-capital/investing timing. Balance sheet resilience improved: total assets grew to ~$4.49B and total equity to ~$1.96B; net debt improved to ~-$0.22B (net cash position). Shareholder returns appear strong given price momentum (+130.1% 1Y). Dividend yield is low (~0.37%), with no buybacks reported this quarter, but the capital appreciation likely drove total return. Analyst targets (consensus ~$34.57 vs ~$26.30 price) imply upside."

Revenue Growth

Good

Q2’26 revenue $1.19B: +16.4% QoQ (vs Q1’26) and +14.0% YoY (vs Q2’25), showing solid top-line acceleration.

Profitability

Neutral

Net income $43.1M: +91.2% QoQ but -39.3% YoY. Net margin improved vs Q1’26 (~2.2% to ~3.6%), yet remains below Q2’25 (~6.8%), indicating margin normalization/volatility.

Cash Flow Quality

Caution

Operating cash flow was positive (~$133M), but free cash flow was negative (~-$91M) due to capex (~-$224M). Cash generation dipped despite earnings improvement QoQ.

Leverage & Balance Sheet

Good

Assets and equity increased (total assets ~$4.49B; equity ~$1.96B). Net debt improved to ~-$0.22B (net cash), supporting resilience.

Shareholder Returns

Strong

Strong momentum: price +130.1% over 1Y (well above +20% threshold). Dividend yield is modest (~0.37%); no buybacks indicated in Q2’26, but capital appreciation likely dominates total return.

Analyst Sentiment & Valuation

Neutral

Consensus target ~$34.57 vs ~$26.30 current suggests upside (~31%). However, profitability volatility and negative free cash flow in the quarter temper confidence.

Disclaimer:This analysis is AI-generated for informational purposes only. Accuracy is not guaranteed and this does not constitute financial advice.

Fundamentals Overview

Loading fundamentals overview...

Liberty delivered a strong Q2 with revenue of $1.2B (+16% sequential) and adjusted EBITDA of $151M, supported by record utilization and modest pricing uplift plus higher product sales. Financial quality improved as net income rose to $43M and adjusted EPS increased to $0.09. Management highlighted two technology-driven growth engines: DigiPrime scaling (Canada deployment with a cross-border customer) and slurry logistics, quantified as replacing up to 200 sand-truckloads/day and expected to move ~1.5B pounds while cutting ~30,000 truck trips over ~7 months. The power segment is the key medium-term catalyst: SLB alliance and the PowerBridge JV (2-GW Alpha Digital) align with larger, gigawatt-plus campus demand, but earnings impact is delayed—management expects meaningful income-statement contribution in 2028, with full 3-GW impact by end of 2029. Risks center on commodity volatility, ERCOT interconnection timing, and ongoing sand/chemical margin pressure despite equipment pricing traction.

AI IconGrowth Catalysts

  • DigiPrime platform: upcoming fleet deployment in Canada tied to a cross-border customer (Canada scale-up of AI-driven frac services).
  • Commenced commercial operations of slurry (proprietary last-mile sand delivery): Rockies Basin deployment replacing up to 200 truckloads/day with ~8 miles of slurry pipe; expected ~1.5 billion pounds transported over the project.
  • Forge distributed Agentx system for fuel optimization: identifying secondary opportunities to improve fleet design, asset utilization, and fuel consumption.

Business Development

  • JV with PowerBridge (5-point infrastructure portfolio company) for powered campus development; focused scope on PowerBridge Alpha Digital (planned 2-GW powered campus in West Texas).
  • Strategic alliance with SLB: Liberty integrated power solutions + SLB modular infrastructure capabilities; collaboration on hybrid power systems, digital energy management, advanced power architectures, and waste heat recovery.
  • Liberty Wholesale Commodities: direct participation in ERCOT power markets extending CORIS offering (integration of on-site generation + retail electricity supply + market optimization).
  • Secured power generation equipment purchase agreements with Bergen Engines and Wärtsilä (and other global suppliers) to support multi-year capacity builds.

AI IconFinancial Highlights

  • Revenue: $1.2B in Q2 2026 vs $1.0B in prior quarter (+16% sequential) driven by record utilization and pricing uplift plus higher product sales.
  • Adjusted EBITDA: $151M in Q2 2026 (no prior-quarter comparator given in excerpt).
  • Net income: $43M vs $23M prior quarter; adjusted net income: $14M vs $10M prior quarter (excludes $29M of tax-effected investment gains).
  • Adjusted EPS: $0.09 vs $0.06 prior quarter; fully diluted EPS: $0.26 vs $0.14 prior quarter.
  • Tax rate: Q2 tax expense was $9M at ~18% of pretax income; expects ~25% tax expense rate for remainder of 2026 and no material cash taxes for the year.
  • Liquidity/financing: ended quarter cash $559M; net debt $736M (+$157M sequential); total liquidity ~$1B including credit facility.

AI IconCapital Funding

  • FY2026 capital expenditure outlook raised/updated: now anticipates ~$1.5B in 2026 capex (primarily higher deposit payments for long lead power generation equipment).
  • Q2 uses of cash: $15M cash dividends; net capex and long-term deposits $221M including $71M power generation deposits.
  • Shareholder actions/debt: no buyback amounts disclosed in provided transcript; net debt increased by $157M to $736M.

AI IconStrategy & Ops

  • Next-generation sand logistics: slurry pipe replacing truckloads to reduce road wear/congestion, dust and emissions; quantified project impact in Rockies Basin.
  • Power platform scaling: increased investment in critical long-lead power generation equipment and building teams for expanding power customer opportunities.
  • Commercial/pipeline shift: migration from more numerous smaller projects toward fewer, larger gigawatt-plus campus opportunities with multi-phase build-out.
  • Operational performance: record pump hours, horsepower hours, and proppant pumps during the quarter.

AI IconMarket Outlook

  • Power generation economics: management reiterated focus on 5–6-year cash-on-cash payback with ~17%–18% unlevered rate of return.
  • Timing of earnings contribution: meaningful income statement impact from power generation begins ~2028 proper, scaling afterward; by end of 2029, full income statement contribution for ~3 GW.
  • Power capacity execution: secured/planned 3 GW through end of 2029; early 2030 deliveries late 2029/early 2030.
  • Q3/near-term uncertainty: Q4 seasonality “too early to tell”; Q3 utilization expected “very, very good” with modest white space.

AI IconRisks & Headwinds

  • Commodity-driven uncertainty: customers cautious amid volatility; management cited inability to confidently forecast near-term pricing given macro/geopolitical fluctuations.
  • ERCOT/PJM interconnection timing complexity: planning around batch/interconnection group timing (including “batch zero” process) affects project timing and customer decisions.
  • Frac sand/chemical margin pressure: sand and chemical markets “still hasn’t resolved” and while volumes may rise, margins remain challenged.
  • Power market risk: hyperscalers expanding internal capabilities may compress partner involvement; also community engagement requirements add execution complexity.

Q&A: Analyst Interest

  • Power pipeline timing & financial impact: Management said power gen return hurdles remain unchanged (5–6-year cash payback, 17–18% unlevered IRR). On earnings timing, they expect early generation running in late ’27, but meaningful income-statement impact primarily in 2028 proper, scaling thereafter.
  • ERCOT/grid and return framework for large campuses: Analysts asked when capacity additions flow into results. Management emphasized capacity is stage-build-out (behind-the-meter then grid integration) with recent ERCOT rule clarifications and a 3–4 month “holding pattern” tied to interconnection/batch processes.
  • Frac pricing & capacity seasonality: Analysts pressed for “puts and takes” for Q3/Q4 after the market moved (WTI down under $70 post MOU). Management expects higher equipment prices gradually, but noted sand/chemical margins remain pressured and customer activity could swing due to macro volatility.

Sentiment: MIXED

Note: This summary was synthesized by AI from the LBRT Q2 2026 earnings transcript. Financial data is complex; please verify all metrics against official SEC filings before making investment decisions.

📋 Official Regulatory 10-K / 10-Q SEC Filings

Direct authenticated documentation links to audited SEC database reports for LBRT.

SEC EDGAR Live Feed
Loading financial data and tables...
📁

SEC Filings (LBRT)

© 2026 Stock Market Info — Liberty Energy Inc. (LBRT) Financial Profile