M-tron Industries, Inc.

M-tron Industries, Inc. (MPTI) Market Cap

M-tron Industries, Inc. has a market capitalization of $277.1M.

Price: $91.25

2.87 (3.25%)

Market Cap: 277.13M

AMEX · time unavailable

CEO: Cameron Pforr

Sector: Technology

Industry: Hardware, Equipment & Parts

IPO Date: 2022-10-03

Website: https://www.mtronpti.com

M-tron Industries, Inc. (MPTI) - Company Information

Market Cap: 277.13M|Sector: Technology

Company Profile

M-tron Industries, Inc. designs, manufactures, and markets frequency and spectrum control products. It operates in two product groups, Frequency Control and Spectrum Control. The Frequency Control product group includes a portfolio of quartz crystal resonators, clock oscillators, VCXO, TCXO OCXO, and DOCXO devices. These products are designed for applications in aerospace and defense, telecommunications infrastructure, and instrumentation markets. The Spectrum Control product group comprises an array of radio frequency (RF), microwave and millimeter wave filters, and diplexers covering a frequency range from 1 MHz to 90 GHz, and solid-state power amplifiers covering a frequency range from 300 MHz to 26 GHz, with power output from 10 Watts to 10 kWatts. The filter devices include crystal, ceramic, LC, tubular, combline, cavity, interdigital and metal insert waveguide, as well as digital, analog, and mechanical tunable filters, switched filter arrays, and RF subsystems. The power amplifiers add active devices comprise GaN, GaAS FET, LDMOS, and chip and wire technologies in narrow or broadband, module, or rack-mounted packages. These products are used in applications in the commercial and military aerospace, defense, space, and other commercial markets. The company was founded in 1965 and is based in Orlando, Florida.

Analyst Sentiment

50%
Hold

From 1 Active Polls

Consensus Target Matrix

Data feed parsing pending...

Price & Moving Averages

Loading chart...

🎯 Wall Street Analyst Intelligence Report

1-Year structural target targets, chart projections, and sentiment maps.

Average 1Y Target
$95.81
▲ +5.00% Upside
Low Target
$68.44
-25% Risk
Median Target
$93.08
2% Mid
High Target
$114.06
25% Max
Consensus
Buy
1 / 1 Buys

Consensus Trend Projection

Trailing closures vs. 12-month metrics map.

Analyst Vote Distribution

Aggregate institutional coverage sentiment weights.

📊 Historical Valuation Multiples

Real-time Trailing Twelve Month (TTM) momentum side-by-side with discrete quarterly metrics.

Fiscal QuarterTTMQ1 2026Q4 2025Q3 2025Q2 2025Q1 2025Q4 2024Q3 2024Q2 2024
Period EndingTrailing 12MMar 31, 2026Dec 31, 2025Sep 30, 2025Jun 30, 2025Mar 31, 2025Dec 31, 2024Sep 30, 2024Jun 30, 2024
Market Cap ($M)27723415715912012713611595
Enterprise Value ($M)22518213614110511312410688
Price to Earnings Ratio (P/E)34.6624.4711.4321.6619.2119.4115.9112.6513.60
Price/Earnings-to-Growth Ratio (PEG)7.6925.713.244.451.062.44
Price to Sales Ratio (P/S)4.9215.9211.0011.209.029.9410.638.688.03
Price to Book Ratio (P/B)4.373.202.484.293.443.824.354.384.01
Price to Free Cash Flow Ratio (P/FCF)31.66140.3067.0858.5658.66123.9598.0364.7187.28
Enterprise Value to Sales (EV/Sales)12.399.549.927.878.879.658.047.48
Enterprise Value to EBITDA (EV/EBITDA)18.4162.4732.5746.1849.4349.9043.6833.2137.98
Debt to Equity Ratio-4.230.000.000.000.010.000.000.000.00

MPTI Growth Runway Model

Standard long term linear growth fade

Multi-Stage Discounted Cash Flow Sandbox

Market Price$91.25
Intrinsic Value$91.19
Market Alignment
Overvalued by 0.1%relative to calculated intrinsic value
9.00%
Exp: 5%5%
i

Growth runway slowdown

This value provides a time window for the growth rate to decline beyond Stage 1 toward the terminal rate. Longer windows are most useful for companies with high growth starting conditions or strong competitive advantages. This option stretches out the growth rate slowdown across 5, 10, or 15-year steps. A high-growth starting condition (exceeding a 25% initial growth rate) automatically applies a curve decay to simulate realistic, rapid market saturation.
i

Terminal growth rate

With long-term inflation between 3-5%, revenue must grow by that baseline to maintain flat real-world market share. This value sets the permanent terminal growth rate to factor into the valuation beyond the growth slowdown runway toward maturity.

3-Stage Financial Runway Horizon

🧠 Perpetuity Horizon Engine (Stage 3: Post-2035)

Terminal FCF Base$0.02B
Perpetuity TV Value$0.38B
Discounted TV (PV)$0.16B
TV Weighting %60.2%
⚠️
Financial Model Disclaimer & Risk Disclosure: This interactive scenario simulator is an educational sandbox provided strictly for informational and analytical research purposes. Core historical financial statements and consensus estimates are sourced directly via Financial Modeling Prep (FMP). All downstream outputs are entirely deterministic, hypothetical projections generated by combining automated mathematical formulas (including linear interpolation and Gaussian bell-curve decay models) with user-selected variables and third-party financial data inputs. Users assume all liability for trading decisions executed based on these sandbox calculations.

📘 Full Research Report

ℹ️

AI-Generated Research: This report is for informational purposes only.

📘 M TRON INDUSTRIES INC (MPTI) — Investment Overview

🧩 Business Model Overview

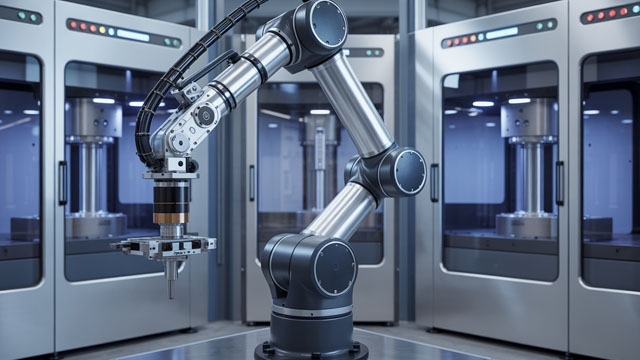
M TRON INDUSTRIES INC operates as a contract manufacturer/industrial production provider, supplying engineered products and manufacturing services to customers that require qualified, repeatable production output. The value chain typically includes (1) sales and customer qualification for specific programs, (2) production planning and procurement of components/materials, (3) manufacturing and quality controls, and (4) delivery and ongoing fulfillment for replacement volumes and new program phases. Customer stickiness tends to arise once a product is designed around the supplier’s processes, approvals, and quality systems—reducing the likelihood of rapid re-sourcing.

💰 Revenue Streams & Monetisation Model

Revenue is generally program- and order-driven, with monetisation primarily tied to:
  • Manufacturing revenue (transactional): unit production, builds, and fulfillment tied to customer demand.
  • Program follow-ons (quasi-recurring): repeat production for ramp phases, ongoing builds, and order replenishments for the life of the customer program.
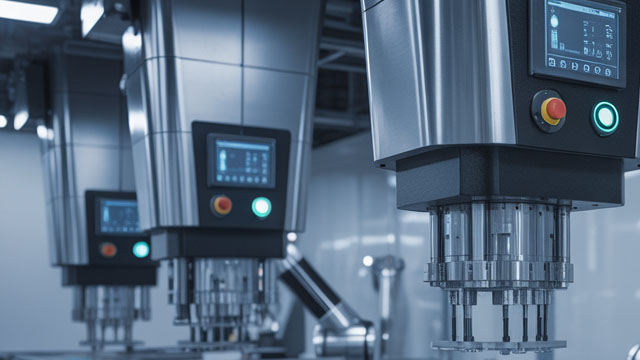
  • Value-add services (margin-dependent): higher-margin production complexity, engineering support, test/assembly, and logistics execution when included in customer contracts.
Primary margin drivers include gross margin mix (product complexity and service content), procurement discipline (component sourcing terms), factory utilization, manufacturing yield/defect rates, and contract structure (whether pricing is fixed, partially indexed, or pass-through for key inputs).

🧠 Competitive Advantages & Market Positioning

MPTI’s most relevant “moat” is typically switching costs and qualification-driven friction rather than pure scale. Once MPTI is approved for a customer’s production program, re-qualification and process transfer can be costly in time and risk for the buyer. That dynamic supports customer retention and makes demand for certified capacity more defensible. Competitive benchmarking:
  • Sanmina (SANM) and Jabil (JBL): larger, diversified industrial/technology manufacturing footprints with broader customer coverage and purchasing leverage.
  • Flex (FLEX): strong program management and global supply chain capabilities across multiple end markets.
Positioning contrast: Compared with these peers, MPTI is more likely to compete on customer-specific execution, responsiveness, and program qualification rather than on sheer balance-sheet scale. The defensibility comes from remaining approved and performant within defined customer programs—an approach where quality systems, delivery reliability, and process stability matter more than “headline” size.

🚀 Multi-Year Growth Drivers

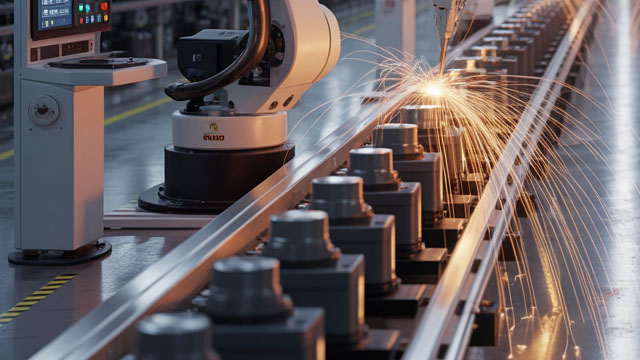
Over a 5–10 year horizon, growth is commonly driven by:
  • Manufacturing outsourcing and specialization: customers continue to seek suppliers who can deliver complexity with consistent quality and production discipline.
  • Product complexity and testing requirements: as products require more validation, assembly steps, and quality assurance, qualified suppliers can capture more value-add per unit.
  • Program lifecycle expansion: ramp-to-run progression and follow-on phases can extend revenue duration for retained programs.
  • Supply chain reshoring/nearshoring initiatives: geographic and execution reliability can shift incremental production toward suppliers with proven operational execution.

⚠ Risk Factors to Monitor

Key structural and operating risks include:
  • Customer concentration: contract manufacturing economics can be sensitive to the loss of programs or reduced unit volumes from major customers.
  • Pricing and input-cost pressure: if contracts are not flexible enough, component inflation or unfavorable mix can compress gross margin.
  • Quality and yield risk: defect rates, rework, warranty exposure, or failed qualification can damage program economics and renewal prospects.
  • Inventory and obsolescence: working capital can be strained when demand forecasts miss, especially in products with rapid redesign cycles.
  • Operational scale constraints: when larger peers bid aggressively, smaller suppliers can face margin pressure unless they maintain differentiated execution or niche program depth.

📊 Valuation & Market View

The market typically values contract manufacturing and industrial services through enterprise value relative to operating cash flow/earnings, with emphasis on:
  • Margin sustainability: ability to maintain gross margin through mix, yield, and procurement discipline.
  • Utilization and working capital intensity: factory throughput and inventory/payment terms materially influence returns.
  • Program durability: revenue visibility improves when contracts are linked to longer production lifecycles or repeatable follow-on volumes.
In practice, sentiment and valuation often move with (1) evidence of stable yields and delivery performance, (2) mix shift toward value-add production/test, and (3) proof of customer program retention.

🔍 Investment Takeaway

M TRON INDUSTRIES INC’s long-term investment case is grounded in qualification-driven switching costs and the economics of remaining an approved, reliable production partner within customer programs. While the company likely faces stronger competitive scale from larger contract manufacturers, the core durability can come from consistent quality execution, procurement and operational discipline, and the ability to capture value-add steps that increase the cost and risk of re-sourcing.

⚠ AI-generated — informational only. Validate using filings before investing.

📰 Market News & Coverage

15 Stories Available

Real-time institutional reporting and market updates for MPTI.

prnewswire.com2026-06-04

M-tron Industries, Inc. to Present and Host 1x1 Investor Meetings at the 16th Annual East Coast IDEAS Investor Conference on June 11th in New York, NY

ORLANDO, Fla., June 4, 2026 /PRNewswire/ -- M-tron Industries, Inc. (NYSE American: MPTI) ("Mtron" or the "Company") today announced Cameron Pforr, Chief Executive Officer, and Chris Nossokoff, Vice President – Financial Reporting, will present at the East Coast IDEAS Investor Conference on Thursday June 11, 2026 at The Westin Times Square in New York, NY.

seekingalpha.com2026-05-28

M-tron Industries Could Benefit From Tight U.S. Defense Inventory

M-tron Industries is rated a long-term buy, offering GARP appeal and a strong growth-profitability-valuation trifecta. MPTI's critical RF components drive a 17-month sales backlog, robust DoD contracts, and expanding radar application demand. Q1 2026 saw 15.4% revenue growth, a 44.9% gross margin, and a pristine, debt-free balance sheet with $52M cash.

seekingalpha.com2026-05-13

M-tron Industries, Inc. (MPTI) Q1 2026 Earnings Call Prepared Remarks Transcript

M-tron Industries, Inc. (MPTI) Q1 2026 Earnings Call Prepared Remarks Transcript

zacks.com2026-05-07

M-tron Industries, Inc. (MPTI) Q1 Earnings and Revenues Top Estimates

M-tron Industries, Inc. (MPTI) came out with quarterly earnings of $0.67 per share, beating the Zacks Consensus Estimate of $0.61 per share. This compares to earnings of $0.56 per share a year ago.

prnewswire.com2026-05-07

M-tron Industries, Inc. Reports First Quarter 2026 Results

Revenues increased 15.3%, or $2.0 million, to $14.7 million for the three months ended March 31, 2026 from $12.7 million for the three months ended March 31, 2025 Gross margin improved to 44.9% for the three months ended March 31, 2026 from 42.5% for the three months ended March 31, 2025 Net income per diluted share increased $0.11 to $0.67 for the three months ended March 31, 2026 from $0.56 for the three months ended March 31, 2025 Backlog increased $21.3 million, or 38.4%, to $76.8 million as of March 31, 2026 from $55.5 million as of March 31, 2025 ORLANDO, Fla., May 7, 2026 /PRNewswire/ -- M-tron Industries, Inc. (NYSE American: MPTI) ("Mtron" or the "Company"), a U.S.-based designer and manufacturer of highly-engineered electronic components and solutions for the aerospace and defense, avionics, and space industries, announced its financial results for the three months ended March 31, 2026.

prnewswire.com2026-05-05

M-tron Industries, Inc. Reminds Investors of Upcoming Investor Day on May 12, 2026

ORLANDO, Fla., May 4, 2026 /PRNewswire/ -- M-tron Industries, Inc. ("Mtron" or the "Company") today reminded investors that it will host its previously announced Investor Day on Tuesday, May 12, 2026 and encourages all interested attendees to register.

zacks.com2026-04-30

Quanta Services (PWR) Tops Q1 Earnings and Revenue Estimates

Quanta Services (PWR) came out with quarterly earnings of $2.68 per share, beating the Zacks Consensus Estimate of $2.04 per share. This compares to earnings of $1.78 per share a year ago.

prnewswire.com2026-04-27

M-tron Industries, Inc. Announces Completion of Rights Offering

ORLANDO, Fla., April 27, 2026 /PRNewswire/ -- M-tron Industries, Inc. (NYSE American: MPTI) ("Mtron" or the "Company"), a U.S.-based designer and manufacturer of highly-engineered electronic components and solutions for the aerospace and defense, avionics, and space industries, announced today the completion of its previously announced rights offering (the "Rights Offering"), which expired at 5:00 p.m.

zacks.com2026-04-23

M-tron Industries, Inc. (MPTI) Declines More Than Market: Some Information for Investors

M-tron Industries, Inc. (MPTI) closed the most recent trading day at $61.27, moving 3.36% from the previous trading session.

prnewswire.com2026-04-21

M-tron Industries, Inc. Announces Preliminary Results of Rights Offering

ORLANDO, Fla., April 21, 2026 /PRNewswire/ -- M-tron Industries, Inc. (NYSE American: MPTI) ("Mtron" or the "Company"), a U.S.-based designer and manufacturer of highly-engineered electronic components and solutions for the aerospace and defense, avionics, and space industries, announced today the preliminary results of its previously announced rights offering (the "Rights Offering").

prnewswire.com2026-04-16

M-tron Industries, Inc. Awarded $2.7 Million Production Contract for a Major Defense Radar Program

ORLANDO, Fla., April 16, 2026 /PRNewswire/ -- M-tron Industries, Inc. (NYSE American: MPTI) ("Mtron"), a leading provider of high-performance radio frequency ("RF") components and solutions, announced an order for approximately $2.7 million from one of the rising U.S. Department of Defense contractors in support of a major C-UAS radar program.

zacks.com2026-04-15

M-tron Industries, Inc. (MPTI) Stock Drops Despite Market Gains: Important Facts to Note

M-tron Industries, Inc. (MPTI) closed the most recent trading day at $66, moving 2.16% from the previous trading session.

prnewswire.com2026-04-09

M-tron Industries, Inc. Announces Extension of Previously Announced Rights Offering

ORLANDO, Fla., April 9, 2026 /PRNewswire/ -- M-tron Industries, Inc. (NYSE American: MPTI, MPTI RT) ("Mtron" or the "Company") today announced that it has extended the expiration of the rights offering to purchase shares of Mtron's common stock, par value $0.01 per share (the "Common Stock"), distributed on March 30, 2026 (the "Rights"), until 5:00 p.m.

zacks.com2026-04-06

M-tron Industries, Inc. (MPTI) Stock Drops Despite Market Gains: Important Facts to Note

M-tron Industries, Inc. (MPTI) closed at $66.83 in the latest trading session, marking a -3.44% move from the prior day.

seekingalpha.com2026-04-02

M-Tron Industries: A Hidden RF Player Behind Missile Systems, Fairly Valued

M-Tron Industries (MPTI) is a niche RF component manufacturer with strong growth prospects in aerospace, defense, and communications markets. MPTI delivered double-digit sales and EBITDA growth in 2023, but margin pressure from tariffs and ramp-up costs persists. I assign a hold rating as MPTI is fairly valued against its own EV/EBITDA median, despite being undervalued versus peers.

📊 AI Financial Analysis

Powered by StockMarketInfo
Earnings Data: Q Ending 2026-03-31

"MPTI reported Q1 2026 revenue of $14.69M and net income of $2.39M (EPS: $0.68). Versus Q1 2025, revenue rose from $12.73M to $14.69M (+15.3% YoY) and net income increased from $1.63M to $2.39M (+46.5% YoY). QoQ, revenue edged up from $14.23M (Q4 2025) to $14.69M (+3.3%), while net income rose from $3.43M (Q4) to $2.39M (-30.3%), indicating profit volatility despite steady top-line growth. Profitability improved over the last year: gross margin expanded to 44.9% from 42.5% in Q1 2025, and net margin increased to 16.3% from 12.8%. Over the most recent 4-quarter sequence, margins look structurally higher than the early-year quarters, though Q4 2025 was exceptionally profitable (net margin 24.1%) and Q1 2026 normalized. Cash flow remains strong for the quarter: operating cash flow was $2.12M and free cash flow $1.67M, converting profit into cash. The balance sheet is highly liquid (cash/short-term investments ~$51.96M) with minimal leverage (total debt $0.13M; net debt -$51.8M), providing resilience. Total shareholder returns are supportive: the stock is up +37.2% over 1 year, and there were no dividends paid or share repurchases reported this quarter, implying gains are driven primarily by capital appreciation. Given the surge in price momentum, valuation risk is a key watch item."

Revenue Growth

Strong

Revenue grew +15.3% YoY (Q1 2026: $14.69M vs $12.73M) and was up +3.3% QoQ (vs Q4 2025: $14.23M), showing consistent demand.

Profitability

Good

Net income rose +46.5% YoY ($2.39M vs $1.63M). Margins improved vs last year (gross margin 44.9% vs 42.5%; net margin 16.3% vs 12.8%), though QoQ net income declined (-30.3%) as margins normalized from the very strong Q4.

Cash Flow Quality

Good

Operating cash flow was $2.12M and free cash flow $1.67M in Q1 2026, supporting earnings quality. No dividends paid; buybacks not reported.

Leverage & Balance Sheet

Excellent

Extremely low leverage and strong liquidity: cash/short-term investments $51.96M, total assets $79.30M, total debt $0.13M, and net debt of about -$51.8M. Equity also increased to $73.05M.

Shareholder Returns

Strong

1-year price momentum is strong (+37.2%), exceeding the 20% threshold. With no dividend and no buyback activity reported this quarter, total returns are likely primarily capital appreciation.

Analyst Sentiment & Valuation

Positive

Valuation appears elevated (e.g., trailing P/E ~24.5; price-to-sales ~15.9 based on provided ratios). Positive momentum helps sentiment, but the multiple leaves less margin of safety.

Disclaimer:This analysis is AI-generated for informational purposes only. Accuracy is not guaranteed and this does not constitute financial advice.

Fundamentals Overview

Loading fundamentals overview...

MPTI delivered Q4 strength with revenues of $14.2M (+11.2% YoY) and diluted EPS of $0.99 ($0.73 prior year), while adjusted EBITDA rose 46.8% to $4.5M despite a slight gross margin decline to 46.9% (from 47.2%). The key tension is growth vs profitability: tariffs and less favorable product mix tied to new product introductions pressured FY gross margin (44.4% vs 46.2%), with management estimating tariffs reduced gross margin by ~1% in 2025. The business momentum is clearer on backlog: $76.4M end-of-quarter, +62% vs Dec 31, 2024, driven by defense/aerospace and avionics. Management ties demand to 7-year Department of War production agreements involving Lockheed Martin and Raytheon, with MPTI positioned as a significant precision-guided munition vendor—though incremental capacity gains depend on winning design slots. To capitalize on a more M&A/bid-driven environment, MPTI raised ~$27.5M via a warrant offering, has up to $20M available under a Fifth Third revolver (undrawn), and launched/announced a rights offering for early 2026 execution optionality. Outlook is constructive for radar/electronic warfare and commercial avionics through 2035, but margins remain exposed to tariff variability.

AI IconGrowth Catalysts

  • 62% increase in backlog vs Dec 31, 2024 ($76.4M vs $47.2M), driven by defense and aerospace plus avionics
  • Defense program product strength and improved avionics shipments in Q4
  • Radar and electronic warfare growth (redesign of military fire control radars for hypersonic to loitering drone threats; mid-range radar for counter-drone missions)
  • Commercial avionics shipments supported by serving Boeing and Airbus suppliers; products used in 15 to 17 applications on every commercial airframe Airbus/Boeing produce
  • Demand visibility through 2035 as airframe inventories depleted and orders flow from backlog

Business Development

  • 7-year production agreements with the Department of War (named primes: Lockheed Martin and Raytheon); MPTI described as a significant vendor for precision-guided munition programs and precision-guided munition-related content
  • Golden Dome initiatives referenced as a potential source of more space opportunities in 2027-2028
  • Drones: supplies components/solutions to drone manufacturers/primes (since 2014) and participates with primes producing larger ISR/kinetic drones (examples mentioned: Global Hawk, Reaper class); explicitly does not participate in FPV drones
  • Formation of 3 strategic partnerships with complementary product companies in 2025 (no partner names provided)

AI IconFinancial Highlights

  • Q4 2025 total revenues: $14.2M, +11.2% YoY
  • Q4 2025 gross margin: 46.9% vs 47.2% in Q4 2024 (sequential improvement implied; impacted by tariffs and product mix)
  • Tariff impact disclosed: in FY 2025 tariffs impacted gross margins by about 1%
  • Q4 2025 EPS (diluted): $0.99 vs $0.73 prior year
  • Q4 2025 adjusted EBITDA: $4.5M vs $3.1M in Q4 2024 (+46.8%); increase attributed to higher revenues and lower engineering/sales/SG&A as % of revenue, offset by lower gross margins
  • FY 2025 total revenues: $54.4M, +11.2% YoY
  • FY 2025 gross margin: 44.4% vs 46.2% in 2024 (down due to higher tariff-related costs and less favorable product mix tied to new product introductions)
  • FY 2025 net income: $8.4M / $2.62 diluted EPS vs FY 2024 $7.6M / $2.65 diluted EPS (management cited revenue growth partially offset by higher cost of sales)
  • Incentive compensation accounting: reversed $860,000 in earlier accrued incentive compensation expense; management said this had a favorable 6% impact on Q4 results
  • Balance-sheet actions related to cash generation: FY 2025 cash from operations added $10.7M

AI IconCapital Funding

  • New loan agreement with Fifth Third Bank (signed Dec 2025): ability to borrow up to $20M at competitive rate based on leverage; currently no debt outstanding and line not drawn
  • Warrant offering closed: fully subscribed; 580,233 shares issued; net proceeds $27.5M
  • Cash at period end: $20.9M; additional $27.5M transferred to company in early Jan 2026 (from transfer agent)
  • Rights offering announced: record date March 27, 2026; expected to launch early next week; rights expire April 15, 2026; five rights required to purchase 1 share; subscription price expected to be 10% to 12% discount to trailing 5-day VWAP; proceeds intended to fund accretive acquisitions/carve-outs and investment/scale needs (amount not specified)

AI IconStrategy & Ops

  • Production facility and line equipment upgrades to prepare for increased demand
  • Strategic investment in R&D and increased RFQ activity to generate visibility
  • Defense sector actions: being asked to bid on components for 7-year engagement contracts; expected additional production volume increases through late 2027/2028 only if significant design slots are won
  • Greater emphasis on inorganic growth: combining organic growth with partnership and acquisitions; rights offering explicitly to support acquisition/carve-out execution certainty and prime confidence

AI IconMarket Outlook

  • 2026-2027-2028 growth emphasis: radar and electronic warfare highlighted for strong growth
  • Commercial avionics expectations: orders for components/subsystems projected to remain strong through 2035 (as referenced)
  • Tariff outlook: expects a slightly more favorable tariff environment in 2026/forward, but tariffs remain a moving target with new changes starting to be implemented
  • Drone exposure quantification target for 2026 and radar systems exposure: management estimated total around roughly $4M for drone exposure plus radar systems combined (analyst asked drone exposure and radar systems revenue; response indicated ~$4M total)

AI IconRisks & Headwinds

  • Tariffs: FY 2025 gross margin down; tariffs impacted gross margins by about 1% in 2025; management indicated impact less in 2026 but still moving target
  • Product mix from new product introductions creating residual margin pressure (residual mix issues referenced for December 2025)
  • Dependence on defense/primes bid/slot wins: additional production volume increase contingent on winning design slots for component bids
  • Drone-related go/no-go scope: explicit exclusion of FPV drones due to reliability/cost constraints; exposure limited to larger ISR/kinetic drone class and radar counter-drone redesign demand
  • Incentive plan dynamics: 2025 results did not meet annual plan expectations; reversal of accrued incentive compensation helped Q4 but highlights execution sensitivity to plan performance

Sentiment: MIXED

Note: This summary was synthesized by AI from the MPTI Q4 2025 (ended Dec 31, 2025; FY 2025 results also discussed) earnings transcript. Financial data is complex; please verify all metrics against official SEC filings before making investment decisions.

📋 Official Regulatory 10-K / 10-Q SEC Filings

Direct authenticated documentation links to audited SEC database reports for MPTI.

SEC EDGAR Live Feed
Loading financial data and tables...
📁

SEC Filings (MPTI)

© 2026 Stock Market Info — M-tron Industries, Inc. (MPTI) Financial Profile