Meritage Homes Corporation

Meritage Homes Corporation (MTH) Market Cap

Meritage Homes Corporation has a market capitalization of $4.68B.

Price: $70.20

-0.61 (-0.86%)

Market Cap: 4.68B

NYSE · time unavailable

CEO: Phillippe Lord

Sector: Consumer Cyclical

Industry: Residential Construction

IPO Date: 1988-07-26

Website: https://www.meritagehomes.com

Meritage Homes Corporation (MTH) - Company Information

Market Cap: 4.68B|Sector: Consumer Cyclical

Company Profile

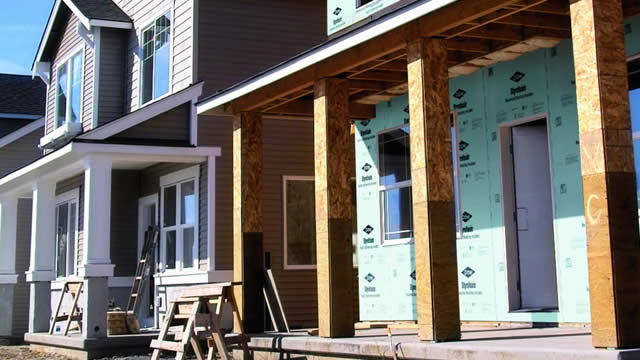
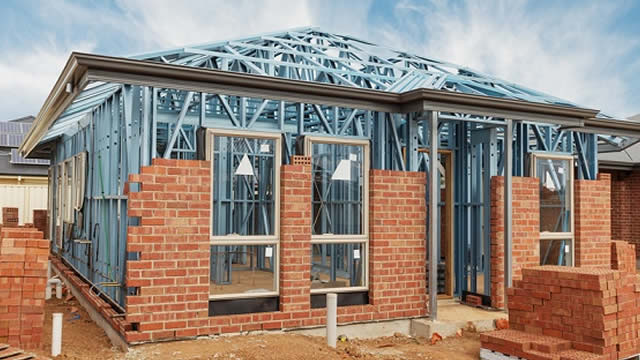
Meritage Homes Corporation, alongside its associated companies, focuses on the design and construction of single-family residences throughout the United States. The enterprise operates primarily through two distinct divisions: home construction and financial services. Its core business involves acquiring and developing land, followed by the building, marketing, and selling of homes, predominantly targeting first-time buyers and those seeking their initial upgrade. Furthermore, the company provides its homebuyers with crucial services such as title insurance and support for closing and settlement processes. Meritage Homes constructs and sells properties under its own brand name across a wide geographic footprint, including Texas, Arizona, California, Colorado, Florida, North Carolina, South Carolina, Georgia, and Tennessee. The company was established in 1985 and has its corporate headquarters situated in Scottsdale, Arizona.

Analyst Sentiment

70%
Buy

From 9 Active Polls

1Y Forecast: $87.00

▲ +23.9% Potential Upside

Consensus Target Metrics

Low Bound

$80

Median

$88

High Bound

$93

Average

$87

Price & Moving Averages

Loading chart...

🎯 Wall Street Analyst Intelligence Report

1-Year structural target targets, chart projections, and sentiment maps.

Average 1Y Target
$87.00
▲ +23.93% Upside
Low Target
$80.00
14% Risk
Median Target
$88.00
25% Mid
High Target
$93.00
32% Max
Consensus
Buy
18 / 38 Buys

Consensus Trend Projection

Trailing closures vs. 12-month metrics map.

Analyst Vote Distribution

Aggregate institutional coverage sentiment weights.

📊 Historical Valuation Multiples

Real-time Trailing Twelve Month (TTM) momentum side-by-side with discrete quarterly metrics.

Fiscal QuarterTTMQ2 2026Q1 2026Q4 2025Q3 2025Q2 2025Q1 2025Q4 2024Q3 2024
Period EndingTrailing 12MJun 30, 2026Mar 31, 2026Dec 31, 2025Sep 30, 2025Jun 30, 2025Mar 31, 2025Dec 31, 2024Sep 30, 2024
Market Cap ($M)4,6835,5824,1664,5575,1194,8015,0975,5747,429
Enterprise Value ($M)5,6836,5835,2065,6716,2815,7545,9796,3147,969
Price to Earnings Ratio (P/E)14.6315.3018.8513.6012.938.1710.368.049.46
Price/Earnings-to-Growth Ratio (PEG)0.4916.750.415.10
Price to Sales Ratio (P/S)0.863.793.713.173.592.943.743.444.65
Price to Book Ratio (P/B)0.921.100.820.880.970.910.981.081.48
Price to Free Cash Flow Ratio (P/FCF)11.2930.3542.9519.14-49.08692.34-105.82-52.07-74.28
Enterprise Value to Sales (EV/Sales)4.474.633.954.413.524.383.894.99
Enterprise Value to EBITDA (EV/EBITDA)11.2636.1166.3351.6446.7928.8135.9927.6731.07
Debt to Equity Ratio1.980.360.350.360.360.360.360.270.27

📘 Full Research Report

ℹ️

AI-Generated Research: This report is for informational purposes only.

📘 MERITAGE CORP (MTH) — Investment Overview

🧩 Business Model Overview

Meritage builds and sells single-family homes in the United States, translating land ownership and development capabilities into deliverable housing supply. The operating flow is straightforward: acquire and develop home sites (often with an emphasis on Sunbelt markets), plan and permit communities, construct homes using repeatable designs and standardized building processes, and monetize through home closings. Revenue is generated at delivery/closing rather than through ongoing subscription-like arrangements, making demand and timing dependent on the housing cycle and the company’s ability to manage construction schedules and cost discipline.

Customer “stickiness” exists primarily through product and process—efficient communities, predictable construction quality, and the capacity to deliver options—rather than contractual lock-in. The structural advantage comes from controlling inputs (land pipeline and construction execution) and maintaining operational efficiency through cycles.

💰 Revenue Streams & Monetisation Model

The monetisation model is predominantly transactional:

  • Home sales (primary revenue): recognition upon closing/delivery of completed homes. Gross margin depends on home pricing, construction costs, and the basis of land and development costs.
  • Land-related activities (secondary): occasional gains/losses or revenue tied to land transactions and development activities, depending on community strategy.
  • Warranty/other (limited): typically not a major driver versus the delivery of homes.

Margin drivers are structural within the business rather than purely cyclical: (1) land cost discipline and community phasing, (2) construction productivity and labor efficiency, (3) materials procurement and specifications strategy, and (4) SG&A leverage as volume scales through the delivery pipeline.

🧠 Competitive Advantages & Market Positioning

Meritage’s moat is best characterized as a cost-and-execution advantage supported by market-specific land and community know-how. Competitors can build homes, but consistently earning superior margins depends on how well a builder secures attractive land, manages development risk, and executes construction productivity—especially when input costs and demand vary.

  • Cost advantage through repeatable operations: standardized product platforms, construction workflows, and community management reduce variability in schedule and cost.
  • Land pipeline and site-level discipline: the company’s ability to control development timing and lot-level economics helps protect margins when pricing pressure appears.
  • Geographic and demographic focus (Sunbelt concentration): demand tends to be anchored by population growth, household formation, and migration patterns, supporting a steady throughput of planned communities.

Competitive benchmarking:

  • D.R. Horton (DHI): larger, broader scale across the U.S.; competes more directly across many geographies with similar entry-to-mid home positioning.
  • Lennar (LEN): strong balance sheet and operational scale; competes with similar volume strategies and community rollouts.
  • PulteGroup (PHM) / Toll Brothers (TOL) (subset comparison): Pulte has overlapping price points; Toll leans more upscale and faces different demand drivers and cost structures.

Meritage’s relative positioning emphasizes efficient execution and a focus on markets where supply/demand dynamics can support attainable pricing, while balancing land risk through disciplined community planning. Versus large-scale peers, the competitive challenge is often scale; the counter is efficiency, land selectivity, and product consistency within target affordability bands.

🚀 Multi-Year Growth Drivers

A 5–10 year outlook for Meritage is anchored more in structural housing supply and demographic demand than in short-term rate cycles:

  • Structural housing shortage: persistent undersupply relative to household formation supports a longer-run need for new single-family construction.
  • Sunbelt demographic tailwinds: population growth and migration patterns tend to concentrate demand in faster-growing regions where Meritage holds development exposure.
  • Housing affordability and product execution: buyers often seek value within attainable price bands; operational efficiency can support competitive pricing without sacrificing margin targets.
  • Operational learning curve: productivity improvements in construction, land development sequencing, and procurement help defend margins through volatility.

TAM expansion in housing is cyclical in timing but durable in need: households must be formed and rehoused, and the replacement of aging housing stock and the consumption of new lot demand create a multi-year construction pipeline for well-positioned builders.

⚠ Risk Factors to Monitor

  • Interest-rate and credit sensitivity: demand for mortgages and buyer affordability can shift quickly, impacting sales pace and pricing.
  • Construction and material inflation: labor availability, wages, and input costs can pressure gross margin if contract structures or procurement timing do not offset increases.
  • Land and development risk: land pricing, entitlement timelines, and unexpected site-development costs can impair community economics.
  • Regulatory and permitting constraints: zoning, building codes, environmental requirements, and local approval processes can delay volume.
  • Concentration risk: geographic concentration can amplify exposure to regional economic shocks, natural disasters, and local housing supply changes.
  • Balance-sheet and capital intensity: homebuilding requires ongoing working capital for land, development, and construction; funding conditions affect flexibility through the cycle.

📊 Valuation & Market View

Equity markets generally value homebuilders using metrics that reflect both cyclicality and balance-sheet discipline, since earnings can be volatile:

  • Price-to-book / tangible book: often used to gauge asset-backed value and capital allocation quality.
  • EV/EBITDA or earnings multiples: used cautiously due to cyclical compressions and expansions in gross margin.
  • Operating indicators: backlog quality, delivery pace, land position economics, and the ability to maintain margin during cost spikes can matter more than headline earnings levels.
  • Key valuation drivers: gross margin durability, SG&A leverage, land conversion efficiency, and capital returns supported by balance-sheet resilience.

Because homebuilding earnings are tied to timing of closings and cost cycles, valuation tends to move with expectations for margin stability and delivery growth rather than with long-duration growth narratives.

🔍 Investment Takeaway

Meritage is positioned to benefit from a structurally supported need for new single-family housing, with an investment case centered on cost-and-execution advantages derived from land/community discipline and construction productivity. The primary challenge is that results remain sensitive to mortgage affordability and construction input costs; therefore, long-term value hinges on maintaining superior community economics and schedule discipline through cycle volatility.


⚠ AI-generated — informational only. Validate using filings before investing.
📰 Market News & Coverage

15 Stories Available

Real-time institutional reporting and market updates for MTH.

marketbeat.com2026-07-31

Meritage Homes Q2 Earnings Call Highlights

Meritage Homes NYSE: MTH reported lower second-quarter sales, revenue and earnings as affordability pressures and economic uncertainty contributed to a slower-than-normal spring selling season. Still, management said demand was broadly stable sequentially, construction costs improved and the company maintained its full-year outlook for community growth while raising its expectations for 2026 closings and revenue.

thenewswire.com2026-07-31

Updated: Mithril Silver and Gold June 2026 Quarterly Report Upgraded T1 MRE and District Expansion Drill Program

Melbourne, Australia and Vancouver, Canada – TheNewswire - July 31, 2026 - Mithril Silver and Gold Limited ("Mithril” or the "Company") (TSXV: MSG) (ASX: MTH) (OTCQB: MTIRF) is pleased to report on its quarterly activities and cash flow for its Copalquin and La Dura properties in Durango State, Mexico for the period ended June 30, 2026 . EXPLORATION HIGHLIGHTS

thenewswire.com2026-07-31

Mithril Silver And Gold June 2026 Quarterly Report Upgraded T1 MRE And District Expansion Drill Program

Melbourne, Australia and Vancouver, Canada – July 31, 2026 – TheNewswire - Mithril Silver and Gold Limited ("Mithril” or the "Company") (TSXV: MSG) (ASX: MTH) (OTCQB: MTIRF) is pleased to report on its quarterly activities and cash flow for its Copalquin and La Dura properties in Durango State, Mexico for the period ended June 30, 2026 . EXPLORATION HIGHLIGHTS

seekingalpha.com2026-07-30

Meritage Homes Corporation (MTH) Q2 2026 Earnings Call Transcript

Meritage Homes Corporation (MTH) Q2 2026 Earnings Call Transcript

zacks.com2026-07-29

Compared to Estimates, Meritage (MTH) Q2 Earnings: A Look at Key Metrics

Although the revenue and EPS for Meritage (MTH) give a sense of how its business performed in the quarter ended June 2026, it might be worth considering how some key metrics compare with Wall Street estimates and the year-ago numbers.

zacks.com2026-07-29

Meritage Homes (MTH) Surpasses Q2 Earnings Estimates

Meritage Homes (MTH) came out with quarterly earnings of $1.42 per share, beating the Zacks Consensus Estimate of $1.3 per share. This compares to earnings of $2.04 per share a year ago.

globenewswire.com2026-07-29

Meritage Homes reports second quarter 2026 results

SCOTTSDALE, Ariz., July 29, 2026 (GLOBE NEWSWIRE) -- Meritage Homes Corporation (NYSE: MTH), the fifth-largest U.S. homebuilder, reported second quarter results for the period ended June 30, 2026.

zacks.com2026-07-15

MTH or NVR: Which Is the Better Value Stock Right Now?

Investors looking for stocks in the Building Products - Home Builders sector might want to consider either Meritage Homes (MTH) or NVR (NVR). But which of these two stocks is more attractive to value investors?

zacks.com2026-07-13

Landmark Housing Affordability Bill Becomes Law: ETFs in Focus

The new U.S. housing law could boost homebuilding and housing stocks, putting homebuilder ETFs like ITB and XHB in focus.

zacks.com2026-06-24

New Strong Sell Stocks for June 24th

CWCO, GSL and MTH have been added to the Zacks Rank #5 (Strong Sell) List on June 24th, 2026.

globenewswire.com2026-06-11

Meritage Homes Second Quarter 2026 Earnings Conference Call and Webcast Scheduled for July 30, 2026

SCOTTSDALE, Ariz., June 11, 2026 (GLOBE NEWSWIRE) -- Meritage Homes Corporation (NYSE: MTH), the fifth largest public homebuilder in the U.S., plans to release the Company's second quarter 2026 results on Wednesday, July 29, 2026 after the market closes. Management will host a conference call to discuss the results at 8:00 a.m. Pacific Time (11:00 a.m. Eastern Time) on Thursday, July 30, 2026.

zacks.com2026-05-22

Why Is Meritage (MTH) Down 8.6% Since Last Earnings Report?

Meritage (MTH) reported earnings 30 days ago. What's next for the stock?

globenewswire.com2026-05-21

Meritage Homes Announces Quarterly Cash Dividend

SCOTTSDALE, Ariz., May 21, 2026 (GLOBE NEWSWIRE) -- Meritage Homes Corporation (NYSE: MTH, “Meritage” or the “Company”), the fifth-largest homebuilder in the U.S., today announced that its Board of Directors has declared a quarterly dividend of $0.48 per share. This dividend is payable on June 30, 2026 to shareholders of record as of the close of trading on June 16, 2026.

globenewswire.com2026-05-21

Meritage Homes Announces Quarterly Cash Dividend

SCOTTSDALE, Ariz. , May 21, 2026 (GLOBE NEWSWIRE) -- Meritage Homes Corporation (NYSE: MTH, "Meritage" or the "Company"), the fifth-largest homebuilder in the U. S. , today announced that its Board of Directors has declared a quarterly dividend of $0. 48 per share.

seekingalpha.com2026-05-21

Meritage Homes Corporation (MTH) Shareholder/Analyst Call Prepared Remarks Transcript

Meritage Homes Corporation (MTH) Shareholder/Analyst Call Prepared Remarks Transcript

📊 AI Financial Analysis

Powered by StockMarketInfo
Earnings Data: Q Ending 2026-06-30

"Mettler/Metallurgical? (Ticker: MTH) reported Q2’26 Revenue of $1.394B and Net Income of $184.9M (EPS $1.37). On a YoY basis versus Q2’25, Revenue declined (1394.3M vs 1633.4M, -14.6% YoY) while Net Income fell (184.9M vs 146.9M, +25.9% YoY). QoQ, Revenue rose from $1.123B in Q1’26 (+24.1% QoQ) and Net Income increased from $55.3M (+234.6% QoQ), indicating a sharp earnings inflection in the latest quarter. Profitability weakened over the last 4 quarters: gross margin slipped to 18.0% in Q2’26 from 21.2% in Q2’25, and net margin fell to 13.3% from 9.0% in Q2’25; however, the operating profile remains more volatile quarter-to-quarter (operating margin dropped vs the stronger Q3/Q2’25 levels). Cash flow remains positive but highly variable: operating cash flow was $189M and free cash flow $184M in Q2’26. Share repurchases were substantial (about $100M in the quarter) alongside dividends of $31M, supporting shareholder returns. Balance sheet resilience is solid: total assets were $7.55B and equity $5.06B (about stable QoQ). Total shareholder return is helped by modest price momentum (1Y: +8.3%), with a small dividend yield (~0.56%). Analyst consensus target (~$86) sits above the current price ($68), implying upside potential."

Revenue Growth

Caution

Revenue was $1.394B in Q2’26, up +24.1% QoQ but down -14.6% YoY (vs $1.633B in Q2’25). Trend is improving sequentially but still negative year-over-year.

Profitability

Neutral

Net Income rose +234.6% QoQ to $184.9M and +25.9% YoY. Margin structure shows some weakening versus earlier peaks (gross margin 18.0% in Q2’26 vs 21.2% in Q2’25), but earnings rebounded strongly in the latest quarter.

Cash Flow Quality

Positive

Q2’26 operating cash flow was $189M and free cash flow $184M (positive, covering dividends and buybacks). Cash generation has been volatile in prior quarters (e.g., negative OCF in Q3’25), but remains supportive recently.

Leverage & Balance Sheet

Positive

Total assets were $7.55B and equity $5.06B, largely stable QoQ. Leverage remains moderate (debt $1.81B; net debt ~$1.00B). Equity stability supports resilience.

Shareholder Returns

Neutral

Share repurchases were meaningful ($100M in Q2’26) and dividends paid were ~$31M. Price momentum is moderate (1Y +8.3%, not >20%), with low dividend yield (~0.56%).

Analyst Sentiment & Valuation

Neutral

Consensus price target is $86.33 vs current price $68.07, suggesting upside. However, TTM earnings power appears more variable given margin and cash flow swings across quarters.

Disclaimer:This analysis is AI-generated for informational purposes only. Accuracy is not guaranteed and this does not constitute financial advice.

Fundamentals Overview

Loading fundamentals overview...

Meritage delivered a resilient quarter despite a softer-than-normal selling season, combining strong backlog conversion (200%) with continued cycle-time control (sub-110 days) and disciplined inventory reduction. Q2 adjusted gross margin of 18.6% improved sequentially by 80 bps to 18.6% from Q1, aided by direct cost reductions (~6% YoY) and temporary mid-quarter rate relief that reduced incentive cost while maintaining same-quarter closings. However, gross margin still ran 280 bps below the prior year on lower closing revenue leverage and higher lot costs, partially offset by improved direct costs. Management is explicitly managing pace and pricing to preserve profitability, with elevated incentives remaining highly rate-sensitive. The company is reiterating a full-year framework with guidance implying ~5% lower closings/revenue vs 2025 and providing Q3 ranges (3.3k–3.6k closings; EPS $1.10–$1.30). Capital allocation remained active: $100M buybacks at a 16% discount to book and $131M total shareholder returns, alongside a revolver refinance extending maturity to 2031 and lifting capacity.

AI IconGrowth Catalysts

  • Backlog conversion rate of 200% (within targeted 175%-200%) supported 3.73k home closings and $1.4B home closing revenue
  • Cycle time maintained below 110 calendar days for the fifth consecutive quarter, further improving allowing later starts while still supporting a 60-day closing guarantee
  • Lower construction cost per foot driven by purchasing/vendor negotiations tied to newer starts and improved direct cost structure
  • Spec inventory management: ending specs at ~5.1k, 15 specs per store (about 4 months supply) near lower end of 4-6 month target

Business Development

  • Strategic trades partnerships used to drive incremental construction cost savings (referenced as collaboration with strategic trades)
  • Realtor/broker network: “strong realtor relationships” and “long standing realtor relationships” generating stable repeat business; external commissions stable YoY and sequentially

AI IconFinancial Highlights

  • Sales orders: 3.58k homes, down 9% YoY (slower than normal spring selling season)
  • Home closings: 3.73k (and $1.4B revenue); adjusted diluted EPS $1.42 excluding $3.9M real estate inventory impairments and terminated land deal walkaway charges
  • Home closing gross margin: 18.3% reported, down 280 bps YoY (21.1% in prior year); adjusted gross margin 18.6%
  • Sequential gross margin improvement: adjusted gross margin up 80 bps to 18.6% from 17.8% in Q1
  • Impairments/walkaways: $3.6M real estate inventory impairment and ~$0.3M terminated land deal walkaway charges in Q2 2026 (vs no impairment and $4.2M terminated walkaways in prior year)
  • SG&A as % of home closing revenue: 10.4% in Q2 2026 vs 10.2% in Q2 2025
  • Effective income tax rate: 24.8% in Q2 2026 vs 23.9% in Q2 2025 driven by higher state income taxes
  • EPS bridge: diluted EPS $1.37 (down 33% YoY from $2.04); adjusted diluted EPS $1.42 excluding impairments and walkaways
  • First-half 2026: orders down 7%, closings down 12%, revenue down 16% to $2.5B; adjusted home closing margin 18.2% (350 bps lower YoY)

AI IconCapital Funding

  • Shareholder returns: $131M returned in Q2 2026 via dividends and share repurchases (up 74% YoY from $76M)
  • Buybacks: repurchased >1.5M shares (~2.3% of shares outstanding at start of quarter) for $100M; average 16% discount to book
  • 2026 year-to-date buybacks: $230M spent; reduced 12/31/2025 share count by nearly 5%
  • Repurchase program availability: $284M available as of 06/30/2026
  • Stated buyback pacing: continue repurchases but “pair it back slightly” to minimum $55M per quarter for balance of 2026, adding opportunistically on dips
  • Cash/liquidity: $87M cash as of 06/30/2026
  • Debt: no outstanding borrowing under credit facility
  • Leverage/capital: net debt to cap ratio 17.1%; net debt to cap ceiling “mid-20s range”
  • Revolver refinance (June): increased facility size to $980M; extended maturity 2030 to 2031; accordion increased to up to $1.47B

AI IconStrategy & Ops

  • Inventory streamlining: reduced finished home position by over 1.1k homes YoY; replaced older inventory with higher volume of newer product with lower direct costs
  • Starts and supply: Q2 starts ~3.9k homes (down 4% YoY, up ~1.4k sequentially); ending backlog ~3.7k homes (down from ~4.75k prior year)
  • Backlog inventory mix: end backlog down materially (3.7k vs 4.75k YoY), but spec inventory reduced as path to achieve Q3 guidance
  • Inventory targets: ended quarter with ~15 specs per store (~4 months supply) near lower end of 4-6 month target
  • Portfolio shift: moving toward first-move-up homes; long-term target ~1/3 first-move-up and 2/3 entry-level (rebalancing after temporary pause)
  • Model/product approach for move-up: earlier home releases for buyers who already have homes to sell; “no offering choice/options”; 60-day closing guarantee maintained with tweaks; no design studios or major personalization; “nicer home” with upgraded features

AI IconMarket Outlook

  • Full-year 2026 guidance updated: home closings and revenues around 5% below full-year 2025 results (with revenue potentially lower if higher incentives required)
  • Q3 2026 guidance: total home closings 3.3k to 3.6k; home closing revenue $1.26B to $1.35B; home closing gross margin around 18%; effective tax rate 24.5% to 25%; diluted EPS $1.10 to $1.30

AI IconRisks & Headwinds

  • Incentive elevation remains a key swing factor: incentive costs and utilization inversely correlated to interest/mortgage rate volatility
  • Higher lot costs continue to roll through financials despite improved direct costs; land basis headwind expected to persist with margin relief starting tail end of 2027 or early 2028 (assuming oil/gas price impact is not prolonged)
  • Demand is softer than normal; orders down 9% YoY and affordability/economic uncertainty persist
  • Interest rate risk: very recent increase in interest/mortgage rates may impact demand in coming weeks if rates do not pull back

Q&A: Analyst Interest

  • Gross margin drivers: Management attributed the Q2 adjusted gross margin beat to leverage from improved volume vs Q1, ~6% YoY improvement in direct costs, and intra-quarter rate dip enabling lower incentives while still closing within the quarter. They said forward improvement hinges mainly on incentive/closing volume rather than direct-cost gains alone.
  • Move-up pivot timeline and product/go-to-market: Management said the portfolio mix shift is constrained by land sourcing and impacts “more of a 2028 and beyond type of impact.” They emphasized operating alignment with no options/choice, earlier home releases, and tweaks around closing-ready guarantee and realtor strategy to fit move-up buyers’ trade-and-sell timing.
  • Whether move-up is opportunistic and M&A acceleration: Management said the pivot is not opportunistic—intentionally targeted for years—but underwriting changed as land bifurcation tightened and 1MU land became more underwritable. They noted M&A is viewed strategically for market/channel penetration (e.g., Midwest) or move-up penetration, not scale at any cost.

Sentiment: MIXED

Note: This summary was synthesized by AI from the MTH Q2 2026 earnings transcript. Financial data is complex; please verify all metrics against official SEC filings before making investment decisions.

📋 Official Regulatory 10-K / 10-Q SEC Filings

Direct authenticated documentation links to audited SEC database reports for MTH.

SEC EDGAR Live Feed
Loading financial data and tables...
📁

SEC Filings (MTH)

© 2026 Stock Market Info — Meritage Homes Corporation (MTH) Financial Profile