NVIDIA Corporation

NVIDIA Corporation (NVDA) Market Cap

NVIDIA Corporation has a market capitalization of $4.86T.

Price: $200.75

5.71 (2.93%)

Market Cap: 4.86T

NASDAQ · time unavailable

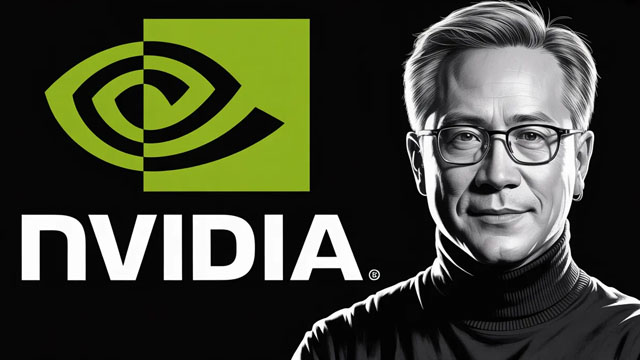
CEO: Jen-Hsun Huang

Sector: Technology

Industry: Semiconductors

IPO Date: 1999-01-22

Website: https://www.nvidia.com

NVIDIA Corporation (NVDA) - Company Information

Market Cap: 4.86T|Sector: Technology

Company Profile

NVIDIA Corporation stands as a prominent provider of advanced graphics, computational, and networking solutions, operating across the United States, Taiwan, China, and numerous international markets. Its Graphics division encompasses GeForce GPUs, central to PC gaming and personal computing experiences, along with the GeForce NOW cloud gaming service and its supporting infrastructure, as well as dedicated solutions for various gaming platforms. For professional visualization, it provides Quadro and NVIDIA RTX GPUs for enterprise workstations, further offering vGPU software designed for cloud-centric visual and virtual computing, automotive platforms for in-vehicle infotainment, and the Omniverse software suite, facilitating 3D design and virtual world creation. The Compute & Networking segment is a cornerstone for AI, high-performance computing (HPC), and accelerated data center platforms. It integrates Mellanox networking and interconnect solutions, delivers automotive AI Cockpit technologies, fosters autonomous driving development through strategic agreements, and offers comprehensive autonomous vehicle solutions. This segment also manufactures cryptocurrency mining processors, supplies Jetson platforms for robotics and other embedded applications, and offers enterprise AI software, including NVIDIA AI Enterprise. These diverse offerings find widespread application across the gaming, professional visualization, data center, and automotive sectors. NVIDIA distributes its portfolio through a broad ecosystem, engaging original equipment and device manufacturers, system integrators, add-in board makers, retail channels, software vendors, internet and cloud service providers, automotive companies (both manufacturers and tier-1 suppliers), mapping firms, nascent technology ventures, and other industry stakeholders. A notable strategic partnership exists with Kroger Co. Founded in 1993, NVIDIA Corporation maintains its corporate headquarters in Santa Clara, California.

Analyst Sentiment

92%
Strong Buy

From 61 Active Polls

1Y Forecast: $319.48

▲ +59.1% Potential Upside

Consensus Target Metrics

Low Bound

$218

Median

$300

High Bound

$500

Average

$319

Price & Moving Averages

Loading chart...

🎯 Wall Street Analyst Intelligence Report

1-Year structural target targets, chart projections, and sentiment maps.

Average 1Y Target
$319.48
▲ +59.14% Upside
Low Target
$218.00
9% Risk
Median Target
$300.00
49% Mid
High Target
$500.00
149% Max
Consensus
Buy
60 / 79 Buys

Consensus Trend Projection

Trailing closures vs. 12-month metrics map.

Analyst Vote Distribution

Aggregate institutional coverage sentiment weights.

📊 Historical Valuation Multiples

Real-time Trailing Twelve Month (TTM) momentum side-by-side with discrete quarterly metrics.

Fiscal QuarterTTMQ2 2026Q1 2026Q4 2025Q3 2025Q2 2025Q1 2025Q4 2024Q3 2024
Period EndingTrailing 12MApr 26, 2026Jan 25, 2026Oct 26, 2025Jul 27, 2025Apr 27, 2025Jan 26, 2025Oct 27, 2024Jul 28, 2024
Market Cap ($M)4,862,3665,260,5904,531,9674,658,3774,306,6912,657,4702,899,9873,447,3772,742,659
Enterprise Value ($M)4,861,9435,260,1674,532,7744,657,7134,305,6502,652,5212,901,6683,448,4952,744,111
Price to Earnings Ratio (P/E)30.6022.5626.3436.5440.9135.3032.8944.4741.03
Price/Earnings-to-Growth Ratio (PEG)1.141.351.666.722.932.722.652.67
Price to Sales Ratio (P/S)19.1864.4666.5281.7292.1460.3173.7398.2791.30
Price to Book Ratio (P/B)24.9426.9128.8139.1843.0131.7036.5652.3147.16
Price to Free Cash Flow Ratio (P/FCF)40.83108.27129.84210.64319.72101.48186.47205.03202.99
Enterprise Value to Sales (EV/Sales)64.4566.5381.7192.1160.2073.7898.3091.35
Enterprise Value to EBITDA (EV/EBITDA)25.2074.0888.39120.21134.82117.45112.38150.89139.24
Debt to Equity Ratio-0.000.070.070.090.110.120.130.160.17

📘 Full Research Report

ℹ️

AI-Generated Research: This report is for informational purposes only.

📘 NVIDIA CORP (NVDA) — Investment Overview

🧩 Business Model Overview

NVIDIA participates in the accelerated computing stack for AI and high-performance computing (HPC). The value chain spans (1) GPUs and related compute hardware, (2) high-speed interconnects and networking to scale clusters, (3) full-system platforms sold as validated reference designs, and (4) a software ecosystem that enables development, optimization, and deployment.

The practical “how it works” dynamic is that customers standardize on NVIDIA’s programming model and tooling for model development and production inference. That software foundation then extends into NVIDIA’s libraries, performance optimization layers, and platform-level products, creating a workflow dependency that persists across hardware refresh cycles.

💰 Revenue Streams & Monetisation Model

Revenue is primarily driven by product sales, including data center GPUs, networking/interconnect products, and systems sold to enterprises and hyperscalers. Monetisation also includes software-related revenue through licensing and associated platform offerings (e.g., enterprise-grade AI software stacks) and services tied to deployment of validated platforms.

Margin drivers are anchored in (1) platform differentiation—higher-end hardware commanding a performance/efficiency premium, (2) attach rates across the stack—GPUs plus networking plus systems tends to increase value per data center deployment, and (3) software ecosystem economics—software and developer tooling typically carry structurally higher margins than base hardware, supporting blended profitability as the platform matures.

🧠 Competitive Advantages & Market Positioning

NVIDIA’s moat is primarily software-driven switching costs combined with system-level performance integration. Competitors can offer competing compute devices, but replicating NVIDIA’s developer productivity and end-to-end performance tuning across hardware generations is difficult and time-consuming.

  • Switching Costs (Ecosystem Lock-in): CUDA and the broader software toolchain create “path dependence” in AI training and inference pipelines. Once models, frameworks, and production tooling are built around this ecosystem, migration imposes engineering costs and performance risk.
  • Cost Advantage via Full-Stack Optimization: NVIDIA designs the compute, interconnect, and system validation together, enabling predictable cluster-level scaling and reducing integration friction for large deployments.
  • Network Effects (Developer and Tooling Flywheel): A larger developer base and broader library support increase the share of workloads standardized on NVIDIA, which in turn incentivizes more tooling optimization and third-party adoption.

Competitive benchmarking: Key competitors include AMD (accelerators in data center), Intel (accelerators and broader compute platforms), and hyperscalers’ custom silicon such as Google’s TPU. These rivals may compete effectively on raw hardware specifications or on cost positioning in specific environments, but NVIDIA’s industry focus concentrates on an integrated platform plus a widely adopted software development and deployment ecosystem. Hyperscaler custom silicon can reduce dependency in captive deployments; however, broad portability of models and tooling across heterogeneous environments generally supports NVIDIA’s ecosystem stickiness for customers seeking deployment flexibility.

🚀 Multi-Year Growth Drivers

Over a multi-year horizon, growth is supported by structural demand for accelerated compute driven by:

  • Continued expansion of AI compute requirements: Training and inference workloads expand as models become more capable and are embedded into more use cases, increasing total accelerated compute intensity per deployment.
  • Data center modernization and cluster scaling: Larger model training and higher-throughput inference require scalable GPU clusters, where networking and systems integration matter.
  • Broader adoption beyond frontier training: Enterprise and vertical workloads expand the TAM beyond pure hyperscaler experimentation, supporting a longer runway for infrastructure build-outs and inference deployments.
  • Software platform deepening: As more tooling and libraries become optimized for NVIDIA’s ecosystem, the platform tends to compound demand through improved developer productivity and deployment performance.

NVIDIA’s emphasis on end-to-end acceleration platforms positions it to capture both incremental hardware purchases and recurring value through software ecosystem adoption across successive hardware generations.

⚠ Risk Factors to Monitor

  • Regulatory and export controls: Restrictions on shipping high-performance compute to certain jurisdictions can constrain addressable demand and disrupt supply planning.
  • Technological competition and performance parity: Competitors may close gaps through architectural advances, improved compilers/toolchains, or better system integration, particularly where customers optimize for cost or captive environments.
  • Customer concentration and capital expenditure cyclicality: A meaningful portion of AI infrastructure spend is concentrated in large buyers whose investment timing can affect ordering patterns.
  • Supply chain and manufacturing scale: Advanced semiconductor production and component availability influence delivery capability and can impact revenue realization.
  • Security and compliance requirements: Enterprise deployments may require additional certifications and controls, raising implementation overhead for new platform entrants and influencing procurement decisions.

📊 Valuation & Market View

Equity valuation for NVIDIA typically reflects a blend of high-growth technology expectations and the market’s view of platform durability. Hardware-centric businesses often trade on revenue and earnings power, while software ecosystem characteristics can support higher multiple frameworks than commodity semiconductors.

Key valuation drivers include:

  • Sustainable platform growth: Evidence that accelerated compute demand extends beyond short-cycle deployments into longer-lived infrastructure build-outs.
  • Blended margin trajectory: Mix shifts toward systems and software-related revenue can improve gross margin durability and operating leverage.
  • Ecosystem defensibility: Indicators of continued adoption of CUDA-based workflows and the ability to retain workloads across hardware refresh cycles.
  • Competitive positioning: Market perception of whether alternatives remain limited by software/tooling gaps versus achieving full-stack equivalence.

A premium valuation is most justifiable when platform economics—developer lock-in and system-level integration—remain intact despite competitive offerings and shifts in customer procurement strategies.

🔍 Investment Takeaway

NVIDIA’s long-term investment appeal rests on a structural moat anchored in software-driven switching costs and an integrated acceleration platform. While hardware competitors and custom silicon can contest share in specific environments, replicating NVIDIA’s full-stack ecosystem and the performance predictability of its cluster-level solution is challenging. The base case emphasizes sustained demand for accelerated compute paired with platform deepening—where software adoption and system integration reinforce customer stickiness across hardware generations.


⚠ AI-generated — informational only. Validate using filings before investing.

📰 Market News & Coverage

15 Stories Available

Real-time institutional reporting and market updates for NVDA.

fool.com2026-08-01

Nvidia vs. Alphabet: What Do Revenue Trends Tell Investors About These Artificial Intelligence Companies?

Nvidia currently shows stronger revenue momentum than Alphabet, displaying a steeper and more consistent upward trajectory. While Alphabet maintains a higher overall baseline, both companies have generally reported positive quarter-over-quarter revenue growth over the past eight quarters.

fool.com2026-08-01

3 Stocks Smart Quantum Computing Investors Are Buying

Alphabet has incentives to develop a strong quantum computing unit for its cloud computing services. IonQ is taking a different path than most in the industry.

247wallst.com2026-08-01

Why the Best May Be Yet to Come for NVIDIA, Micron, and SanDisk

The AI infrastructure buildout keeps rewriting the earnings power of the companies supplying its picks and shovels.

fool.com2026-08-01

Microsoft Just Announced Huge News for Nvidia Shareholders

The market is still skeptical about future data center spending. Nvidia's stock is priced at a cheap level.

247wallst.com2026-08-01

Should You Buy Billionaire Investor Chase Coleman's Top 5 Growth Stocks in August?

Hyperscaler CapEx is going vertical.

fool.com2026-08-01

The Magnificent Seven Dominated the Last Decade. Could MANGOS Lead the Next?

A new AI power bloc is emerging across public and private markets. See which companies control the models, compute, and distribution that could define the next decade.

247wallst.com2026-08-01

5 Tech Stocks Most at Risk From NVIDIA’s Stranglehold on the Industry

NVIDIA now controls the chokepoint for every major AI buildout, and some of the biggest names in tech are more exposed than their stock prices suggest. Five companies face a reckoning depending on how tightly NVIDIA tightens its grip.

fool.com2026-08-01

Nvidia Isn't the Most Valuable Company in the World Anymore. Is More Bad News Coming?

Chip stocks are down on market worries about AI spending. Nvidia should enjoy the fruits of AI spending, since its products are the gold standard for AI development.

fool.com2026-08-01

Nvidia's Shareholder Meeting Is Aug. 26. Here's What Investors Should Be Looking Out For.

The AI boom is still in its early innings. Nvidia's next earnings release should provide updates on key catalysts.

fool.com2026-07-31

Nobody's Talking About It, But This Business Could Make Nvidia a $10 Trillion Company

Nvidia shares have surged on the generative AI revolution. A similar transformation seems to be brewing in robotics and automobiles.

marketwatch.com2026-07-31

Did China build a top-tier AI model by itself? A new report suggests Nvidia chips played a role.

Alibaba has an agreement for Moonshot to use its Nvidia H200s, according to Bloomberg — but the Chinese tech giant pushed back against the report.

zacks.com2026-07-31

NVIDIA vs. Sandisk: Which AI Stock Could Deliver Bigger Returns?

Sandisk is riding AI memory demand with strong revenue growth and bullish targets. See why it may offer more upside than NVIDIA.

fool.com2026-07-31

Prediction: Nvidia Will Be a $10 Trillion Company by 2030. Here's the Math.

Nvidia needs high-teen annualized returns to reach a $10 trillion market cap by 2030. AI infrastructure spending is expected to increase over the next five years, giving Nvidia room to grow.

etftrends.com2026-07-31

Semiconductor ETFs Draw Cash This Week as Chip Stocks Rally

Chip stocks rallied this week on a wave of strong tech earnings, and investors rewarded semiconductor ETFs with a rush of new cash. Three funds tracking the chip sector ranked among those pulling in the most new money, according to FactSet flow data.

seekingalpha.com2026-07-31

Gaming and Leisure Properties, Inc. (GLPI) Q2 2026 Earnings Call Transcript

Gaming and Leisure Properties, Inc. (GLPI) Q2 2026 Earnings Call Transcript

📊 AI Financial Analysis

Powered by StockMarketInfo
Earnings Data: Q Ending 2026-04-26

"NVDA reported Q1’27 results (ended 2026-04-26) with Revenue of $81.6B and Net Income of $58.3B, delivering EPS of $2.40. On a YoY basis, Revenue rose from $44.1B (Q1’26) to $81.6B (+85.2%) and Net Income increased from $18.8B to $58.3B (+210.7%). QoQ, Revenue grew from $68.1B (Q4’26) to $81.6B (+19.8%), while Net Income rose from $42.96B to $58.32B (+35.7%). Profitability improved: gross margin was ~74.9% (vs ~75.0% in Q4’26 and ~60.5% in Q1’26), while net profit margin expanded to ~71.5% from ~63.1% QoQ and ~42.6% YoY. Cash flow remained exceptionally strong. Operating cash flow was $50.3B and free cash flow was $48.6B; both scaled up with higher earnings. Shareholder returns were also active: the company repurchased $21.4B of stock and paid $0.24B in dividends in the quarter. Balance sheet resilience remained high with net cash (net debt of -$0.42B) and equity at $195.5B, up from $157.3B QoQ. Total shareholder return backdrop is very positive with the stock up 93.0% over the last 1 year (strong momentum). With a consensus price target of ~$279.9 vs current ~$201.7, valuation appears to still embed substantial growth expectations."

Revenue Growth

Excellent

Revenue grew +19.8% QoQ ($68.1B to $81.6B) and +85.2% YoY ($44.1B to $81.6B), with a clear upward trajectory across the last four quarters.

Profitability

Excellent

Net margin expanded to ~71.5% in Q1’27 vs ~63.1% QoQ and ~42.6% YoY; EPS rose to $2.40 from $1.77 QoQ and $0.77 YoY.

Cash Flow Quality

Strong

Operating cash flow was $50.3B and free cash flow $48.6B, supporting earnings; dividends are small ($243M), while buybacks were substantial (-$21.4B).

Leverage & Balance Sheet

Strong

Balance sheet strengthened: net debt remained negative (net cash of ~$0.42B). Total assets rose to $259.5B and equity increased to $195.5B QoQ.

Shareholder Returns

Excellent

High total return backdrop: 1y stock momentum is +93.0% (well above 20% threshold). In-quarter shareholder distributions included large buybacks and a small dividend.

Analyst Sentiment & Valuation

Positive

Consensus target (~$279.9) implies upside vs $201.7, but valuation remains expensive; implied multiples (from provided ratios) are high, reflecting elevated expectations.

Disclaimer:This analysis is AI-generated for informational purposes only. Accuracy is not guaranteed and this does not constitute financial advice.

Fundamentals Overview

Loading fundamentals overview...

NVDA delivered a record Q1 with $82B revenue (+85% YoY, +20% sequential) and $49B free cash flow, attributing strength to a rapid Blackwell ramp (including GB300/NVL72) and expanding AI Ethernet/network momentum (Spectrum-X larger than all Ethernet peers combined; InfiniBand +4x YoY on XDR). Margins were resilient: GAAP gross margin 74.9% and non-GAAP 75% were largely flat sequentially despite higher compensation and compute/infrastructure costs. Management guided Q2 revenue to $91B +/-2% and maintained gross margin expectations (74.9%/75% +/-50 bps) while lowering full-year tax guidance to 16-18% (from 17-19%) on geographic mix. Capital return accelerated: record $20B returned in the quarter plus $80B additional authorization on top of $39B remaining, alongside a dividend increase (with an apparent Q&A correction). The main forward constraint is China: despite H200 licenses, management reports no revenue and uncertain imports, so China data center compute stays excluded.

AI IconGrowth Catalysts

  • Blackwell ramp: ramping Blackwell systems across hyperscalers, model makers, AI cloud providers, and sovereign customers
  • Strong product demand: particularly GB300 and NVL72 with frontier model builders and hyperscalers each deploying hundreds to thousands of Blackwell GPUs
  • Networking momentum: Spectrum-X scaling as end-to-end AI Ethernet platform; InfiniBand up >4x YoY on next-gen XDR technology
  • Compute-to-inference economics traction: customers citing 2.7x throughput increase for Blackwell Ultra and 60% cost-per-token reduction on GV300 vs 6 months ago
  • Vera/VeraRubin pipeline: announced Vera arrival for agentic CPU growth; VeraRubin production shipments expected in H2 (starting Q3) with up to 35x higher inference throughput vs Blackwell

Business Development

  • OpenAI: GPT 5.5 codesigned and served on Blackwell; management cited OpenAI codec growth since launch
  • Microsoft: Farweave (live; hundreds of thousands of Blackwell GPUs); plus collaboration mentioned for AI data center scaling
  • AWS: starting this year to add >1M Blackwell and Rubin GPUs and collaborating on Spectrum networking
  • Google: Blackwell offered in cloud including confidential computing capability; positioned for secure high-performance AI deployments
  • Anthropic: deepened collaboration; strategic partner to expand compute capacity; expanding capacity across AWS, Azure, CoreWeave, and StacyX (and more listed)
  • Uber: partnership to power robotaxi fleet across nearly 30 cities and 4 continents by 2028
  • Uber/robotics ecosystem: multiple industrial, surgical, and humanoid companies building/deploying using NVIDIA technology

AI IconFinancial Highlights

  • Total revenue: $82B (+85% YoY, +20% sequential); $13.5B sequential increase was a record
  • Data center revenue: $75B (+92% YoY, +21% sequential) driven by Blackwell and strong GB300/NVL72 demand
  • Data center computing: $60B (+77% YoY); data center networking: $15B nearly tripled YoY
  • InfiniBand: grew >4x YoY driven by next-gen XDR deployments
  • Margins: GAAP gross margin 74.9% and non-GAAP gross margin 75% (largely flat sequentially)
  • Operating expenses: GAAP and non-GAAP OpEx up 12% sequentially (higher compensation and increased compute/infrastructure costs)
  • Tax rate: non-GAAP effective tax rate 16% (just below prior outlook via favorable geographic mix); full-year GAAP and non-GAAP tax guidance 16-18% excluding discrete items (revised lower from 17-19% due to geographic mix)
  • Free cash flow: record $49B (vs $35B in Q4)
  • Working capital: days sales outstanding 45 days; expected to return to mid-fifties in Q2

AI IconCapital Funding

  • Shareholder returns: returned record $20B in the quarter (buybacks implied) and announced $80B new share repurchase authorization in addition to $39B remaining on the current plan
  • Dividend: intention to increase quarterly dividend (management initially cited $0.01 to $0.20 per share; then Q&A correction referenced $0.01 to $0.25 per share)
  • Supply funding/capital intensity: increased total supply including inventory purchase commitments on prepaids to $145B in Q1

AI IconStrategy & Ops

  • Reporting framework transition: moved to 2 market platforms (data center, edge computing) and within data center to submarkets (Hyperscale, ACIE)
  • AI infrastructure monetization framing: customers build AI factories; emphasis on token-per-watt, tokens-per-dollar, uptime/utilization/time-to-production and software durability rather than GPU purchase price
  • VeraCPU positioning: designed for agentic and reinforcement learning CPU opportunities; Vera expected to start production shipments of VeraRubin in Q3 with integrated 7 chips across 5 accelerated racks

AI IconMarket Outlook

  • Q2 2027 guidance: total revenue $91B +/- 2%; sequential growth expected primarily from data center
  • Q2 gross margins: GAAP 74.9% and non-GAAP 75% +/- 50 bps
  • Full-year gross margins: still expecting mid-70s
  • OpEx: full-year OpEx expected to grow in upper-40s YoY (driven by higher R&D and AI tools productivity usage)
  • Blackwell/Rubin visibility: management stated full confidence in $1T in Blackwell and Rubin revenue from 2025 through calendar 2027
  • Geography constraint: outlook excludes China data center compute revenue; licenses approved for H200 to China but management stated no revenue yet and uncertainty on whether imports will be allowed

AI IconRisks & Headwinds

  • China exposure constrained: licenses for H200 to be shipped to China approved but management has yet to generate revenue; imports uncertain, leading to exclusion of China data center compute revenue from outlook
  • Supply challenges: management stated they are not immune to supply challenges but confidence remains supported by partnerships with critical suppliers and increased supply including prepaids
  • Product-mix and pricing variability: edge computing growth tempered by consumer demand decline due to higher memory and system prices
  • Agentic CPU adoption timeline uncertainty: VeraCPU growth depends on agent/harness/tooling adoption; today constrained by early-stage proliferation of agentic workloads

Q&A: Analyst Interest

  • Segmentation framework: Management explained the new Hyperscale vs ACIE grouping as a simplified factorization of AI diversity (languages, applications, where it runs, and governance). They emphasized different go-to-market motions and stacks, and said segmentation improves understanding of a business scaled to very large complexity.
  • Growth vs hyperscaler capex: Management affirmed NVDA should grow faster than hyperscaler CapEx because hyperscalers are only one data-center cluster. They argued the broader AI-native/sovereign/industrial set is fragmented (hundreds/thousands of buyers) and continues scaling rapidly, expanding NVDA share.
  • Vera/Rubin CPU vs GPU economics: Management clarified the $20B figure is for standalone Vera CPUs. They described VeraRubin’s multiple configurations (connected to Vera, standalone CPU, and paired with CX9/security/compute isolation). They argued agent workloads require CPU-based harness/tooling while GPU handles core accelerated inference.

Sentiment: POSITIVE

Note: This summary was synthesized by AI from the NVDA Q1 2027 earnings transcript. Financial data is complex; please verify all metrics against official SEC filings before making investment decisions.

📋 Official Regulatory 10-K / 10-Q SEC Filings

Direct authenticated documentation links to audited SEC database reports for NVDA.

SEC EDGAR Live Feed
Loading financial data and tables...
📁

SEC Filings (NVDA)

© 2026 Stock Market Info — NVIDIA Corporation (NVDA) Financial Profile