Ormat Technologies, Inc.

Ormat Technologies, Inc. (ORA) Market Cap

Ormat Technologies, Inc. has a market capitalization of $6B.

Price: $97.58

0.87 (0.90%)

Market Cap: 6.00B

NYSE · time unavailable

CEO: Doron Blachar

Sector: Utilities

Industry: Renewable Utilities

IPO Date: 2004-11-11

Website: https://www.ormat.com

Ormat Technologies, Inc. (ORA) - Company Information

Market Cap: 6.00B|Sector: Utilities

Company Profile

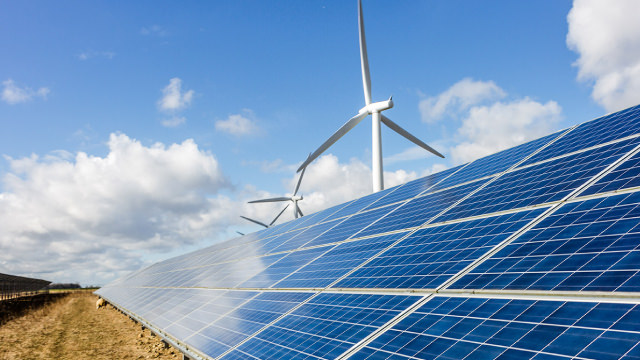
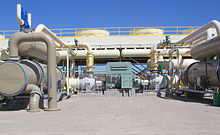
Ormat Technologies, Inc. (ORA) is a global enterprise dedicated to geothermal and recovered energy power solutions, with significant operations in the United States, Indonesia, Kenya, Turkey, Chile, Guadeloupe, Guatemala, Ethiopia, New Zealand, Honduras, and various other international locations. The company's operations are divided into three distinct business units: Electricity Generation, Product Manufacturing, and Energy Storage Solutions. The Electricity Generation division handles the full spectrum of power plant development, from designing and constructing to owning and operating facilities that harness geothermal, solar photovoltaic, and recovered energy, subsequently selling the generated power. Through its Product Manufacturing segment, Ormat designs, produces, and distributes specialized equipment for geothermal and recovered energy electricity generation, including remote power units like fossil fuel-powered turbo-generators and heavy-duty direct-current generators. This segment also provides complete engineering, procurement, construction (EPC), and ongoing operation and maintenance (O&M) services for geothermal and recovered energy power plants. Its diverse clientele includes contractors, developers, owners, and operators of geothermal power facilities, as well as industrial entities such as operators of interstate natural gas pipelines, gas processing plants, cement factories, and other energy-intensive industrial processes. The Energy Storage Solutions segment delivers a wide array of services related to energy storage, encompassing the engineering, procurement, construction (EPC), and operational maintenance (O&M) of energy storage units. Ormat Technologies, Inc. was founded in 1965 and is headquartered in Reno, Nevada.

Analyst Sentiment

81%
Strong Buy

From 13 Active Polls

1Y Forecast: $138.33

▲ +41.8% Potential Upside

Consensus Target Metrics

Low Bound

$127

Median

$139

High Bound

$152

Average

$138

Price & Moving Averages

Loading chart...

🎯 Wall Street Analyst Intelligence Report

1-Year structural target targets, chart projections, and sentiment maps.

Average 1Y Target
$138.33
▲ +41.76% Upside
Low Target
$127.00
30% Risk
Median Target
$138.50
42% Mid
High Target
$152.00
56% Max
Consensus
Hold
8 / 17 Buys

Consensus Trend Projection

Trailing closures vs. 12-month metrics map.

Analyst Vote Distribution

Aggregate institutional coverage sentiment weights.

📊 Historical Valuation Multiples

Real-time Trailing Twelve Month (TTM) momentum side-by-side with discrete quarterly metrics.

Fiscal QuarterTTMQ1 2026Q4 2025Q3 2025Q2 2025Q1 2025Q4 2024Q3 2024Q2 2024
Period EndingTrailing 12MMar 31, 2026Dec 31, 2025Sep 30, 2025Jun 30, 2025Mar 31, 2025Dec 31, 2024Sep 30, 2024Jun 30, 2024
Market Cap ($M)5,9976,8236,7195,8395,0834,2864,0964,6534,183
Enterprise Value ($M)8,6459,4719,2958,5147,7276,7656,4536,9876,494
Price to Earnings Ratio (P/E)46.4738.8653.1160.1645.5226.4125.2751.9946.76
Price/Earnings-to-Growth Ratio (PEG)0.845.048.9624.582.82
Price to Sales Ratio (P/S)5.1516.8924.3423.3821.7218.6517.7521.9719.64
Price to Book Ratio (P/B)2.312.652.642.332.041.741.691.951.76
Price to Free Cash Flow Ratio (P/FCF)-27.85-193.78-167.80-57.18-134.03-40.98132.62-1401.61-36.02
Enterprise Value to Sales (EV/Sales)23.4533.6734.0933.0229.4427.9732.9930.50
Enterprise Value to EBITDA (EV/EBITDA)15.5862.0168.4761.7460.0547.6947.3555.3655.47
Debt to Equity Ratio4.771.331.121.101.101.051.011.011.00

📘 Full Research Report

ℹ️

AI-Generated Research: This report is for informational purposes only.

📘 ORMAT TECH INC (ORA) — Investment Overview

🧩 Business Model Overview

Ormat Tech Inc is a geothermal power producer with vertically integrated capabilities spanning resource development, power generation, and technology/equipment services. The value chain starts with identifying and developing geothermal fields (resource confirmation, permitting, and drilling). Steam (or heat) derived from the reservoir is then converted into electricity through power plants that Ormat builds and operates. Revenues are typically secured through long-duration arrangements (e.g., power purchase agreements) and/or steam sales, which convert subsurface resource quality into contracted cash flows. A technology segment supports additional monetization through the sale and deployment of geothermal power generation equipment, increasing the commercial reuse of Ormat’s engineering know-how.

💰 Revenue Streams & Monetisation Model

  • Electricity generation (recurring, contracted): Cash flows from operating geothermal plants sold to utilities or counterparties under long-term PPAs. This stream is the core driver of earnings stability, with margin sensitivity primarily linked to plant availability, resource temperature/production profiles, and the cost of sustaining operations and reinjection.
  • Steam sales (recurring, resource-linked): In certain structures, Ormat monetizes steam or heat to a customer that generates power (or vice versa). This typically shifts some generation risk while preserving exposure to reservoir performance.
  • Technology and equipment (project-based): Sales and deployments of geothermal power generation technology can contribute incremental margin, particularly when the installed base and engineering capabilities enable scale efficiencies in components and execution.

Overall margins are driven by (1) contracted pricing terms and escalation clauses, (2) capacity factor/availability, and (3) sustained capital discipline around drilling, well workovers, and power plant maintenance.

🧠 Competitive Advantages & Market Positioning

Ormat’s moat is primarily rooted in high switching costs in the form of site-specific sunk capital (subsurface assets and permitting), plus an execution- and learning-intensive development process that compounds over successive projects. Unlike solar/wind, geothermal projects depend on confirmed reservoir productivity and durable steam supply—making replication difficult without proven field knowledge and disciplined drilling/operations.

  • Hard-to-replicate resource base (barriers to entry): Successful geothermal development requires specialist geology, long lead times, drilling expertise, and operational know-how to manage reinjection and reservoir performance. These factors limit the pace at which competitors can scale.
  • Contracted offtake stabilizes demand risk (utility-grade assets): Long-duration agreements reduce merchant exposure and support a more predictable cash flow profile compared with less contracted renewable generation.
  • Operational learning and wellfield sustainability: Continuous improvement in well maintenance/workovers and plant availability creates an operational cost advantage over time.

Competitive benchmarking (primary peers):

  • Enel Green Power: A large-scale renewable developer with global footprints. Enel competes for development opportunities and operational excellence, but Ormat’s advantage is the depth of geothermal-specific development and operating expertise across both generation and technology.
  • Calpine Corporation: Known for power generation assets with geothermal exposure in certain regions. Calpine competes through project development and acquisition activity; Ormat’s positioning is more geothermal-focused, with a repeatable development-and-operations approach and technology enablement.
  • Other independent geothermal IPPs and national utilities (varies by country/region): These participants can win local contracts where they have stronger relationships or land/resource access. Ormat’s differentiated advantage tends to show up where geothermal execution, wellfield management, and technology deployment matter most.

In sum, Ormat’s positioning is best understood as geothermal “field + execution” expertise rather than a generalized renewable generator. This creates durable barriers that are difficult for competitors to overcome quickly.

🚀 Multi-Year Growth Drivers

  • Baseload renewable demand and policy support: Geothermal is “firm” renewable generation, supporting grid reliability needs and decarbonization targets. Long-lived assets benefit from the shift toward cleaner baseload and capacity value.
  • Project pipeline expansion through development and reinjection optimization: Growth comes from adding new plants, expanding existing fields, and improving reservoir sustainability through well work and reinjection strategies that extend productive life.
  • Geothermal market TAM expansion: The opportunity set spans multiple geographies where geothermal resources are underdeveloped. As permitting frameworks mature and financeability improves, total addressable capacity widens.
  • Technology deployment as an additional scaling lever: Engineering expertise can be leveraged across projects, supporting incremental growth beyond power plant ownership.

⚠ Risk Factors to Monitor

  • Resource and drilling risk: Subsurface uncertainty can lead to lower-than-expected steam production, higher drilling costs, or extended timelines to stabilize output.
  • Capital intensity and execution risk: Geothermal projects require significant upfront capital (drilling, field development, plant construction). Cost overruns or slower commissioning can pressure returns.
  • Regulatory and permitting exposure: Changes in environmental, water/reinjection, land-use, or power market rules can affect project timing and economics.
  • Counterparty and contract risk: While PPAs reduce merchant exposure, credit quality of counterparties and contract structure (indexation, curtailment terms) remain important.
  • Operational availability risk: Plant outages and well performance declines can impact generation volumes and cash margins.

📊 Valuation & Market View

The market typically values geothermal IPPs through a cash-flow and asset-based DCF lens (EV/EBITDA and long-duration earnings power are commonly used), with adjustments for contracted versus merchant-like exposure and for the expected trajectory of capital needs. Key valuation drivers include:

  • Contract structure quality: Length, pricing, and escalation terms; curtailment risk; and counterparty creditworthiness.
  • Operating performance: Capacity factor/availability, wellfield productivity, and cost per unit of electricity.
  • Growth efficiency: The relationship between incremental capex and realized megawatt additions or expanded generation.
  • Technology segment contribution: The durability of equipment-related economics and execution scalability.

Because geothermal assets are long-lived and require ongoing maintenance capital, the market often rewards consistent operational delivery and disciplined investment underwriting.

🔍 Investment Takeaway

Ormat’s long-term investment case rests on a geothermal-specific moat: resource and site-specific sunk capital, specialized development and wellfield sustainability expertise, and contracted offtake structures that support cash flow visibility. Multi-year growth is driven by adding and expanding geothermal capacity while leveraging learning across field development, operations, and technology deployment. The principal threat is execution and reservoir uncertainty—risks that can be partially mitigated through underwriting discipline and operational track record. For investors seeking exposure to firm, clean power with durable barriers to entry, ORA offers an asset-and-execution model with meaningful structural defensibility.


⚠ AI-generated — informational only. Validate using filings before investing.

📰 Market News & Coverage

15 Stories Available

Real-time institutional reporting and market updates for ORA.

zacks.com2026-07-29

AMRC or ORA: Which Is the Better Value Stock Right Now?

Investors looking for stocks in the Alternative Energy - Other sector might want to consider either Ameresco (AMRC) or Ormat Technologies (ORA). But which of these two stocks presents investors with the better value opportunity right now?

marketbeat.com2026-07-14

3 Energy Stocks Racing to Fix AI's Power Problem

The AI buildout has a power problem, and most investors are still looking in the wrong place for the fix. Nuclear gets the headlines.

globenewswire.com2026-07-01

Ormat Technologies, Inc. to Host Conference Call Announcing Second Quarter 2026 Financial Results

RENO, Nev., July 01, 2026 (GLOBE NEWSWIRE) -- Ormat Technologies Inc. (NYSE: ORA) (the “Company” or “Ormat”), a leading geothermal and renewable energy company, today announced that it plans to publish its second quarter financial results in a press release that will be issued on Wednesday, August 5, 2026, after the market closes. In conjunction with this report, the Company has scheduled a conference call to discuss the results at 10:00 a.m.

seekingalpha.com2026-06-23

Ormat Technologies: A Better Business, But Not A Better Buy

Ormat Technologies, Inc. has significantly outperformed expectations since my previous Hold rating. Investor confidence in ORA's diversification, particularly its rapid energy storage growth, has increased. ORA's expanding project pipeline is a key driver behind the stock's recent outperformance.

gurufocus.com2026-06-17

Ormat Technologies Inc (ORA) Stock Down 5.8% but Still Overvalued -- GF Score: 84/100

On June 17, 2026, Ormat Technologies Inc (ORA) shares fell 5.8%, bringing the current price to $126.12. This decline is set against a 52-week range of $80.82 to

benzinga.com2026-06-17

Sophia Genetics, Ormat Technologies And Other Big Stocks Moving Lower In Wednesday's Pre-Market Session

U.S. stock futures were mostly higher this morning, with the Nasdaq futures gaining over 100 points on Wednesday.

fool.com2026-06-14

Great News: A Critical Power Shortage Could Create a Rare Opportunity for This Energy Stock

Ormat Technologies (ORA +1.28%) could become a surprising beneficiary of artificial intelligence's growing electricity needs. Its geothermal assets offer reliable 24/7 power, while storage and product revenue give the company multiple growth levers.

zacks.com2026-06-12

NGG vs. ORA: Which Stock Is the Better Value Option?

Investors interested in stocks from the Alternative Energy - Other sector have probably already heard of National Grid (NGG) and Ormat Technologies (ORA). But which of these two stocks offers value investors a better bang for their buck right now?

zacks.com2026-06-12

Ormat Technologies Gains From Geothermal and Energy Storage Expansion

ORA expands geothermal and energy storage capacity through new projects and acquisitions, while tariff and supply-chain risks remain in focus.

247wallst.com2026-06-08

The Overlooked Fidelity Fund That's Already Up 84% Over Twelve Months on a Forgotten Thesis

A $10,000 position in Fidelity Clean Energy ETF (NYSEARCA:FRNW) on the last trading day of 2025 was worth about $13,330 by the close on June 4, 2026, a 33% run in a little over five months.

globenewswire.com2026-06-08

Ormat Technologies Accelerates Enhanced Geothermal System (EGS) Deployments and Introduces Ormega100 Unit to Commercialize and Scale the Largest Binary Unit in the Industry

RENO, Nev., June 08, 2026 (GLOBE NEWSWIRE) -- Ormat Technologies, Inc. (NYSE: ORA) (the “Company” or “Ormat”), a leading geothermal and renewable energy company and the only vertically integrated designer, builder, owner, and operator of geothermal facilities in the world, today announced the Ormega100, a revolutionary new surface power generation unit engineered to deliver higher output than any other binary solution currently on the market. The Ormega100 marks an accelerated opportunity to commercialize and scale its Enhanced Geothermal System (EGS) developments, connecting subsurface development with surface power generation at an accelerated pace.

reuters.com2026-06-08

Ormat finalizes industry's largest geothermal power plant design

U.S. renewable power company Ormat Technologies has developed a geothermal power plant design that would be the largest ​of its kind in the industry, capable of producing 100 megawatts ‌of electricity from the earth's heat, the company told Reuters on Monday.

zacks.com2026-06-05

Why Is Ormat Technologies (ORA) Up 16.3% Since Last Earnings Report?

Ormat Technologies (ORA) reported earnings 30 days ago. What's next for the stock?

seekingalpha.com2026-06-03

High Oil Prices Are Doing What Policy Never Could: It Is Making For Winning Comeback Stories

High Oil Prices Are Doing What Policy Never Could: It Is Making For Winning Comeback Stories

zacks.com2026-05-27

NGG or ORA: Which Is the Better Value Stock Right Now?

Investors interested in Alternative Energy - Other stocks are likely familiar with National Grid (NGG) and Ormat Technologies (ORA). But which of these two stocks is more attractive to value investors?

📊 AI Financial Analysis

Powered by StockMarketInfo
Earnings Data: Q Ending 2026-03-31

"ORA reported Q1’26 revenue of $403.9M, up +46.3% YoY (vs. $229.8M in Q1’25) and up +46.4% QoQ (vs. $276.0M in Q4’25). Net income was $44.1M, up +9.2% YoY (from $40.4M) and +40.6% QoQ (from $31.4M). Margins improved on a top-line basis: gross margin increased to 29.8% from 28.6% QoQ and from 31.7% YoY, while operating income remained slightly negative (-$4.1M) in Q1’26 after being positive in Q4’25 (+$54.9M). Net margin improved to 10.9% from 11.4% QoQ and from 17.6% YoY, indicating profitability has become more driven by non-operating items (Q1’26 income before tax was $28.6M). Cash generation was positive at $78.6M operating cash flow, but free cash flow remained slightly negative (-$35.2M) due to heavy investing (capex -$113.8M). The balance sheet shows very high leverage: total assets rose to $6.77B from $6.25B in Q4’25, while net debt increased to $2.65B. Shareholder returns appear strong with stock price up +60.7% over the last year; dividends are small (yield ~0.11%) and there were no buybacks reported this quarter. Analyst target consensus ($132) is below the current price (~$113) for upside skew, but with ongoing operating margin volatility."

Revenue Growth

Strong

Q1’26 revenue $403.9M: +46.3% YoY and +46.4% QoQ, indicating strong acceleration vs prior quarter.

Profitability

Neutral

Net income rose +9.2% YoY and +40.6% QoQ, but operating income turned slightly negative (-$4.1M) after +$54.9M in Q4’25; net margin 10.9% is down vs Q1’25 (17.6%).

Cash Flow Quality

Neutral

Operating cash flow was solid at +$78.6M, but free cash flow stayed negative (-$35.2M) due to capex (-$113.8M). Dividend paid was -$7.5M; no buybacks reported.

Leverage & Balance Sheet

Caution

Assets increased to $6.77B QoQ, but leverage remains high: net debt $2.65B and debt/equity ~0.51; interest coverage is weak (0.09x).

Shareholder Returns

Strong

Price appreciation is strong (+60.7% 1Y). Dividend yield is low (~0.11%); limited evidence of repurchases this quarter.

Analyst Sentiment & Valuation

Neutral

Consensus price target ($132) is above current price (~$113) suggesting upside, but valuation remains demanding (P/E ~38.7) alongside operating margin inconsistency.

Disclaimer:This analysis is AI-generated for informational purposes only. Accuracy is not guaranteed and this does not constitute financial advice.

Fundamentals Overview

Loading fundamentals overview...

ORA delivered a record Q1 with revenue $403.9M (+75.8% YoY) and adjusted EBITDA $194.9M (+29.7%), driven primarily by Energy Storage and a step-change from Product project sales. Storage revenue (+153% YoY) benefited from strong availability and favorable PJM merchant pricing, producing 59.1% gross margin in the quarter, but management warned full-year storage margin should normalize to 35%-40% due to less favorable merchant conditions. Electricity faced margin headwinds from Puna rate softness and extreme Nevada ambient temperatures, with gross margin down to 30.8%. Management maintained 2026 guidance (revenue $1.11B-$1.16B; adj. EBITDA $615M-$645M) and framed a ~1%-2% annual margin lift from blend-and-extend PPAs as weather normalizes. On growth optionality, EGS pilots with SLB and Sage target ~2-4MW each around 2027 drilling/permitting, with commercial scale contingent on pilot success and confirmation periods. Capital strength improved via a $1B upsized convertible offering and net debt remaining manageable.

AI IconGrowth Catalysts

  • Energy Storage revenue +153% YoY driven by high asset availability and favorable PJM merchant pricing; COD of Shirk and addition of Hoku (solar+storage) in Hawaii
  • Product segment growth driven by sale/recognition of the top two projects (about $105M revenue recognized in Q1) supporting adjusted profitability
  • Electricity contracted pricing improvement via new/extended PPAs, including ~200MW signed at favorable pricing (Google, Switch, and two blend-and-extend contracts)
  • Geothermal/EGS pipeline advancement: subsurface pilots with SLB and Sage Geosystems plus above-ground converter design for EGS

Business Development

  • PPA signing for Jersey Valley: 67MW solar paired with 268MWh storage; expected online late 2027/early 2028
  • Electricity PPAs for ~200MW at favorable pricing including agreements with Google and Switch, plus two blend-and-extend contracts
  • Blend-and-extend PPA amendment for CD4 geothermal power plant (Mammoth Complex), extending through 2037 and increasing pricing by ~27% effective October 2026
  • Acquired Hoku hybrid solar+storage facility (Hawaii) for ~($80) million cash; includes 30MW solar PV + 30MW/120MWh storage with 25-year PPA
  • Tax equity transactions monetizing PTCs/ITCs; Burdock tax equity transaction referenced for full-year collection

AI IconFinancial Highlights

  • Revenue $403.9M, +75.8% YoY (record Q1); gross profit $120.4M, +65.1% YoY
  • Net income attributable to stockholders $44.1M ($0.71 diluted EPS) vs $40.4M ($0.66) prior year; adjusted net income $80.3M ($1.30) vs $41.5M ($0.68)
  • Adjusted EBITDA $194.9M, +29.7% YoY; driven by Energy Storage (favorable PJM pricing/new capacity) and Product segment from two project sales
  • Q1 one-time pretax expenses ~ $38M: $33.7M induced conversion tied to repurchase of the 2027 convertible note plus $10.2M write-offs/settlement, partially offset by $9.6M gain from Hoku acquisition purchase transaction
  • Electricity gross margin decreased to 30.8% due to lower energy rates at Puna and extremely high ambient temperature in Nevada
  • Product gross margin 21.4%; management guided full-year 2026 product gross margin 18%-20% due to sales mix/top-two project timing
  • Energy Storage gross margin 59.1% in Q1; full-year 2026 storage gross margin guided 35%-40% (management does not forecast similar merchant prices for remainder of year)
  • Tax/tariff impact: expects negative effective tax rate of -15% to -20% in 2026 due to higher ITC level; collected $48.6M cash from PTC/ITC tax equity in Q1 and expects ~$90M in 2026 from ITC/PTC transfers

AI IconCapital Funding

  • Completed a $1.0B upsized convertible note offering in Q1; elected convertible market for low/no cash coupon and reduced dilution via share repurchase at $108/share
  • Cash and cash equivalents + restricted cash: ~$763M at March 31, 2026 vs ~$281M end of 2025
  • Total debt: ~$3.4B (net of deferred financing costs); cost of debt decreased to 3.9% post-offering
  • Net debt: ~$2.6B; net debt/EBITDA ~4.2x
  • CapEx guidance: total 2026 remaining CapEx $587M; electricity $436M; storage $111M; pilots/EGS $20M

AI IconStrategy & Ops

  • Energy Storage strategy: optimize contracted vs merchant exposure; storage portfolio to scale via CODs (Shirk and Hoku) and additional greenfield projects
  • Electricity contract strategy: extend pricing via blend-and-extend amendments; maintain/improve visibility across the development pipeline
  • EGS subsurface pilots: advance land analysis and well engineering with SLB and Sage; target permitting to drill first well later in 2026
  • Next-generation system innovation: developing higher-capacity Ormat Energy Converter (OEC) tailored for EGS to standardize plants and reduce cost

AI IconMarket Outlook

  • 2026 guidance maintained: revenue +14.6% YoY at midpoint to $1,110M-$1,160M
  • Segment revenue outlook 2026: Electricity $715M-$730M; Product $300M-$320M; Energy Storage $95M-$110M
  • Adjusted EBITDA guidance maintained: +8.2% YoY at midpoint to $615M-$645M
  • Operational/portfolio targets: Energy Storage capacity target 2.6-2.8 GW by end of 2028; add 216MW generating capacity from geothermal/hybrid solar by end of 2028

AI IconRisks & Headwinds

  • Weather/curtailment and rate sensitivity: Electricity gross margin pressure in Q1 from Puna lower energy rates and extremely high Nevada ambient temperatures; management expects some recovery as weather impact eases (but margins remain sensitive)
  • Merchant pricing variability: Storage gross margin Q1 benefited from favorable PJM merchant conditions; management explicitly guides lower full-year storage margin (35%-40%) citing lack of similar merchant prices for remainder of year
  • Execution/timing risks in EGS: pilots require permitting and drilling schedules; commercial scale depends on pilot success and performance confirmation period
  • Regulatory/commercial visibility: blend-and-extend and additional PPA negotiations described with timing uncertainty (durations; negotiations may not close immediately)

Q&A: Analyst Interest

  • EGS scale, pilot size, and path to first commercial: Management stated both EGS pilots target ~2-4MW each, with drilling/permitting schedules implying 2027 timing. They described months-long post-start performance observation before deciding to release first commercial EGS project based on pilot success, noting different subsurface technologies/durations by Sage vs SLB.
  • Electricity margin trajectory into 2026-2028 and weather normalization: Management linked future margin improvement to ~40MW blend-and-extend adding ~$7M-$10M annual revenue (another ~1% margin) and another ~40MW under negotiation adding ~$5M-$6M (incremental 1%-2%). They emphasized expense review and expected less extreme warm weather after Q1, with weather impacts improving overall fundamentals while affecting margins.
  • OEC design/EGS TAM and order timing: Management said they are in final OEC design stages and expect, within weeks, market-facing information on a larger turbine size and how standardization can reduce plant cost. They indicated multiple negotiations with EGS developers and that initial purchase orders depend on agreements being signed; no specific TAM number provided.

Sentiment: POSITIVE

Note: This summary was synthesized by AI from the ORA Q1 2026 earnings transcript. Financial data is complex; please verify all metrics against official SEC filings before making investment decisions.

📋 Official Regulatory 10-K / 10-Q SEC Filings

Direct authenticated documentation links to audited SEC database reports for ORA.

SEC EDGAR Live Feed
No recent 10-K available.
No recent 10-Q available.
Loading financial data and tables...
📁

SEC Filings (ORA)

© 2026 Stock Market Info — Ormat Technologies, Inc. (ORA) Financial Profile