Otis Worldwide Corporation

Otis Worldwide Corporation (OTIS) Market Cap

Otis Worldwide Corporation has a market capitalization of .

No quote data available.

CEO: Judith F. Marks

Sector: Industrials

Industry: Industrial - Machinery

IPO Date: 2020-03-19

Website: https://www.otis.com

Otis Worldwide Corporation (OTIS) - Company Information

Market Cap: -|Sector: Industrials

Company Profile

Otis Worldwide Corporation manufactures, installs, and services elevators and escalators in the United States, China, and internationally. The company operates in two segments, New Equipment and Service. The New Equipment segment designs, manufactures, sells, and installs a range of passenger and freight elevators, as well as escalators and moving walkways for residential and commercial buildings, and infrastructure projects. The Service segment performs maintenance and repair services, as well as modernization services to upgrade elevators and escalators. It had a network of approximately 34,000 service mechanics operating approximately 1,400 branches and offices. The company was founded in 1853 and is headquartered in Farmington, Connecticut.

Analyst Sentiment

62%
Buy

From 15 Active Polls

1Y Forecast: $92.00

▲ +0.0% Potential Upside

Consensus Target Metrics

Low Bound

$77

Median

$92

High Bound

$105

Average

$92

Price & Moving Averages

Loading chart...

🎯 Wall Street Analyst Intelligence Report

1-Year structural target targets, chart projections, and sentiment maps.

Average 1Y Target
$92.00
▲ +30.79% Upside
Low Target
$77.00
9% Risk
Median Target
$92.00
31% Mid
High Target
$105.00
49% Max

Consensus Trend Projection

Trailing closures vs. 12-month metrics map.

Analyst Vote Distribution

Aggregate institutional coverage sentiment weights.

Sentiment volume allocation data unavailable.

Historical valuation matrix unavailable.

📘 Full Research Report

ℹ️

AI-Generated Research: This report is for informational purposes only.

📘 OTIS WORLDWIDE CORP (OTIS) — Investment Overview

🧩 Business Model Overview

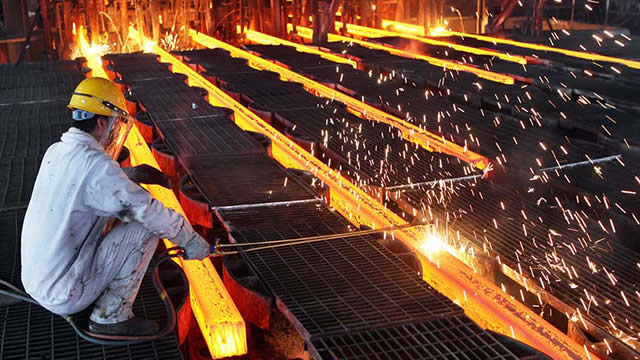
Otis designs, manufactures, and installs elevators and escalators, then monetizes the same installed equipment through long-duration service and maintenance. The value chain runs from (1) project engineering and installation for new-build construction, to (2) aftermarket lifecycle services—preventive maintenance, repairs, modernization, and replacement parts—supported by a global technician and parts network. This structure creates a two-engine model: project-based equipment revenue tied to construction activity, and service revenue tied to the size and age of the installed base.

💰 Revenue Streams & Monetisation Model

Revenue is dominated by a recurring aftermarket stream supported by contracts and service demand. While new equipment sales are more transactional and cyclical with construction spending, aftermarket activities tend to deliver steadier cash flows and higher predictability because elevators and escalators require ongoing inspection, servicing, and component replacement over decades.

  • Service & Maintenance (recurring): Revenue linked to installed base size, service contract coverage, utilization, and pricing/parts mix.
  • Modernization (semi-recurring/replace-and-upgrade): Revenue driven by equipment obsolescence, safety code updates, and customer-driven performance upgrades.
  • New Equipment (transactional): Revenue tied to new building completions, retrofit demand, and contract wins; margins reflect manufacturing scale and project execution.

Margin drivers are typically strongest in the aftermarket through labor productivity, parts procurement leverage, and service pricing discipline. Modernization can offer margin upside when the company can bundle upgrades and access customers through service relationships.

🧠 Competitive Advantages & Market Positioning

Otis’ competitive position is underpinned by a hard-to-replicate installed-base moat and the operational capabilities required to serve it efficiently over time. The installed equipment creates persistent switching frictions: safety-critical servicing, compatibility with control systems and components, and the customer’s preference to rely on a proven, certified provider. Over decades, the service relationship also enables cross-selling modernization and parts.

  • Installed base & switching costs: Once equipment is installed, the economics of ongoing maintenance and compliance favor the incumbent due to familiarity, certification, and parts/service coordination.
  • Network effects (service density): Higher local service volume supports technician density and faster response, improving customer outcomes and reinforcing contract retention.
  • Economies of scale in parts and procurement: Global sourcing and manufacturing scale lower unit costs and support competitive pricing in aftermarket.
  • Intangible assets: Long-lived customer relationships in building owners and property developers, plus embedded engineering expertise around safety, reliability, and code compliance.

Competitive benchmarking:

  • KONE and Schindler operate in the same global lift-and-escalator market and compete strongly in both project wins and service contracts.
  • Thyssenkrupp (including elevator operations) represents another major competitor, though competitive outcomes vary by region and platform.

Otis’ focus is broad-based—new installation plus lifecycle service across a large installed base. Compared with peers that may be more locally concentrated or more project-weighted in certain markets, Otis’ strategy emphasizes maximizing long-term recurring service economics by leveraging installed equipment, geographic service coverage, and modernization access.

🚀 Multi-Year Growth Drivers

Over a 5–10 year horizon, growth is supported by global building demand and the increasing need to retrofit existing vertical transportation assets. Several secular themes expand the total addressable market:

  • Urbanization and building density: Continued growth in cities supports long-duration demand for elevators and escalators in residential towers, offices, hospitals, and transportation hubs.
  • Modernization cycle: Older installed equipment requires upgrades for efficiency, reliability, and compliance with evolving safety and accessibility codes.
  • Energy efficiency and sustainability requirements: Building owners increasingly prioritize reduced energy consumption and improved performance, supporting modernization and replacement of inefficient components.
  • Regulatory and safety standards: Periodic inspections and code-driven upgrades sustain aftermarket demand even when new-build volumes slow.
  • Aftermarket penetration: Service contract coverage and parts replacement intensity can expand through improved routing, preventive maintenance programs, and higher service adoption across the installed base.

⚠ Risk Factors to Monitor

  • Construction cyclicality: Equipment orders depend on building activity; downturns can pressure project revenue and backlog conversion.
  • Working capital and project execution risk: Large project timelines introduce exposure to cost overruns, schedule slippage, and supply constraints.
  • Raw materials, components, and logistics: Changes in input costs and freight dynamics can affect manufacturing margins and project profitability.
  • Regulatory and safety compliance: Evolving codes and inspection requirements can increase engineering and service costs, particularly if implementation timelines compress.
  • Technological disruption: Advances in control systems and connectivity (including remote monitoring) may shift service delivery models and require sustained investment in software, cybersecurity practices, and workforce enablement.
  • Competitive intensity: Price competition for project awards or aggressive service contract pricing in competitive markets can affect margin and renewal rates.

📊 Valuation & Market View

Markets often value elevator and aftermarket-heavy industrial service businesses using EV/EBITDA and earnings multiples, with emphasis on the durability of service cash flows and the visibility of recurring revenue. Key valuation drivers typically include:

  • Aftermarket mix and service growth: Higher service share generally supports steadier earnings and cash generation.
  • Installed-base expansion and contract retention: Sustained renewal rates and modernization conversion support longer-term earnings quality.
  • Execution and margin discipline: Project profitability and aftermarket gross margin performance can move multiples materially.
  • Macro sensitivity: Construction cycles impact equipment volumes; downside protection depends on service resilience and modernization demand.
  • Geographic diversification and currency exposure: Regional construction patterns and FX can influence reported results and investor perception of risk.

🔍 Investment Takeaway

Otis’ long-term investment case rests on a structurally advantaged aftermarket engine: a large, global installed base creates persistent switching frictions and supports recurring service and modernization revenue for decades. With strong service network density, parts/procurement scale, and embedded safety-critical servicing capabilities, Otis is positioned to compound earnings through both new-build growth and the enduring modernization cycle, while managing construction cyclicality through aftermarket durability.


⚠ AI-generated — informational only. Validate using filings before investing.

📊 AI Financial Analysis

Powered by StockMarketInfo
Earnings Data: Q Ending 2026-03-31

"OTIS reported Q1’26 revenue of $3.57B (+6.4% YoY) and net income of $340M (+39.9% YoY), with EPS $0.88. QoQ, revenue declined from $3.80B to $3.57B (-6.0%) and net income fell from $374M to $340M (-9.1%). Profitability was mixed: net margin eased QoQ (from ~9.85% to ~9.54%) but expanded versus last year (from ~7.25% to ~9.54%), indicating improved year-over-year earnings quality. On capital structure, balance sheet totals show negative equity throughout the period (liabilities exceed assets), with net debt improving QoQ (net debt $7.38B vs. $7.65B, -3.5%) but still higher YoY ($7.38B vs. $6.81B, +8.4%). Dividend support appears stable but modest: dividend yield rose to ~0.54% in Q1’26, while the payout ratio improved versus Q1’25 (from ~0.64 to ~0.48). Total shareholder returns look challenged near term: the stock is down 15.86% over the last year and has no provided buyback data. Valuation sentiment is comparatively favorable, with consensus price targets around $92–$94 versus the current $81.43 (implying ~13–15% upside)."

Revenue Growth

Neutral

Revenue was -6.0% QoQ in the latest quarter ($3.57B vs. $3.80B) but +6.4% YoY ($3.57B vs. $3.35B), suggesting a modest underlying growth trend despite quarterly softness.

Profitability

Positive

Net income improved +39.9% YoY ($340M vs. $243M) and net margin expanded from ~7.25% to ~9.54%, though margin contracted slightly QoQ (~9.85% to ~9.54%).

Cash Flow Quality

Neutral

Earnings improved YoY, and the dividend payout ratio declined (Q1’25 ~0.64 to Q1’26 ~0.48), indicating better capacity coverage. Dividend yield remains low (~0.54%), and cash-flow-specific metrics were not provided.

Leverage & Balance Sheet

Caution

Equity is negative across the period (liabilities exceed assets). Net debt decreased QoQ (-3.5%) but increased YoY (+8.4%), reflecting continued leverage pressure.

Shareholder Returns

Caution

1-year performance is negative (-15.86%), and no buyback information is provided. Dividend contribution is small given the ~0.54% yield.

Analyst Sentiment & Valuation

Good

Consensus targets ($92–$94) are above the current price ($81.43), implying ~13–15% upside. Valuation improved versus earlier in the dataset (P/E ~22 vs. ~42 in Q1’25).

Disclaimer:This analysis is AI-generated for informational purposes only. Accuracy is not guaranteed and this does not constitute financial advice.

Fundamentals Overview

Loading fundamentals overview...

Otis began 2026 with solid top-line orders momentum (modernization orders +11%, backlog +30% at constant currency) and strong cash generation (FCF ~$272M, +46% YoY). However, profitability confirms near-term service and equipment headwinds: service margin fell 160 bps to 23% and overall adjusted operating profit margin declined 130 bps to 15.4%, driven by growth investments, lower-value maintenance mix, and Middle East-related timing/inflation pressures. Management’s counterplan is specific: ~$50M incremental service investments in 2026 (Q1: $5M field quality + ~$10M sales capabilities), micro-pricing roll-outs, fuel/logistics surcharges, and targeted indirect cost takeouts (run-rate up to ~$20M). Guidance narrows EPS to $4.20–$4.24 and assumes Middle East conflict ends in Q2, otherwise negative profit impact of $5M–$10M per quarter. The Q&A centered on whether service margins can sequentially stabilize around Q2/Q3 then expand in Q4, with maintenance growth targeted to exit at ~3% full-year supported by retention stabilization.

AI IconGrowth Catalysts

  • Service organic sales +5% with maintenance & repair strength (repair organic +10%; modernization organic +6%) supporting durability from backlog conversion
  • Modernization orders +11% in the quarter; backlog up +30% at constant currency (historically high, approaching ~$20B) driving visibility into 2026+
  • Americas new equipment order growth >20% for the seventh straight quarter (residential, healthcare, data centers cited)
  • Product innovation demand: Otis Robust for data centers/mission-critical; Otis Veeva solutions for aging populations and accessibility via modernization and new installs
  • Gen 3 comfort traction in China: first nationwide implementation referenced via Harbin City residential renewal project (bond-funded)

Business Development

  • Marseille Metropolitan Transport Authority (France): selected Otis to fully replace and maintain 51 escalators across 10 metro stations (35 heavy-duty metro escalators +16 demanding-environment escalators)
  • Austin Convention Center redevelopment (Texas): selected to supply 46 units including SkyRise and Gen 3 elevators plus public escalators
  • Runwin community, Harbin City (China): upgrade 46 elevators for a bond-funded residential renewal project with Gen 3 comfort; includes regen system and Otis ONE IoT platform
  • Maintain (majority investment): Otis announced majority investment; Otis will operate Maintain as an independent, digitally native AI/ML-enabled service ecosystem across at least four other countries and integrated with Otis ONE

AI IconFinancial Highlights

  • Net sales $3.6B; organic sales +1%
  • Adjusted operating profit margin declined 130 bps to 15.4% (reported profits also excluding a $28M foreign exchange tailwind)
  • Adjusted EPS down 3% (down $0.03) versus expectations/ prior year, partially offset by favorable FX
  • Service operating margin contracted 160 bps to 23% due to investments for growth, portfolio mix (maintenance lower-value markets), and revenue/cost timing pressures tied to Middle East-related inflation effects
  • New equipment operating margin declined 240 bps to 3.3% on lower volumes and price/mix (partially offset by productivity)
  • Adjusted free cash flow ~ $272M, up 46% YoY (working capital management and cash conversion cited)

AI IconCapital Funding

  • Dividend: +5% quarterly increase; since spin dividend up ~120%
  • Share repurchases: completed ~$400M opportunistically in Q1; full-year target ~$800M front-loaded in 1H
  • FCF guidance (2026): $1.6B to $1.65B (implies strong cash runway assumptions tied to operating profit and working capital)

AI IconStrategy & Ops

  • Service turnaround plan centers on service excellence investment, micro-pricing, and portfolio mix shift toward higher-value units; retention stabilization highlighted
  • Q1 incremental service baseline costs: $5M additional field colleague costs devoted to service quality
  • Q1 invested ~$10M in sales capabilities in high-value markets (tools, AI pricing algorithm, reps, training); full-year expects ~$50M incremental investments
  • Micro pricing roll-out in higher-value countries for maintenance and repair; management expects contract stickiness and flow-through into revenue
  • Middle East conflict created modernization execution delays in EMEA; management expects delays recoverable and profit neutral full year
  • Cost management: implementing fuel and logistics surcharges (with time lag) and targeted cost reduction in non-frontline activities (up to $20M run-rate savings; ~$10M expected in 2026)

AI IconMarket Outlook

  • 2026 new equipment market: industry units down 2% for the year; growth across all regions except China (Americas strength; Europe acceleration; APAC decline; China stabilization expectations)
  • Modernization: market expected to grow double digits on a dollar basis across regions; modernization orders expected growth in low teens or above sustained
  • 2026 guidance (unchanged ranges except EPS tightening rationale): net sales $15.1B–$15.3B; organic growth low-to-mid single digits
  • 2026 adjusted operating profit: ~$2.5B with +$20M to +$60M constant currency and +$60M to +$100M actual currency
  • 2026 adjusted EPS: narrowed/maintained at $4.20–$4.24 (assumes Middle East conflict ends in 2Q); management expects $5M–$10M negative profit impact per quarter if conflict persists
  • 2026 adjusted free cash flow: $1.6B–$1.65B
  • 2Q cadence: Total adjusted operating profit dollars (constant currency) expected to decline similar to Q1; adjusted EPS down 3% to 5% YoY in Q2; normalization/acceleration expected in 2H

AI IconRisks & Headwinds

  • China demand softness: new equipment orders down low teens; APAC new equipment decline (Asia down 13% in Q1; China softness cited)
  • Middle East conflict: EMEA modernization project delays and cost/inflation timing effects; management assumes neutral full-year profit via surcharges but acknowledged short-term volatility
  • Service margin pressure from portfolio mix: maintenance growth came more from lower-value markets, dragging maintenance organic growth decelerating to ~2% (target to re-accelerate to ~3% with micro pricing/retention improvements)
  • New equipment profitability volatility: 240 bps operating margin decline driven by lower volumes and price/mix despite productivity
  • Tariff environment: guidance assumes modest YoY benefit based on current tariff regulation without assuming tariff reforms

Q&A: Analyst Interest

  • Topic: Service margin build from 23% in Q1 toward stabilization and expansion: Management outlined a sequential path—Q2 near-flat/around 24% (EPB margin) then stabilization in Q3, followed by margin expansion in Q4, citing pricing recovery lag, modernization/repair execution ramp in Q2, retention payback, and cost actions.
  • Topic: Maintenance growth trajectory and retention linkage: Management clarified maintenance organic growth is expected to reach ~3% full-year with Q1 around ~2%, and emphasized retention as the key metric. Retention stabilized at the same level as full-year ’25 ex China, up ~50 bps YoY in Q1 ’26 vs Q1 ’25.
  • Topic: Competitive services disruption from ISPs and Otis margin confidence: Management discussed Maintain as a digitally native, AI/ML ecosystem (machine-learning-driven learning across mechanics) operated independently post-investment and aligned with Otis ONE for multi-branded installed base. For margins, management was confident Q4 ’26 exceeds Q4 ’25 despite prior one-off asset sale benefits.

Sentiment: MIXED

Note: This summary was synthesized by AI from the OTIS Q1 2026 earnings transcript. Financial data is complex; please verify all metrics against official SEC filings before making investment decisions.

Loading financial data and tables...
© 2026 Stock Market Info — Otis Worldwide Corporation (OTIS) Financial Profile