Phibro Animal Health Corporation

Phibro Animal Health Corporation (PAHC) Market Cap

Phibro Animal Health Corporation has a market capitalization of $1.47B.

Price: $36.33

-0.12 (-0.33%)

Market Cap: 1.47B

NASDAQ · time unavailable

CEO: Daniel Bendheim

Sector: Healthcare

Industry: Drug Manufacturers - Specialty & Generic

IPO Date: 2014-04-11

Website: https://www.pahc.com

Phibro Animal Health Corporation (PAHC) - Company Information

Market Cap: 1.47B|Sector: Healthcare

Company Profile

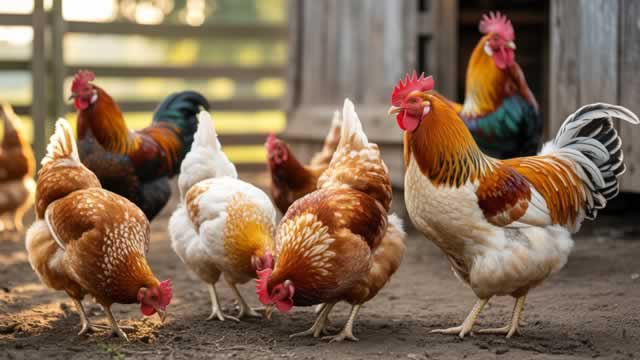
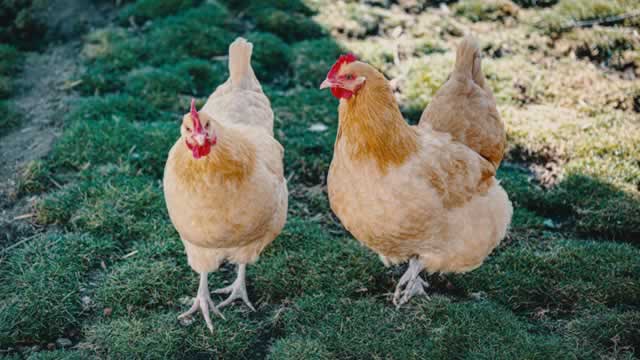
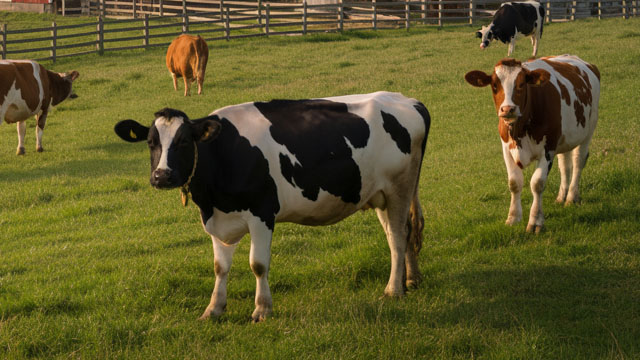
Phibro Animal Health Corporation operates as a global entity focused on the research, production, and supply of a wide array of animal health and mineral nutrition solutions. While serving a global clientele, its primary market for livestock products is the United States. The company's operations are divided into three main business segments: Animal Health, Mineral Nutrition, and Performance Products. Phibro develops, manufactures, and markets products tailored for various food-producing animals, including poultry, swine, beef and dairy cattle, and aquaculture. Its Animal Health offerings encompass a broad range of pharmaceutical and biological products. These include antimicrobials (both chemical and biological agents) designed to prevent and treat bacterial ailments; anticoccidials, primarily used to control and prevent coccidiosis in poultry and cattle; anthelmintics for combating parasitic intestinal worm infestations; and specific anti-bloat treatments for cattle grazing on legume or wheat pastures. Additionally, the company provides specialized nutritional supplements engineered to enhance animal health and performance, alongside vaccines predominantly for the poultry and swine industries to protect against diseases. The Mineral Nutrition segment focuses on the creation and distribution of various trace mineral formulations and concentrates, featuring elements such as zinc, manganese, copper, iron, and other vital compounds. Furthermore, under its Performance Products segment, Phibro supplies an assortment of specialty ingredients that find application in diverse industries, including personal care, industrial chemicals, and chemical catalysts. Phibro's animal health and mineral nutrition products reach customers through a multi-channel distribution network, including its own local sales offices, direct sales to integrated poultry, swine, and cattle operations, and through commercial animal feed producers, wholesalers, and distributors. The company boasts an extensive international presence, conducting business across the United States, Latin America, Canada, Europe, the Middle East, Africa, and the Asia Pacific region. Initially known as Philipp Brothers Chemicals, Inc., the company adopted the name Phibro Animal Health Corporation in July 2003. It was officially incorporated in 2014 and maintains its corporate headquarters in Teaneck, New Jersey.

Analyst Sentiment

60%
Buy

From 5 Active Polls

1Y Forecast: $49.00

▲ +34.9% Potential Upside

Consensus Target Metrics

Low Bound

$49

Median

$49

High Bound

$49

Average

$49

Price & Moving Averages

Loading chart...

🎯 Wall Street Analyst Intelligence Report

1-Year structural target targets, chart projections, and sentiment maps.

Average 1Y Target
$49.00
▲ +34.87% Upside
Low Target
$49.00
35% Risk
Median Target
$49.00
35% Mid
High Target
$49.00
35% Max
Consensus
Buy
6 / 14 Buys

Consensus Trend Projection

Trailing closures vs. 12-month metrics map.

Analyst Vote Distribution

Aggregate institutional coverage sentiment weights.

📊 Historical Valuation Multiples

Real-time Trailing Twelve Month (TTM) momentum side-by-side with discrete quarterly metrics.

Fiscal QuarterTTMQ1 2026Q4 2025Q3 2025Q2 2025Q1 2025Q4 2024Q3 2024Q2 2024
Period EndingTrailing 12MMar 31, 2026Dec 31, 2025Sep 30, 2025Jun 30, 2025Mar 31, 2025Dec 31, 2024Sep 30, 2024Jun 30, 2024
Market Cap ($M)1,4732,2431,5141,6401,034865851912690
Enterprise Value ($M)2,2052,9752,2322,3521,7281,5751,5731,3721,145
Price to Earnings Ratio (P/E)15.5323.4413.7415.5615.2010.2765.6333.12229.03
Price/Earnings-to-Growth Ratio (PEG)9.104.991.710.823.5060.64
Price to Sales Ratio (P/S)0.985.854.054.512.732.492.753.502.53
Price to Book Ratio (P/B)4.076.204.565.263.623.253.453.532.69
Price to Free Cash Flow Ratio (P/FCF)115.322520.09183.45-364.12127.2324.43-179.22300.1544.94
Enterprise Value to Sales (EV/Sales)7.765.976.464.564.535.095.274.19
Enterprise Value to EBITDA (EV/EBITDA)9.7953.4735.7837.5938.6430.6561.5051.2153.64
Debt to Equity Ratio3.252.182.332.522.672.893.201.982.05

📘 Full Research Report

ℹ️

AI-Generated Research: This report is for informational purposes only.

📘 PHIBRO ANIMAL HEALTH CORP CLASS A (PAHC) — Investment Overview

🧩 Business Model Overview

Phibro Animal Health operates in specialty animal health and nutrition, selling a portfolio of performance-oriented ingredients and health solutions that feed into customers’ production systems. The value chain typically runs from Phibro’s R&D, regulatory work, and manufacturing into sales with animal producers, feed manufacturers, and distributors.

A key feature of the model is that customers are not simply purchasing a commodity “input”; they are qualifying products based on performance outcomes (growth, feed efficiency, disease risk reduction, and process outcomes). That qualification dynamic supports stickiness and lowers the likelihood of rapid substitution once products are approved for a given production setup.

💰 Revenue Streams & Monetisation Model

Revenue is primarily driven by sales of specialty products used in animal production—most transactions are tied to recurring operational needs rather than one-time projects. Monetisation reflects both:

  • Portfolio mix: branded/specialty products generally support better pricing power than generic equivalents, improving gross margin resilience.
  • Species and application coverage: breadth across categories (including feed additives and related animal health solutions) diversifies end-demand within animal agriculture.
  • Supply and cost discipline: margins depend on manufacturing efficiency, quality consistency, and the ability to manage input and logistics costs.

While pricing can fluctuate with industry conditions, the monetisation model tends to be supported by product performance, regulatory status, and customer qualification—factors that make revenue more durable than pure commodity exposure.

🧠 Competitive Advantages & Market Positioning

Phibro’s differentiation is strongest in hard-to-substitute specialty animal nutrition and health, where buyers evaluate efficacy, regulatory acceptability, and integration into their production workflows.

Moat: Switching costs + regulatory/qualification barriers.

  • Switching costs: Feed and animal health programs are optimized over time. Substituting an ingredient often requires re-qualification, formulation adjustments, and performance verification, creating friction for customers.
  • Regulatory and documentation barriers: Product approvals, tolerances, and dossier content raise the cost and time for entrants attempting to replicate an established offering.
  • Process and manufacturing know-how: Specialty products require consistent quality and reliable supply. Operational capability becomes a competitive advantage when buyers prioritize performance stability.

Competitive benchmarking (industry focus contrast)

  • Zoetis (animal health, with meaningful biologics and pharmaceuticals focus) vs. Phibro (more concentrated in specialty nutrition/health solutions and performance ingredients).
  • Elanco Animal Health (broad animal health portfolio, including pharmaceuticals) vs. Phibro (emphasis on feed and specialty solutions where qualification and operational integration matter).
  • Merck Animal Health (large portfolio across vaccines and therapeutics) vs. Phibro (specialty additives and solutions where regulatory status and customer onboarding can be decisive).

Compared with larger, vaccine- and pharma-heavy peers, Phibro’s edge tends to concentrate in programmatic, ingredient-based solutions where performance outcomes and adoption economics support durability.

🚀 Multi-Year Growth Drivers

  • Protein demand and production intensification: Growth in animal protein consumption supports steady demand for performance-enhancing nutrition and disease-risk management tools.
  • Antibiotic stewardship and “non-antibiotic” strategies: Ongoing industry emphasis on responsible antimicrobial use supports demand for alternatives and supportive nutrition and health solutions.
  • Food safety and regulatory compliance: Stronger enforcement and residue management requirements can favor established suppliers with proven documentation and operational controls.
  • Aquaculture and specialty species growth: Expanded production systems and evolving health challenges broaden the TAM for specialty solutions outside traditional livestock.
  • Cross-category portfolio leverage: As customers standardize production programs, suppliers that can meet multiple needs within a facility can deepen share through program continuity.

Over a 5–10 year horizon, the TAM growth case is less about volume alone and more about the role specialty inputs play in meeting productivity, compliance, and stewardship objectives in animal agriculture.

⚠ Risk Factors to Monitor

  • Regulatory changes: Label updates, approval frameworks, or residue and use restrictions can affect product economics and product timelines.
  • Competitive substitution and pricing pressure: Entrants or lower-cost alternatives can pressure margins, particularly when products become commoditized.
  • Raw material and manufacturing cost swings: Specialty production can be sensitive to input availability, utilities, and quality-related expenses.
  • Customer concentration and program transitions: Large procurement relationships and feed program decisions can influence demand visibility and inventory behavior.
  • Animal disease outbreaks: Health shocks can alter purchasing patterns and production schedules, creating demand volatility.
  • Supply chain and compliance risk: Operational disruptions or quality incidents can impair customer trust and delay onboarding of new volume.

📊 Valuation & Market View

The market typically values specialty animal health and nutrition businesses using EV/EBITDA and earnings-based multiples, with sentiment heavily influenced by:

  • Margin durability (mix, pricing power, and manufacturing discipline)
  • Growth credibility tied to adoption of specialty programs rather than one-off volume
  • Product pipeline and regulatory execution (ability to sustain the portfolio over time)
  • Quality of earnings (working-capital behavior, supply reliability, and customer retention)

For investors, the key valuation driver is the perceived combination of durable demand and defensible margins from switching costs and regulatory/qualification barriers.

🔍 Investment Takeaway

Phibro’s long-term thesis centers on structural customer stickiness created by qualification and switching frictions, supported by regulatory and manufacturing barriers that deter rapid entry or substitution. With multi-year demand tailwinds from protein production growth and responsible-antibiotic pressures, the company is positioned to compete on specialty performance rather than pure commodity price. The investment case warrants close monitoring of regulatory outcomes, margin stability, and competitive substitution dynamics.


⚠ AI-generated — informational only. Validate using filings before investing.

📰 Market News & Coverage

15 Stories Available

Real-time institutional reporting and market updates for PAHC.

businesswire.com2026-07-28

Phibro Animal Health Corporation Declares Quarterly Dividend

TEANECK, N.J.--(BUSINESS WIRE)--The Board of Directors of Phibro Animal Health Corporation (Nasdaq: PAHC) today declared a quarterly cash dividend of $0.12 per share on its Class A common stock and Class B common stock, , payable on September 23, 2026, to stockholders of record at the close of business on September 2, 2026.About Phibro Animal Health CorporationPhibro Animal Health Corporation is a leading global diversified animal health and nutrition company. We strive to be a trusted partner w.

zacks.com2026-07-27

PAHC vs. SYK: Which Stock Is the Better Value Option?

Investors interested in stocks from the Medical - Products sector have probably already heard of Phibro Animal Health (PAHC) and Stryker (SYK). But which of these two companies is the best option for those looking for undervalued stocks?

zacks.com2026-07-14

Why Phibro Animal Health (PAHC) is a Top Value Stock for the Long-Term

Wondering how to pick strong, market-beating stocks for your investment portfolio? Look no further than the Zacks Style Scores.

zacks.com2026-07-09

PAHC or LZAGY: Which Is the Better Value Stock Right Now?

Investors interested in stocks from the Medical - Products sector have probably already heard of Phibro Animal Health (PAHC) and Lonza Group Ag (LZAGY). But which of these two stocks is more attractive to value investors?

zacks.com2026-07-06

Implied Volatility Surging for Phibro Animal Health Stock Options

Investors need to pay close attention to PAHC stock based on the movements in the options market lately.

zacks.com2026-06-29

Wall Street Analysts Predict a 36.23% Upside in Phibro (PAHC): Here's What You Should Know

The average of price targets set by Wall Street analysts indicates a potential upside of 36.2% in Phibro (PAHC). While the effectiveness of this highly sought-after metric is questionable, the positive trend in earnings estimate revisions might translate into an upside in the stock.

zacks.com2026-06-22

PAHC vs. SYK: Which Stock Is the Better Value Option?

Investors interested in stocks from the Medical - Products sector have probably already heard of Phibro Animal Health (PAHC) and Stryker (SYK). But which of these two companies is the best option for those looking for undervalued stocks?

zacks.com2026-06-17

What Makes Phibro (PAHC) a New Buy Stock

Phibro (PAHC) might move higher on growing optimism about its earnings prospects, which is reflected by its upgrade to a Zacks Rank #2 (Buy).

fool.com2026-06-13

Is Beaten-Down Phibro Animal Health Stock a Buy Following an Insider Purchase of 10,000 Shares?

This animal health provider, serving global livestock markets, reported a notable insider buy in its latest SEC filing.

zacks.com2026-06-03

PAHC vs. SYK: Which Stock Should Value Investors Buy Now?

Investors looking for stocks in the Medical - Products sector might want to consider either Phibro Animal Health (PAHC) or Stryker (SYK). But which of these two stocks offers value investors a better bang for their buck right now?

zacks.com2026-06-01

Here's Why Phibro Animal Health (PAHC) is a Strong Value Stock

Wondering how to pick strong, market-beating stocks for your investment portfolio? Look no further than the Zacks Style Scores.

zacks.com2026-05-29

Implied Volatility Surging for Phibro Stock Options

Investors need to pay close attention to PAHC stock based on the movements in the options market lately.

gurufocus.com2026-05-28

Phibro Animal Health Corp (PAHC) Shares Fall 3.1% -- GF Value Says Still Overvalued

On May 28, 2026, Phibro Animal Health Corp (PAHC) shares fell 3.1% today, closing at $31.83. The stock has experienced significant volatility, trading between a

zacks.com2026-05-25

Should Value Investors Buy Phibro Animal Health (PAHC) Stock?

Here at Zacks, our focus is on the proven Zacks Rank system, which emphasizes earnings estimates and estimate revisions to find great stocks. Nevertheless, we are always paying attention to the latest value, growth, and momentum trends to underscore strong picks.

businesswire.com2026-05-21

Phibro Animal Health Corporation to Participate in Stifel Jaws & Paws Conference

TEANECK, N.J.--(BUSINESS WIRE)--Phibro Animal Health Corporation (Nasdaq: PAHC) announced today it will participate in the Stifel Jaws & Paws Conference. Executive Vice President, Corporate Strategy & CEO Designate, Daniel Bendheim; Chief Operating Officer, Larry Miller; and Chief Financial Officer, Glenn David will address financial analysts and investors on Wednesday, May 27, 2026, at 9:45 AM ET at Lotte New York Palace in New York. The live audio presentation will be available on the.

📊 AI Financial Analysis

Powered by StockMarketInfo
Earnings Data: Q Ending 2026-03-31

"PAHC reported Q3 2026 revenue of $383.5M and net income of $24.0M (EPS $0.59). Revenue increased 2.5% QoQ ($373.9M in Q2 2026) and 10.4% YoY ($347.8M in Q3 2025). Net income rose 12.0% QoQ (from $27.5M down to $24.0M? actually Q2 net income was $27.5M, so this is a -12.5% QoQ decline) and 15.1% YoY (from $20.9M). Margins strengthened on a YoY basis: gross margin was 32.8% vs 30.1% in Q3 2025, while net margin was 6.3% vs 6.0% (slightly higher). However, profitability softened QoQ: net margin declined from 7.3% in Q2 2026 to 6.3% in Q3 2026, consistent with operating income rising less than revenue. Cash generation remained positive but weaker QoQ: operating cash flow was $16.2M and free cash flow was about $0.9M (vs FCF $8.3M in Q2). The company paid dividends of ~$4.9M and did not repurchase shares. Balance sheet leverage is still meaningful for a non-bank: total assets rose to $1.45B, equity increased to $361.8M, but net debt remains high at ~$542.8M. Shareholder returns appear very strong: the stock trades at $57.07 with +239.1% 1-year change and modest dividend yield (~0.22%), implying most of the return came from capital appreciation. Analyst consensus target is $49, below the current price, suggesting valuation risk despite strong momentum."

Revenue Growth

Good

Revenue grew +2.5% QoQ ($373.9M to $383.5M) and +10.4% YoY ($347.8M to $383.5M), with a generally upward trajectory over the last 4 quarters.

Profitability

Neutral

Margins improved YoY (gross margin 32.8% vs 30.1%; net margin 6.3% vs 6.0%), but contracted QoQ (net margin 7.3% in Q2 to 6.3% in Q3). EPS rose YoY ($0.52 to $0.59) but fell QoQ ($0.68 to $0.59).

Cash Flow Quality

Fair

Operating cash flow was positive at $16.2M, but free cash flow fell to ~$0.9M from $8.3M QoQ, indicating reduced cash conversion in the quarter. Dividends of ~$4.9M were maintained; no buybacks.

Leverage & Balance Sheet

Neutral

Balance sheet size increased (assets $1.45B) and equity rose to $361.8M, but leverage remains elevated (net debt ~$542.8M; total debt ~$597.7M). Liquidity is solid with current ratio ~3.17.

Shareholder Returns

Strong

Total shareholder return momentum is strong: +239.1% 1-year price change, while dividend yield is low (~0.22%). With no buybacks reported, gains are primarily capital appreciation.

Analyst Sentiment & Valuation

Caution

Consensus price target (~$49) is below the current price ($57.07), implying limited upside per analyst targets and potential valuation compression risk despite strong momentum.

Disclaimer:This analysis is AI-generated for informational purposes only. Accuracy is not guaranteed and this does not constitute financial advice.

Fundamentals Overview

Loading fundamentals overview...

PAHC delivered a solid Q3 with net sales of $383.5M (+10% YoY) and adjusted EBITDA of $60M (+11%). Animal Health growth drove performance: legacy MFA +5% plus a full-quarter contribution from new MFA ($95.9M, +25%), alongside vaccines (+16%) and nutritional specialties (+8%). Offsets came from Performance Products (-17%) tied to weaker personal-care ingredient demand, higher SG&A (employee costs), and higher interest expense from swap expiration; FX moved from a gain to losses ($1.9M). Management updated FY2026 guidance, lifting the low end across net sales, adjusted EBITDA, and adjusted net income, with midpoints implying ~14%, ~37%, and ~47% growth. Cash generation was pressured by inventory build ahead of tariffs and demand, but inventory should stabilize. Key moving pieces for future quarters are the Brazil antimicrobial regulatory transition (virginiamycin/bacitracin) and Middle East freight/vaccine risk—both partially embedded in guidance.

AI IconGrowth Catalysts

  • Animal Health sales +13%: legacy MFA +5% supported by North America demand and certain antimicrobials sold by Ethanol Performance; new MFA contributed $95.9M (+25%) full-quarter
  • Nutritional specialties sales +8% driven by higher North America demand and companion animal
  • Vaccines sales +16% driven by higher demand in Israel and increased autogenous vaccines
  • Brazil antimicrobial regulatory transition viewed as completed 'last major shoe to drop' (growth promotion/performance indications removed for virginiamycin and bacitracin; 180-day transition) with expected therapeutic approvals; management expects offsetting growth from other portfolio parts

Business Development

  • Verratain (Verified Sustainability Solutions) launched via partnership with VAXA (sustainable solutions platform)
  • Engagement with MAPA (Brazil regulatory agency) for therapeutic registrations for virginiamycin and bacitracin (final stages of review)

AI IconFinancial Highlights

  • Q3 net sales $383.5M (+$35.7M, +10% YoY); Animal Health +13%, Mineral Nutrition +10%, Performance Products -17%
  • Q3 adjusted EBITDA $60.0M (+11% YoY); adjusted net income +19% and adjusted diluted EPS +19%
  • GAAP EPS/diluted EPS increased; higher gross profit offset by higher SG&A from employee-related costs and higher interest expense (swap expiration); foreign currency losses $1.9M vs gains $5.5M prior year
  • Income tax expense decreased by ~$0.5M YoY
  • Cash generation impacted by inventory buildup ahead of tariffs and to meet increasing customer demand; inventory expected to stabilize in coming quarters
  • FY2026 guidance update: midpoint of net sales ~14% growth (raised low-end); adjusted EBITDA midpoint ~37%; adjusted net income midpoint ~47%

AI IconCapital Funding

  • Revolver upsized by $125M via oversubscribed process (enhanced financial flexibility)
  • Cash and cash equivalents + short-term investments: $77.5M at quarter end
  • Free cash flow: $13M positive for 12 months ended March 31, 2026 (operating cash flow $66M; capex $53M)
  • Total debt: $741M; trailing-twelve-month adjusted EBITDA: $241M; gross leverage 3.1x; net leverage 2.8x (net debt $663M)

AI IconStrategy & Ops

  • Phibro Vet platform positioning for prescription-based environment in Brazil as antimicrobial products shift to therapeutic use
  • Sustainable solutions platform rollout: Verratain designed for scalability without requiring customers to overhaul operations (early stages)
  • Manage elevated geopolitical volatility in Middle East while maintaining vaccine exposure; guidance incorporates potential downside
  • No Q3 pull-forward dynamics cited; commentary focused on stronger Q4 comparators for 2025 and conservatism in revenue guide amid Middle East uncertainties

AI IconMarket Outlook

  • FY2026 guidance (updated): net sales $1.46B-$1.5B (midpoint ~$1.48B); adjusted EBITDA $247M-$255M (midpoint ~$251M); adjusted net income $122M-$127M (midpoint ~$124.5M)
  • FY2027: Brazil virginiamycin transition expected to be a headwind; management expects therapeutic approvals within the 6-month transition period and better quantification once final approval is received
  • Analyst follow-up: management anticipates being towards the higher end of the FY2026 revenue range due to unknowns around Middle East conflict

AI IconRisks & Headwinds

  • Brazil antimicrobial transition/headwind: removal of growth promotion/performance indications (virginiamycin, bacitracin) with 180-day transition and therapeutic approvals pending; cited as headwind for FY2027
  • Middle East geopolitical volatility: elevated shipping/freight/oil uncertainty; management states guidance range includes shipping cost increases and small downside risk to vaccines
  • Performance Products weakness: -17% YoY net sales due to lower demand for ingredients used in personal care products
  • Inventory buildup ahead of tariffs and to meet demand negatively impacted cash generation; stabilization expected in coming quarters

Q&A: Analyst Interest

  • Sustainability financing and competitive set: Management quantified Verratain as economically enabling Scope 3 pledge execution, not a generic carbon claim. They declined to give explicit debt sizing, but argued the market is “tens of billions to hundreds of billions” while competes indirectly by species and emissions type versus ammonia and methane products.
  • Middle East exposure and shipping economics: Management stated FY2027 guidance includes additional freight/shipping costs and potential vaccine-related downside. They said current observed impact has been limited and characterized the downside as a “small risk,” but still embedded into the guidance range despite oil-price uncertainty.
  • Revenue cadence and implied slowdown: Management denied Q3 pull-forward. They emphasized tougher 2025 comparators into Q4 (step-up from $348M Q3 2025 to $379M in Q4) and said revenue guidance likely took a conservative stance due to Middle East unknowns, expecting outperformance toward the high end.

Sentiment: MIXED

Note: This summary was synthesized by AI from the PAHC Q3 2026 (fiscal quarter ended March 31, 2026; earnings call dated 2026-05-07) earnings transcript. Financial data is complex; please verify all metrics against official SEC filings before making investment decisions.

📋 Official Regulatory 10-K / 10-Q SEC Filings

Direct authenticated documentation links to audited SEC database reports for PAHC.

SEC EDGAR Live Feed
Loading financial data and tables...
📁

SEC Filings (PAHC)

© 2026 Stock Market Info — Phibro Animal Health Corporation (PAHC) Financial Profile