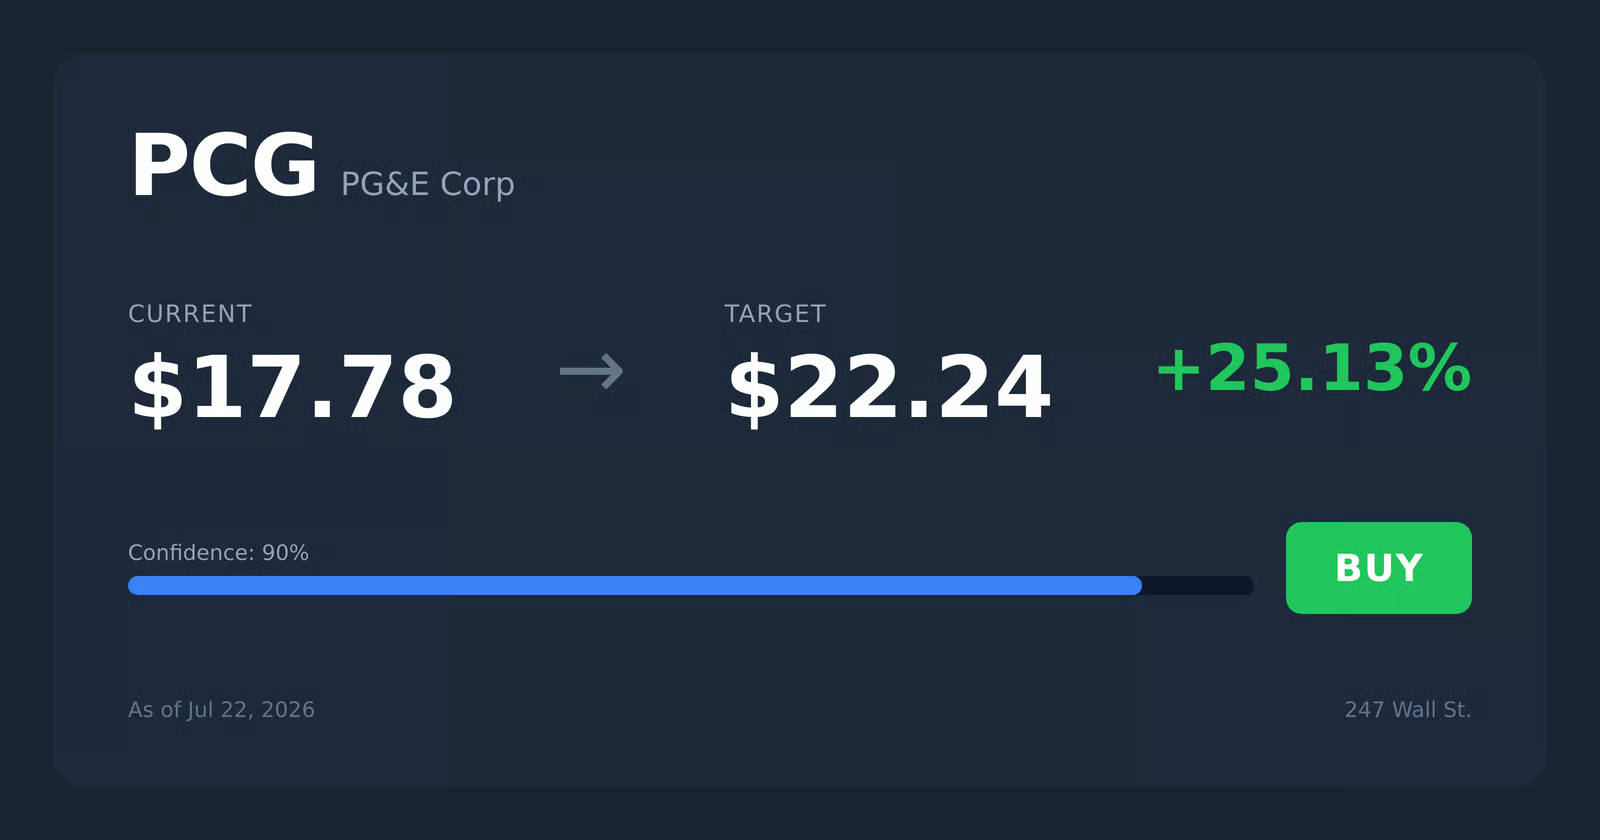
PG&E Corporation

PG&E Corporation (PCG) Market Cap

PG&E Corporation has a market capitalization of $46.58B.

Price: $17.38

-0.40 (-2.25%)

Market Cap: 46.58B

NYSE · time unavailable

CEO: Patricia Kessler Poppe

Sector: Utilities

Industry: Regulated Electric

IPO Date: 1972-06-01

Website: https://www.pgecorp.com

PG&E Corporation (PCG) - Company Information

Market Cap: 46.58B|Sector: Utilities

Company Profile

PG&E Corporation operates as a holding company, overseeing the generation, transmission, and distribution of electricity and natural gas to its clientele. The firm's expertise spans a broad range of energy-related services, including general utilities, power provision, gas supply, electrical grids, solar solutions, and sustainability initiatives. Established in 1995, the company maintains its corporate headquarters in Oakland, California.

Analyst Sentiment

89%
Strong Buy

From 18 Active Polls

1Y Forecast: $23.83

▲ +37.1% Potential Upside

Consensus Target Metrics

Low Bound

$22

Median

$23

High Bound

$28

Average

$24

Price & Moving Averages

Loading chart...

🎯 Wall Street Analyst Intelligence Report

1-Year structural target targets, chart projections, and sentiment maps.

Average 1Y Target
$23.83
▲ +37.11% Upside
Low Target
$22.00
27% Risk
Median Target
$23.00
32% Mid
High Target
$28.00
61% Max
Consensus
Buy
18 / 30 Buys

Consensus Trend Projection

Trailing closures vs. 12-month metrics map.

Analyst Vote Distribution

Aggregate institutional coverage sentiment weights.

📊 Historical Valuation Multiples

Real-time Trailing Twelve Month (TTM) momentum side-by-side with discrete quarterly metrics.

Fiscal QuarterTTMQ2 2026Q1 2026Q4 2025Q3 2025Q2 2025Q1 2025Q4 2024Q3 2024
Period EndingTrailing 12MJun 30, 2026Mar 31, 2026Dec 31, 2025Sep 30, 2025Jun 30, 2025Mar 31, 2025Dec 31, 2024Sep 30, 2024
Market Cap ($M)46,58037,03838,63635,57633,14630,64037,71043,20542,248
Enterprise Value ($M)110,220100,678100,08796,19892,16789,82195,655100,608101,384
Price to Earnings Ratio (P/E)12.5912.7411.2613.8510.1914.5215.3416.8218.31
Price/Earnings-to-Growth Ratio (PEG)9.951.561.711.45
Price to Sales Ratio (P/S)1.806.285.615.235.305.206.306.527.11
Price to Book Ratio (P/B)1.131.091.161.091.040.981.231.431.57
Price to Free Cash Flow Ratio (P/FCF)-10.93-17.97-41.72-29.75-414.32-15.26177.04-48.2280.32
Enterprise Value to Sales (EV/Sales)17.0614.5514.1414.7515.2315.9915.1717.07
Enterprise Value to EBITDA (EV/EBITDA)10.6743.3034.8334.5939.2735.3237.0843.1641.11
Debt to Equity Ratio6.161.911.891.881.871.911.951.942.24

📘 Full Research Report

ℹ️

AI-Generated Research: This report is for informational purposes only.

📘 PG&E CORP (PCG) — Investment Overview

🧩 Business Model Overview

PG&E operates regulated utility networks that deliver essential energy services within defined geographic service territories in Northern and Central California. The value chain is straightforward: (1) utilities acquire and transmit energy (electricity and natural gas) through long-lived infrastructure, (2) they distribute that energy to end customers, and (3) they maintain safety, reliability, and compliance via ongoing inspection, operational controls, and capital expenditures.

Customer “stickiness” is structural. Residential and commercial customers cannot practically switch away from the local electric and gas distribution network because the utility’s poles, wires, pipelines, and operating permits are fixed to the geography. This creates high switching costs at the customer level and supports predictable service demand, even when consumption patterns fluctuate.

💰 Revenue Streams & Monetisation Model

PG&E’s monetisation is dominated by regulated tariff mechanisms tied to its investments in the grid and its cost-to-serve. The core revenue logic is “rate base economics”: the utility earns an allowed return on prudently spent capital and recovers operating costs through approved rates.

  • Distribution and transmission (electric): Revenue primarily reflects grid usage and regulatory recovery of operational expenses plus an allowed return on the electric network.
  • Gas distribution: Revenue reflects serving local gas demand and the costs of operating and maintaining gas pipelines, including safety and compliance programs.
  • Regulatory recovery of capital and operating costs: Large categories of spending (reliability upgrades, wildfire hardening, system modernization) are monetised through regulatory rate approvals and mechanisms that can offset earnings volatility.

Margin drivers are less about competitive pricing power and more about (1) regulatory approval of the cost of capital and the prudency of spending, (2) the efficiency of executing capital programs, and (3) the stability of allowed recovery versus weather- and volume-driven operating variability.

🧠 Competitive Advantages & Market Positioning

PG&E’s moat is primarily geographic and regulatory: long-lived network assets located within exclusive service territories, backed by permitting, franchise rights, and a regulatory regime that remunerates the utility for providing reliability and safety. The practical effect is that competitors cannot replicate the network fast enough to challenge market share at the retail level.

Key moat characteristics:

  • Switching Costs (customer-level): End users are effectively tied to the local electric and gas distribution infrastructure.
  • Geographic Cost Advantage (asset locality): The company’s network spans dense, defined service territories; duplicating poles, wires, and pipeline corridors is capital- and permitting-intensive.
  • Regulatory Moat: Earnings power is shaped by tariff structures, recovery mechanisms, and allowed returns—competitors lack the same approved service footprint.

Competitive benchmarking (industry peers): PG&E is a California investor-owned utility with electric and gas distribution/transmission exposure. Primary peers include:

  • Southern California Edison (SCE) — Edison International (electric utility focus in a neighboring California territory)
  • San Diego Gas & Electric (SDG&E) — Sempra Energy (electric and gas utility operations in another California territory)
  • Duke Energy (regulated utility model across broader U.S. geographies, with differing regulatory and wildfire/weather risk profiles)

Compared with these rivals, PG&E’s competitive positioning is shaped by the specific California operating environment—particularly wildfire risk management and the pace and scope of grid hardening and compliance investments. While the regulated-utility business model is shared, the risk and capital cadence are more idiosyncratic to the Northern/Central California footprint.

🚀 Multi-Year Growth Drivers

Over a 5–10 year horizon, growth is driven by the need to maintain and modernize critical infrastructure while integrating evolving load patterns. In regulated utilities, “growth” typically manifests through rate base expansion and reliability-linked capital investment rather than rapid customer acquisition.

  • Grid modernization and reliability hardening: Sustained capital programs aimed at reducing outage frequency and improving system resiliency support long-term earnings visibility subject to regulatory prudency review.
  • Electrification and load growth mix: Technology and policy tailwinds shift energy usage toward electricity, increasing the relevance of distribution capacity, interconnection, and system planning.
  • Renewable integration and power quality: As generation mix evolves, the grid requires upgrades in control systems, distribution management, and transmission/distribution interdependencies.
  • Gas system safety and integrity: Ongoing pipeline inspection, replacement, and compliance investments protect the asset base that underpins stable gas distribution service.

The total addressable “opportunity” is largely represented by the regulated capital and operating programs required to keep the grid safe, reliable, and compliant—capital intensity that converts into earnings when regulatory outcomes are favorable.

⚠ Risk Factors to Monitor

  • Regulatory approval risk: Earnings depend on prudency determinations, cost recovery mechanisms, and the treatment of risk items in tariff proceedings. Adverse regulatory outcomes can compress allowed returns or delay recovery.
  • Wildfire and liability exposure: The durability of balance sheet protections, claims management, and reserve frameworks materially affects investor confidence and financing flexibility.
  • Capital intensity and execution risk: Large infrastructure programs introduce schedule, cost, and contractor performance risks. Execution problems can raise regulatory scrutiny and reduce the margin of safety.
  • Financing and credit profile: Regulated utilities require ongoing capital; cost of capital and credit conditions can influence the effectiveness of capital plans and the stability of funding sources.
  • Operational and cybersecurity risk: Grid control systems and operational technology create targets for cyber events; reliability interruptions can also create downstream regulatory penalties or reputational damage.
  • Weather and demand volatility: Extreme heat, wildfire conditions, and consumption swings can pressure operating costs, outage rates, and volume-related metrics.

📊 Valuation & Market View

The market typically values regulated utilities through a lens that differs from classic growth equities. Traditional multiples (such as EV/EBITDA or price-to-book) are supplemented by the market’s expectations for:

  • Allowed return on rate base: Confidence in the cost of capital and the stability of regulatory outcomes supports higher valuation multiples.
  • Rate base growth quality: Capital programs that are demonstrably prudent and reliably recoverable are valued more favorably than discretionary or contested spending.
  • Risk premium: Wildfire/liability uncertainty and regulatory friction can raise the implied risk premium, lowering valuation despite durable underlying demand.
  • Cash flow durability: The ability to convert regulated earnings into predictable cash flows influences enterprise value and credit-sensitive valuation metrics.

Catalysts that move valuation are usually structural rather than cyclical: progress on regulatory clarity, de-risking of liability exposure, and successful execution of grid modernization programs within approved frameworks.

🔍 Investment Takeaway

PG&E’s long-term thesis rests on a structural utility franchise: fixed geographic service territory, high customer switching costs, and a regulatory model that can monetize prudently executed grid investment. The investment case is strongest when regulatory outcomes support recovery of capital and operating costs, and when wildfire and liability risks are managed in a way that preserves cash flow durability and credit resilience. The key determinant of equity performance is not competitive displacement, but the balance of (1) rate base growth and execution quality versus (2) regulatory friction and liability risk.


⚠ AI-generated — informational only. Validate using filings before investing.

📰 Market News & Coverage

15 Stories Available

Real-time institutional reporting and market updates for PCG.

prnewswire.com2026-07-31

Pacific Gas and Electric Company Announces Results of Cash Tender Offers

OAKLAND, Calif., July 31, 2026 /PRNewswire/ -- Pacific Gas and Electric Company (the "Company") today announced the results of its previously announced cash tender offers ( "Tender Offers") to purchase up to an aggregate principal amount that will not result in an aggregate purchase price that exceeds $1,200,000,000 (the "Aggregate Maximum Tender Amount") of its outstanding 3.30% Senior Notes due December 1, 2027 (the "3.30% Senior Notes") and 2.10% First Mortgage Bonds due August 1, 2027 (the "2.10% First Mortgage Bonds", and, together with the 3.30% Senior Notes, the "Bonds" and, each series, a "series of Bonds"), upon the terms and subject to the conditions set forth in the Offer to Purchase, dated July 27, 2026 (as amended by the press release dated July 27, 2026 regarding an upsize to the Aggregate Maximum Tender Amount, the "Offer to Purchase"), subject to the Acceptance Priority Levels as set forth in the Offer to Purchase.

prnewswire.com2026-07-31

Pacific Gas and Electric Company Announces Pricing Terms of Cash Tender Offers

OAKLAND, Calif., July 31, 2026 /PRNewswire/ -- Pacific Gas and Electric Company (the "Company") today announced the pricing terms of its previously announced cash tender offers ("Tender Offers") to purchase up to an aggregate principal amount that will not result in an aggregate purchase price that exceeds $1,200,000,000 (subject to increase or decrease by the Company, the "Aggregate Maximum Tender Amount") of its outstanding 3.30% Senior Notes due December 1, 2027 (the "3.30% Senior Notes") and 2.10% First Mortgage Bonds due August 1, 2027 (the "2.10% First Mortgage Bonds", and, together with the 3.30% Senior Notes, the "Bonds" and, each series, a "series of Bonds"), upon the terms and subject to the conditions set forth in the Offer to Purchase, dated July 27, 2026 (as amended by the press release dated July 27, 2026 regarding an upsize to the Aggregate Maximum Tender Amount, the "Offer to Purchase"), subject to the Acceptance Priority Levels as set forth in the Offer to Purchase.

prnewswire.com2026-07-29

PG&E Readies Electric System and Crews for Extended Heat and Elevated Wildfire Conditions

As PG&E meteorologists closely monitor an extended heat event, PG&E is sharing resources to help customers stay safe and prepared OAKLAND, Calif., July 29, 2026 /PRNewswire/ -- Pacific Gas and Electric Company (PG&E) is preparing for an extended heat event across inland parts of PG&E's service area, which is expected to begin July 31, and last through August 7, with the hottest temperatures forecast August 1 through August 3.

prnewswire.com2026-07-27

Pacific Gas and Electric Company Announces Upsizing of Cash Tender Offers

OAKLAND, Calif., July 27, 2026 /PRNewswire/ -- Pacific Gas and Electric Company (the "Company") today announced that it is increasing the Aggregate Maximum Tender Amount (as defined in the Offer to Purchase referred to below) for its previously announced cash tender offers ("Tender Offers") such that the aggregate purchase price for the Tender Offers will be increased from $1,000,000,000 to $1,200,000,000 of its outstanding 3.30% Senior Notes due December 1, 2027 (the "3.30% Senior Notes") and 2.10% First Mortgage Bonds due August 1, 2027 (the "2.10% First Mortgage Bonds" and, together with the 3.30% Senior Notes, the "Bonds" and, each series, a "series of Bonds"), subject to the order of priority (the "Acceptance Priority Levels" as set forth in the table in the Offer to Purchase).

prnewswire.com2026-07-27

Pacific Gas and Electric Company Announces Cash Tender Offers

OAKLAND, Calif., July 27, 2026 /PRNewswire/ -- Pacific Gas and Electric Company (the "Company") today announced the commencement of cash tender offers ("Tender Offers") to purchase up to an aggregate principal amount that will not result in an aggregate purchase price that exceeds $1,000,000,000 (subject to increase or decrease by the Company, the "Aggregate Maximum Tender Amount") of its outstanding 3.30% Senior Notes due December 1, 2027 (the "3.30% Senior Notes") and 2.10% First Mortgage Bonds due August 1, 2027 (the "2.10% First Mortgage Bonds" and, together with the 3.30% Senior Notes, the "Bonds" and, each series, a "series of Bonds"), subject to the order of priority (the "Acceptance Priority Levels" as set forth in the table below under "Acceptance Priority Level").

seekingalpha.com2026-07-27

PG&E: Better Earnings Visibility, But Valuation Is Still Cheap

PG&E Corporation is reiterated as a buy due to a growing data-center pipeline, extended capital plan, and continued undervaluation. PCG's $73 billion capital plan through 2030, with 9% annual rate-base growth and no equity dilution, underpins a 9%+ EPS growth outlook. Near-term earnings visibility is strong, with Q2 core EPS up to $0.40 and reaffirmed 2026 guidance of $1.64–$1.66 per share.

marketbeat.com2026-07-23

Pacific Gas & Electric Q2 Earnings Call Highlights

Pacific Gas & Electric NYSE: PCG reaffirmed its 2026 earnings guidance and longer-term financial plan on its second-quarter earnings call, while executives emphasized that California wildfire liability reform remains a critical factor for the utility's capital plans and path to investment-grade credit ratings.

seekingalpha.com2026-07-23

PG&E Corporation (PCG) Q2 2026 Earnings Call Transcript

PG&E Corporation (PCG) Q2 2026 Earnings Call Transcript

zacks.com2026-07-23

PG&E Q2 Earnings Surpass Estimates, Revenues Increase Y/Y

PCG beats Q2 earnings estimates as expanding data center demand and lower operating expenses help offset a revenue miss.

zacks.com2026-07-23

PG&E (PCG) Beats Q2 Earnings Estimates

PG&E (PCG) came out with quarterly earnings of $0.4 per share, beating the Zacks Consensus Estimate of $0.37 per share. This compares to earnings of $0.31 per share a year ago.

reuters.com2026-07-23

Utility PG&E beats quarterly profit estimates on higher rates

PG&E Corp on Thursday reported second-quarter profit that beat Wall Street estimates, driven by higher customer bills and a ​surge in power demand due to AI data ‌centers, though gains were partly offset by increased spending on wildfire safety.

wsj.com2026-07-23

PG&E Profit Rises from Lower Costs on Flat Revenue

PG&E recorded a profit of $761 million in the second quarter on flat revenue as its costs declined.

prnewswire.com2026-07-23

PG&E Corporation Reports Second Quarter 2026 Results; On Track to Deliver Solid 2026

OAKLAND, Calif., July 23, 2026 /PRNewswire/ -- PG&E Corporation (NYSE: PCG) is on track to deliver solid financial results in 2026.

247wallst.com2026-07-22

Billionaire Investor David Einhorn’s Top 5 Bets: Buy Alongside the Skeptic?

David Einhorn built his fortune betting against the crowd, and his latest 13F reveals five positions in corners of the market most investors refuse to touch. One signed acquisition is trading at a suspicious discount, and the rest carry catalysts Wall Street keeps ignoring.

prnewswire.com2026-07-20

California Climate Credit Brings Summer Bill Relief to PG&E Customers

$72 in Total Residential Electric Credits Applied Across August and September Bills OAKLAND, Calif., July 20, 2026 /PRNewswire/ -- Over the next two months, millions of residential Pacific Gas and Electric Company (PG&E) customers will see two California Climate Credits automatically applied to their summer energy bills.

📊 AI Financial Analysis

Powered by StockMarketInfo
Earnings Data: Q Ending 2026-06-30

"In PCG’s latest quarter (2026-06-30, Q2), revenue was $5.90B and net income was $761M (EPS $0.33). YoY, revenue rose to 2026 Q2 from 2025 Q2 by +0.07% ($5.902B vs. $5.898B) while net income increased +38.6% ($761M vs. $549M). QoQ, revenue declined -14.2% ($5.90B vs. $6.88B) but net income fell -14.0% ($761M vs. $885M). Profitability was strong: net profit margin edged up to 12.9% (from 12.9% QoQ and 9.3% YoY), and operating income margin was ~21.4%. Cash flow quality was mixed. Operating cash flow improved to $434M from $243M QoQ, but free cash flow remained sharply negative at -$2.53B due to heavy capex/PP&E investment (investments in PPE of -$2.97B). Balance-sheet resilience is relatively stable despite leverage: total assets increased to $145.1B, while equity was $34.2B and net debt was still very high (~$63.6B). Dividends paid were -$110M in the quarter with a low payout ratio (~14.5%). Total shareholder returns appear modest given the stock’s 1y change of +0.47% and low dividend yield (~0.30%), suggesting limited momentum support. Analyst consensus price target ($23.67) is below the current price ($17.26) only marginally in relative terms, but sentiment looks neutral-to-cautious."

Revenue Growth

Fair

Revenue was essentially flat YoY at +0.07% ($5.90B vs. $5.90B) but down QoQ by -14.2% ($5.90B vs. $6.88B), indicating a softer quarter rather than a clear growth acceleration.

Profitability

Positive

Net income increased +38.6% YoY (+$212M) with net margin improving to 12.9% (from 9.3% YoY). QoQ net income decreased -14.0%, but margins stayed around 21% operating and ~13% net, suggesting earnings power remained solid.

Cash Flow Quality

Caution

Operating cash flow was positive at $434M (up from $243M QoQ), but free cash flow was deeply negative at -$2.53B due to large PPE investment. Dividend outflow of -$110M was covered only partially by FCF and is better viewed alongside ongoing operating cash generation.

Leverage & Balance Sheet

Neutral

Leverage remains substantial: net debt ~ $63.6B and debt to equity ~1.91. However, equity is steady (~$34.2B) and total assets rose to ~$145.1B, indicating balance-sheet scale and some resilience despite high leverage.

Shareholder Returns

Caution

Price momentum is limited (1y_change +0.47%). Dividend yield is low (~0.30%) and dividends paid in Q2 were -$110M, so total return is likely dominated by fundamentals rather than capital appreciation.

Analyst Sentiment & Valuation

Neutral

Consensus price target is $23.67 versus a current price of $17.26, implying upside to target. Given muted 1-year stock performance, valuation support exists but sentiment appears not strongly bullish.

Disclaimer:This analysis is AI-generated for informational purposes only. Accuracy is not guaranteed and this does not constitute financial advice.

Fundamentals Overview

Loading fundamentals overview...

PG&E delivered Q2 and first-half core EPS of $0.40 and $0.83, respectively, reinforcing full-year core EPS guidance of $1.64–$1.66 (+10% vs 2025 at the midpoint). The company ties earnings durability to its “simple affordable model,” combining affordability targets (0%–3% bill growth) with disciplined O&M and continuous monitoring. Operational metrics highlighted include reliability up 23% YTD and continued wildfire safety progress (4th year of no major equipment-linked fires and zero structures destroyed). Capital funding remains centered on a $73B plan through 2030 without additional equity, supported by investment-grade progression and a 20% dividend payout by 2028. However, management repeatedly flags SB 254 phase 2 legislative reform as a gating item for financeability; inadequate or no action would trigger capital reallocation. Data-center load growth is a key offset, with pipeline now >12 GW and ~1.8 GW expected online by 2030 under rate-reducing pricing discipline.

AI IconGrowth Catalysts

  • Large load growth from data center pipeline; updated pipeline now over 12 GW (from >10 GW preapplication interest last quarter)
  • Cluster-study driven project qualification improvements (raised thresholds for preliminary/final engineering inclusion and requiring a signed work performance agreement with ~10% financial commitment)
  • Continuous monitoring helping operational execution (since Jan 2025: ~20M outage minutes avoided, 28 ignitions avoided, 5k+ emergency response hours saved, $11M+ lower cost repairs)

Business Development

  • CAISO collaboration to respond to FERC show-cause order; deadline referenced as next month
  • Data center customer pipeline projects progressing through cluster study and engineering stages; requirement for signed work performance agreements (~10% of overall project cost)

AI IconFinancial Highlights

  • Core EPS: $0.40 for Q2 2026; $0.83 for first half of 2026
  • First half core EPS $0.19 higher vs same point last year (prior-year dilution from Dec 2024 equity financing and CPUC cost of capital phase 2 decision in Oct 2024)
  • Full-year core EPS guidance reaffirmed: $1.64 to $1.66 (midpoint: +10% vs 2025)
  • Customer capital investment contributes $0.09 YoY to first-half earnings growth; O&M savings and redeployment contribute net $0.03
  • Targeted nonfuel O&M reductions: 2% to 4% annually (on track; delivery via thousands of O&M initiatives)
  • Reported credit trajectory: S&P upgraded rating post-Q1; now 1 notch below investment grade (citing wildfire risk mitigation progress)

AI IconCapital Funding

  • Capital plan: $73 billion through 2030 (unchanged); stated to not require additional equity financing
  • Equity funding: equity needs fully funded through 2030 (per financing plan discussion)
  • Dividend payout ratio target: 20% by 2028 vs implied 12% in 2026; hold at 20% through 2030
  • Financing activity: completed $2.2 billion utility bond issuance in June 2026; total utility debt financing for 2026 now $4.4 billion
  • FFO-to-debt target: mid-teens; emphasis on achieving investment-grade to reduce borrowing costs

AI IconStrategy & Ops

  • Lean operating system / simple affordable model: maintain annual customer bill growth at 0% to 3%
  • Pipeline categorization changes: raised inclusion thresholds for preliminary and final engineering stages; signed work performance agreement (~10% fee) now prerequisite to final engineering
  • Restated March pipeline numbers for comparability
  • Operational reliability: performance improved 23% YTD vs prior year due to fewer outages and faster restoration
  • Safety: extended safety performance on serious injuries/fatalities; zero public safety incidents from asset failures; 4th year of no major fires linked to PG&E equipment / no structures destroyed

AI IconMarket Outlook

  • Data center load expectation: management planning assumption of ~1.8 GW online by 2030 from the pipeline (potential upside if earlier direct-connect / faster speed-to-power projects enable more than 1.8 GW)
  • General Rate Case (GRC) milestone timing (as discussed in Q&A): reply briefs due tomorrow; proposed decision expected March 2027; final decision May 2027
  • Interim rate recovery: interim rate recovery effective January 2027 referenced (if approved) to smooth customer rates

AI IconRisks & Headwinds

  • Wildfire liability reform risk: management states needs a durable, financeable, predictable, affordable legislative framework (SB 254 phase 2 referenced); inadequate outcome triggers reevaluation/reallocation of capital priorities
  • Cost of inaction quantified: wildfire-related charges approx. $20 to $40 per month, up to 14% to 19% of monthly bills (from CEA study cited in Q&A)
  • Capital markets access dependency: investment grade and low-cost capital access emphasized as essential to affordability
  • Interconnection/regulatory uncertainty: FERC show-cause order and CAISO/FERC response could affect timelines and engineering processes (management expects improvements but not guaranteed)
  • O&M savings sustainability: 2% to 4% nonfuel O&M reduction target guided; management notes peers higher and implies ongoing opportunity but also indicates execution risk remains

Q&A: Analyst Interest

  • Wildfire legislation “plan/reallocation” threshold: Management said a durable, financeable, predictable, affordable framework is required to attract low-cost capital; “no case for no action.” If inaction or an insufficient solution occurs, they will reallocate capital priorities, without detailing amounts or specifics on the call.
  • GRC and rate-process interplay with affordability/pivot plans: Management stated the GRC would need integration if capital plan shifts, but it may not require additional filings or timing changes. They emphasized conservative assumptions, that FERC represents $20B of the $73B plan, and that compliance and first-order obligations remain primary.
  • Data center pipeline conversion, pricing rules, and timing: Management said pipeline quality depends on projects being rate-reducing and correctly priced; raised engineering-stage qualification requiring a signed WPA (~10% fee). They cannot predict which projects convert, but stated a planning assumption of ~1.8 GW online by 2030 and expect some upside from faster-connect projects.

Sentiment: CAUTIOUS

Note: This summary was synthesized by AI from the PCG Q2 2026 earnings transcript. Financial data is complex; please verify all metrics against official SEC filings before making investment decisions.

📋 Official Regulatory 10-K / 10-Q SEC Filings

Direct authenticated documentation links to audited SEC database reports for PCG.

SEC EDGAR Live Feed
Loading financial data and tables...
📁

SEC Filings (PCG)

© 2026 Stock Market Info — PG&E Corporation (PCG) Financial Profile