Regal Rexnord Corporation

Regal Rexnord Corporation (RRX) Market Cap

Regal Rexnord Corporation has a market capitalization of $13.61B.

Price: $204.40

-9.46 (-4.42%)

Market Cap: 13.61B

NYSE · time unavailable

CEO: Louis Vernon Pinkham

Sector: Industrials

Industry: Industrial - Machinery

IPO Date: 1980-03-17

Website: https://www.regalrexnord.com

Regal Rexnord Corporation (RRX) - Company Information

Market Cap: 13.61B|Sector: Industrials

Company Profile

Regal Rexnord Corporation, together with its subsidiaries, designs, manufactures, and sells industrial powertrain solutions, power transmission components, electric motors and electronic controls, air moving products, and specialty electrical components and systems worldwide. It operates through four segments: Commercial Systems, Industrial Systems, Climate Solutions, and Motion Control Solutions. The Commercial Systems segment provides AC and DC motors, electronic variable speed controls, fans, blowers, and precision stator and rotor kits. The Industrial Systems segment offers AC motors for industrial applications; electric alternators for prime and standby power applications to data centers, distributed energy, microgrid, rental marine, agriculture, healthcare, mobile, and defense markets; and switchgear for healthcare, government, and waste water applications, as well as residential, commercial, and industrial applications. The Climate Solutions segment provides fractional motors, electronic variable speed controls, and blowers for use in a residential and light commercial air moving applications; and fractional horsepower motors and blowers for white goods, water heating equipment, small pumps, compressors, and fans. The Motion Control Solutions segment offers bearings; conveyors; disc, gear, grid, elastomeric, and torsionally soft couplings; mechanical power transmission drives and components; worm gearing, shaft configuration, helical, bevel, helical bevel, worm, hypoid, and spur gearing products; and aerospace components. This segment serves beverage, bulk handling, metal, special machinery, energy, and aerospace and general industrial markets. The company sells its products directly to original equipment manufacturers and end-users through a network of direct and independent sales representatives, and distributors. The company was formerly known as Regal Beloit Corporation. The company was founded in 1955 and is headquartered in Beloit, Wisconsin.

Analyst Sentiment

83%
Strong Buy

From 10 Active Polls

1Y Forecast: $228.33

▲ +11.7% Potential Upside

Consensus Target Metrics

Low Bound

$160

Median

$234

High Bound

$265

Average

$228

Price & Moving Averages

Loading chart...

🎯 Wall Street Analyst Intelligence Report

1-Year structural target targets, chart projections, and sentiment maps.

Average 1Y Target
$228.33
▲ +11.71% Upside
Low Target
$160.00
-22% Risk
Median Target
$233.50
14% Mid
High Target
$265.00
30% Max
Consensus
Buy
14 / 22 Buys

Consensus Trend Projection

Trailing closures vs. 12-month metrics map.

Analyst Vote Distribution

Aggregate institutional coverage sentiment weights.

📊 Historical Valuation Multiples

Real-time Trailing Twelve Month (TTM) momentum side-by-side with discrete quarterly metrics.

Fiscal QuarterTTMQ1 2026Q4 2025Q3 2025Q2 2025Q1 2025Q4 2024Q3 2024Q2 2024
Period EndingTrailing 12MMar 31, 2026Dec 31, 2025Sep 30, 2025Jun 30, 2025Mar 31, 2025Dec 31, 2024Sep 30, 2024Jun 30, 2024
Market Cap ($M)13,60712,4539,3179,5249,6117,54810,27011,0148,790
Enterprise Value ($M)18,06816,91413,85114,05614,29512,69715,48416,37514,210
Price to Earnings Ratio (P/E)47.4348.4236.6829.9130.3432.9362.3237.8835.16
Price/Earnings-to-Growth Ratio (PEG)20.96497.265.52
Price to Sales Ratio (P/S)2.278.426.126.366.425.327.037.465.68
Price to Book Ratio (P/B)2.001.831.361.411.431.181.641.701.38
Price to Free Cash Flow Ratio (P/FCF)16.90-4981.1266.2754.7419.4988.2855.8487.7669.82
Enterprise Value to Sales (EV/Sales)11.449.099.399.558.9510.6011.089.18
Enterprise Value to EBITDA (EV/EBITDA)15.1961.1547.6545.6245.5743.8058.7653.1343.45
Debt to Equity Ratio3.750.710.740.730.750.850.900.900.93

RRX Growth Runway Model

Standard long term linear growth fade

Multi-Stage Discounted Cash Flow Sandbox

Market Price$204.40
Intrinsic Value$191.80
Market Alignment
Overvalued by 6.2%relative to calculated intrinsic value
9.00%
Exp: -0%-0%
i

Growth runway slowdown

This value provides a time window for the growth rate to decline beyond Stage 1 toward the terminal rate. Longer windows are most useful for companies with high growth starting conditions or strong competitive advantages. This option stretches out the growth rate slowdown across 5, 10, or 15-year steps. A high-growth starting condition (exceeding a 25% initial growth rate) automatically applies a curve decay to simulate realistic, rapid market saturation.
i

Terminal growth rate

With long-term inflation between 3-5%, revenue must grow by that baseline to maintain flat real-world market share. This value sets the permanent terminal growth rate to factor into the valuation beyond the growth slowdown runway toward maturity.

3-Stage Financial Runway Horizon

🧠 Perpetuity Horizon Engine (Stage 3: Post-2035)

Terminal FCF Base$1.17B
Perpetuity TV Value$21.96B
Discounted TV (PV)$9.28B
TV Weighting %57.7%
⚠️
Financial Model Disclaimer & Risk Disclosure: This interactive scenario simulator is an educational sandbox provided strictly for informational and analytical research purposes. Core historical financial statements and consensus estimates are sourced directly via Financial Modeling Prep (FMP). All downstream outputs are entirely deterministic, hypothetical projections generated by combining automated mathematical formulas (including linear interpolation and Gaussian bell-curve decay models) with user-selected variables and third-party financial data inputs. Users assume all liability for trading decisions executed based on these sandbox calculations.

📘 Full Research Report

ℹ️

AI-Generated Research: This report is for informational purposes only.

📘 REGAL REXNORD CORP (RRX) — Investment Overview

🧩 Business Model Overview

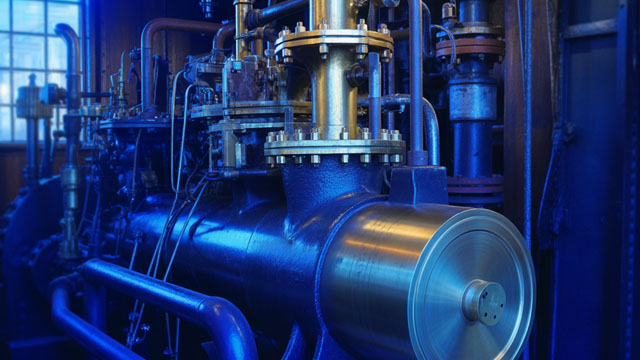
REGAL REXNORD designs and manufactures industrial components used in power transmission and motion across manufacturing, infrastructure, and energy-adjacent end markets. The value chain is characterized by engineering-to-application support (selection, sizing, and specification) followed by production of branded mechanical and electromechanical solutions, and then supply of replacement parts to sustain operating fleets.

A defining feature of the model is that customers rarely treat these components as commoditized inputs. Instead, they select parts based on performance requirements (torque, load ratings, efficiency, durability, and operating environment) and then qualify those parts in the context of the larger system. That qualification, engineering effort, and operational risk translate into customer stickiness and enable a meaningful aftermarket presence.

💰 Revenue Streams & Monetisation Model

Revenue is primarily driven by (1) OEM/project-based equipment demand and (2) aftermarket replacement and maintenance demand. Monetisation is supported by a mix of:

  • Branded engineered components (high specification products with application expertise),
  • Motion and power transmission solutions where performance and reliability drive pricing power,
  • Aftermarket parts supplied to installed equipment, which tends to be less discretionary than new-build demand.

Margin drivers typically include product mix toward engineered solutions, manufacturing efficiency, and the ability to sustain pricing relative to input cost inflation. Aftermarket share can help smooth earnings volatility by providing a recurring maintenance cadence tied to installed base utilization and replacement cycles.

🧠 Competitive Advantages & Market Positioning

RRX’s moat is best understood as a combination of Switching Costs (qualification and system integration), Cost/Performance Advantages (engineered reliability in demanding service), and Installed-Base Durability (aftermarket parts demand).

  • Switching Costs / Qualification Friction: Mechanical and motion components are embedded in industrial systems with safety and downtime constraints. Re-specification, testing, and re-qualification create friction for customers to change suppliers mid-cycle.
  • Performance-Driven Differentiation: Reliability in harsh operating conditions (load cycles, dust, vibration, temperature variation) supports pricing discipline versus purely price-led alternatives.
  • Installed Base & Aftermarket Support: A large installed base supports replacement parts demand, improving predictability and reinforcing customer relationships.

Competitive benchmarking: key competitors include:

  • Siemens (automation and drives ecosystems) — stronger in integrated automation and controls, with breadth across electrification and factory digitalization.
  • ABB (drives, electrification, industrial automation) — broad coverage with an emphasis on electrification and power/control technologies.
  • SKF and The Timken Company (bearings) — focused on rolling-element solutions where reliability and service life are central purchase criteria.

RRX’s industry focus centers on power transmission and motion components paired with application engineering and branded solutions for both OEM supply and aftermarket service. This positioning differs from Siemens/ABB’s more controls- and system-integration-led approach, and differs from SKF/Timken’s narrower emphasis on bearings. RRX competes by combining engineered product reliability with broad application coverage across industrial power pathways.

🚀 Multi-Year Growth Drivers

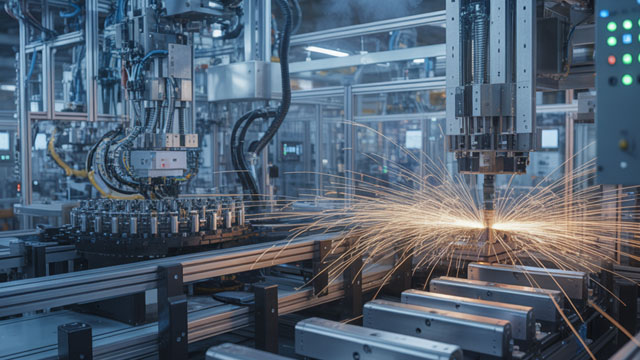
  • Electrification of industrial equipment: Many industrial upgrades migrate toward more efficient motors, drives, and transmission systems to reduce energy intensity.
  • Automation and modernization: Longer-lived industrial assets increasingly require components that integrate reliably into modernized equipment footprints, supporting demand for higher-spec motion and power solutions.
  • Maintenance and replacement tailwind: Global installed industrial bases drive aftermarket requirements for replacement parts and service-driven replenishment.
  • End-market resilience through diversification: A spread across manufacturing-related and infrastructure-facing applications can moderate single-industry capex cycles.
  • Aftermarket penetration: Scaling service/parts content and leveraging the installed base can support margin durability and earnings visibility.

Over a 5–10 year horizon, the most durable TAM expansion generally stems from efficiency and modernization requirements, plus the replacement economics of aging industrial fleets rather than solely from greenfield construction cycles.

⚠ Risk Factors to Monitor

  • Cyclicality in industrial production: OEM demand can compress during industrial downturns, affecting revenue and operating leverage.
  • Raw material and logistics volatility: Exposure to steel and other input costs can pressure margins without adequate pricing pass-through.
  • Competition and pricing pressure: Competitors with broader platform reach or capacity expansions can pressure pricing in specific categories.
  • Customer concentration and procurement behavior: Large OEMs may renegotiate pricing based on inventory and production schedules.
  • Execution risk from portfolio integration: Business combinations and operational restructuring require sustained cost discipline and product rationalization.
  • Quality and supply reliability: Component failures or supply disruptions can impair customer confidence and lead times, directly impacting revenue quality.

📊 Valuation & Market View

Equity valuation for industrial components companies often tracks EV/EBITDA and discounted cash flow expectations, with cyclical adjustments. The market typically rewards:

  • Operating margin sustainability through product mix and manufacturing discipline,
  • Aftermarket contribution that improves earnings resilience,
  • Cash conversion and working-capital management,
  • Organic growth supported by product engineering and installed-base service relationships.

Multiple compression risk tends to rise when the market anticipates a prolonged industrial slowdown, weaker aftermarket mix, or sustained input-cost disadvantage without offsetting pricing power.

🔍 Investment Takeaway

REGAL REXNORD’s long-term investment case rests on engineered differentiation that creates switching friction, reinforced by an installed-base and aftermarket model that supports stability through maintenance cycles. With demand linked to efficiency-driven industrial modernization and the economics of sustaining installed fleets, the core thesis emphasizes margin durability, disciplined execution, and aftermarket-led resilience rather than reliance on any single end-market upcycle.


⚠ AI-generated — informational only. Validate using filings before investing.

📰 Market News & Coverage

15 Stories Available

Real-time institutional reporting and market updates for RRX.

prnewswire.com2026-06-01

Regal Rexnord Names Mark Klossner EVP & President, Industrial Powertrain Solutions (IPS), Jerry Morton to Retire as EVP & President, IPS

MILWAUKEE, June 1, 2026 /PRNewswire/ -- Regal Rexnord Corporation (NYSE: RRX) today announced the appointment of Mark Klossner as Executive Vice President & President, Industrial Powertrain Solutions (IPS), effective immediately. He succeeds Jerry Morton, who will retire after 11 years with Regal Rexnord and a distinguished 39-year career in the power transmission business, which joined the company's portfolio when it was acquired from Emerson in 2015.

gurufocus.com2026-05-26

Is Regal Rexnord Corp (RRX) Overvalued After 4.5% Rally? GF Value Says Overvalued

On May 26, 2026, Regal Rexnord Corp (RRX) shares rose 4.5% today, reaching a current price of $209.85. Over the past 52 weeks, the stock has traded between $127

gurufocus.com2026-05-15

A Look at Regal Rexnord Corp (RRX) After 4.9% Decline -- GF Value $152.46 vs Price $197.16

On May 15, 2026, Regal Rexnord Corp (RRX) shares fell 4.9% today, closing at $197.16. The stock has experienced a notable 52-week range, with a high of $236.35

seekingalpha.com2026-05-08

Regal Rexnord Corporation (RRX) Presents at Oppenheimer 21st Annual Industrial Growth Virtual Conference Transcript

Regal Rexnord Corporation (RRX) Presents at Oppenheimer 21st Annual Industrial Growth Virtual Conference Transcript

seekingalpha.com2026-05-08

Diamond Hill Capital Management Mid Cap Strategy Q1 2026 Drivers And Decisions

Regal Rexnord outperformed in Q1 as the company reported strong orders for a new data center product, which should support solid revenue growth in 2027. Diamond Hill initiated a position in Antero Resources, a natural gas exploration and production company, to gain exposure given a constructive long-term outlook for US natural gas. Carrier Global is now a focused, high-quality business that Diamond Hill believes is in an excellent position to continue to gain market share and improve margins long-term.

seekingalpha.com2026-05-07

Regal Rexnord Corporation (RRX) Q1 2026 Earnings Call Transcript

Regal Rexnord Corporation (RRX) Q1 2026 Earnings Call Transcript

prnewswire.com2026-05-07

REGAL REXNORD ANNOUNCES PARTICIPATION AT UPCOMING CONFERENCE

MILWAUKEE, May 7, 2026 /PRNewswire/ -- Regal Rexnord Corporation (NYSE: RRX) announced today that on May 8, 2026 management will be participating in a fireside chat discussion and hosting investor meetings at the Oppenheimer 21st Annual Industrial Growth Conference, which is being held virtually. To listen to the live audio or a replay of the discussion, please visit Regal Rexnord's Investor website: https://investors.regalrexnord.com.

zacks.com2026-05-06

Regal Rexnord (RRX) Q1 Earnings: Taking a Look at Key Metrics Versus Estimates

Although the revenue and EPS for Regal Rexnord (RRX) give a sense of how its business performed in the quarter ended March 2026, it might be worth considering how some key metrics compare with Wall Street estimates and the year-ago numbers.

zacks.com2026-05-06

Regal Rexnord (RRX) Q1 Earnings and Revenues Top Estimates

Regal Rexnord (RRX) came out with quarterly earnings of $2.17 per share, beating the Zacks Consensus Estimate of $2.11 per share. This compares to earnings of $2.15 per share a year ago.

prnewswire.com2026-05-06

REGAL REXNORD REPORTS STRONG FIRST QUARTER 2026 FINANCIAL RESULTS

MILWAUKEE, May 6, 2026 /PRNewswire/ -- Regal Rexnord Corporation (NYSE: RRX) 1Q Highlights Daily Orders Up 8.5% Versus PY Backlog Up 6.7% Sequentially At The Enterprise Level And Up In All Segments AMC Orders Up Over 34% Versus PY On Broad-Based Growth, Up 28% Excluding Data Center IPS Orders Accelerated In Short Cycle Distribution And OEM, Net Of Headwinds In Long Cycle Projects Sales Of $1,479.1 Million, Up 4.3% Versus PY, Up 1.6% On An Organic Basis GAAP Net Income Of $64.3 Million Versus PY Of $57.5 Million, Up $6.8 Million Or 11.8% Versus PY Adjusted EBITDA Of $304.4 Million Versus PY Of $309.5 Million Diluted EPS Of $0.96, Up 11.6% Versus PY; Adjusted Diluted EPS Of $2.17, Up 0.9% Versus PY Re-Affirming 2026 Adjusted Earnings Per Share Guidance Announced Aamir Paul As Next Chief Executive Officer CEO Louis Pinkham commented, "Our growth outlook continued to strengthen during the first quarter, with enterprise daily orders up 8.5% versus the prior year. Our AMC segment led the way, with orders up over 34%, aided by growth across all markets, but particularly in aerospace & defense, discrete automation, data center and medical.

seekingalpha.com2026-05-04

Calamos Phineus Long/Short Fund: Q1 2026 Contributors And Detractors

L3Harris Technologies Inc. rallied as the Trump administration indicated a potential defense budget increase, which could drive meaningful upside to revenue and earnings estimates over the next few years. Regal Rexnord Corp. outperformed as its data center opportunity offered a new growth vector, with management disclosing substantial orders tied to its integrated powertrain solution for power infrastructure. CACI International Inc. management distinguished the firm by raising estimates throughout a period of government spending uncertainty, demonstrating minimal exposure to the budget cuts weighing on its peers.

gurufocus.com2026-04-30

A Look at Regal Rexnord Corp (RRX) After 5.5% Gain -- GF Value $151.18 vs Price $215.03

On April 30, 2026, Regal Rexnord Corp (RRX) shares rose 5.5% to a current price of $215.03. The stock has experienced significant movement over the past year, w

prnewswire.com2026-04-27

Regal Rexnord Corporation Declares Quarterly Dividend of $.35 per share

MILWAUKEE, April 27, 2026 /PRNewswire/ -- Louis Pinkham, Chief Executive Officer of Regal Rexnord Corporation (NYSE: RRX), announced that the Board of Directors, at its regular quarterly meeting held on April 27, 2026, declared a dividend of $0.35 per share. The dividend is payable on July 14, 2026, to shareholders of record at the close of business on June 30, 2026.

prnewswire.com2026-04-22

Regal Rexnord Corporation Announces Aamir Paul As Its Next Chief Executive Officer

MILWAUKEE, April 22, 2026 /PRNewswire/ -- Regal Rexnord Corporation (NYSE: RRX) announced today that its Board of Directors has appointed Aamir Paul to serve as Chief Executive Officer (CEO) commencing no later than July 1, 2026, upon the conclusion of his responsibilities with his current employer, Schneider Electric SE. The Board has also determined that Mr.

seekingalpha.com2026-04-20

Allspring Common Stock Fund: Q1 2026 Top Contributors And Detractors

Health care was the most significant detractor, led by weakness within life sciences tools and services, while consumer discretionary and IT also weighed on relative performance. Regal Rexnord Corp. performed strongly in the first quarter, primarily on account of a quarterly report that featured particularly strong orders owing to budding demand for data center products. Westlake Corp. outperformed in the first quarter due to the effects on global chemical markets from the conflict in Iran, which has had an extreme impact on supply.

📊 AI Financial Analysis

Powered by StockMarketInfo
Earnings Data: Q Ending 2026-03-31

"RRX reported Q1 2026 revenue of $1.48B and net income of $64.3M (EPS $0.97). On a YoY basis, revenue rose 4.3% ($1.48B vs. $1.42B in Q1 2025) while net income increased 12.0% ($64.3M vs. $57.5M). QoQ, revenue declined 2.8% (vs. $1.52B in Q4 2025) and net income was roughly flat (+1.3%). Profitability was mixed across the quarter: gross margin edged up slightly (37.2% vs. 37.5% QoQ; 37.2% vs. 37.7% YoY), while operating margin fell QoQ (10.3% vs. 11.1%) but was broadly similar YoY (10.3% vs. 11.7% on Q1’25). Net margin remained modest at 4.35%. Cash flow quality weakened materially. Operating cash flow dropped to $15.0M from $167.8M in Q4, driven by a large working-capital outflow (change in working capital of -$182.4M). Free cash flow was slightly negative (-$2.5M) versus strongly positive in Q4 ($140.6M). The company paid $23.3M in dividends, and buybacks were not reported. Shareholder returns appear strong given momentum: the stock is up 112.5% over the last year (1Y change >20%), boosting the total shareholder return profile despite the cash flow volatility. Analyst consensus targets ($228 vs. $205 current) imply limited upside."

Revenue Growth

Positive

YoY revenue growth of +4.3% in Q1 2026, but QoQ revenue declined -2.8% versus Q4 2025, suggesting a softer sequential trend.

Profitability

Neutral

Net income grew YoY (+12.0%), but margins were not consistently expanding: operating margin fell QoQ (10.3% vs. 11.1%) and was lower YoY (10.3% vs. 11.7% on Q1’25).

Cash Flow Quality

Caution

Operating cash flow fell sharply to $15.0M (from $167.8M QoQ) and free cash flow turned slightly negative (-$2.5M) due to a large working-capital outflow.

Leverage & Balance Sheet

Positive

Total assets eased slightly QoQ ($13.8B vs. $14.0B) and equity stayed stable (~$6.8B). Leverage appears manageable (net debt ~ $4.46B) with no liquidity stress evident from current ratio (~2.17).

Shareholder Returns

Strong

Strong capital appreciation: +112.5% 1Y price change. Dividend yield is low (~0.19%), and buybacks were not evident in the quarter.

Analyst Sentiment & Valuation

Fair

Consensus target ($228.33) is modestly above the $205.4 price; valuation remains rich per provided multiples (e.g., P/E ~48). Upside looks limited versus the momentum already realized.

Disclaimer:This analysis is AI-generated for informational purposes only. Accuracy is not guaranteed and this does not constitute financial advice.

Fundamentals Overview

Loading fundamentals overview...

RRX delivered a solid Q1: orders up 8.5% YoY and backlog up 6.7% QoQ, with AMC standing out (orders +34%) and IPS stabilizing modestly (sales +2.8% organic; OEM +~9%). However, profitability disappointed on pace: adjusted EBITDA margin was 20.6%, down 120 bps YoY, driven by AMC mix toward OEM vs aftermarket, software/project timing pressure, rare earth magnet constraints, and tariff price/cost timing. Management’s conservatism in 2026 guidance is explicitly mix-led, while the company believes the revenue and order trajectory could support the high end if short-cycle demand shifts toward aftermarket. Importantly, guidance excludes remaining cost synergies and does not embed potential ePOD shipments in 2026 or any IEEPA refunds (none received). Tariff outlook improved ($127M vs $155M unmitigated), and sequencing targets sequential margin improvement over the next three quarters, culminating in expected margin neutrality within AMC by year-end amid ongoing data center capacity build-out.

AI IconGrowth Catalysts

  • AMC orders up 34% YoY; strong momentum in data center, discrete automation, medical, and aerospace/defense
  • IPS short-cycle OEM and distribution orders rising (OEM up ~9%, distribution up low single digits), attributed to recovering U.S. industrial cycle and cross-sell/powertrain initiatives
  • PES residential HVAC sales stabilizing versus expectations; commercial HVAC growth in North America and Asia Pacific

Business Development

  • No explicit new named customer/partner/vendor disclosed; management highlighted ongoing customer discussions on future ePOD demand beyond 2027

AI IconFinancial Highlights

  • Q1 adjusted gross margin 37.7% (roughly flat YoY); adjusted EBITDA margin 20.6%, down 120 bps YoY
  • Q1 adjusted EPS $2.17 (up ~1% YoY) despite tariffs, rare earth magnet availability constraints, and inflation
  • Q1 sales up 4.3% reported; up 1.6% organic YoY
  • AMC Q1 adjusted EBITDA margin 18.2%, ~2 points below expectation due to mix (OEM versus aftermarket) and timing of deferred software/shipments into Q2
  • PES Q1 adjusted EBITDA margin 15.8%, up 160 bps YoY (mix benefit); orders down 60 bps daily YoY but exceeded expectations
  • Tariff estimate: unmitigated annual impact lowered to $127M from $155M; expects dollar-cost neutral by mid-2026 and margin neutral by end of year
  • EPS guidance range maintained at $10.20 to $11.00 for 2026; midpoint implies ~10% adjusted EPS growth

AI IconCapital Funding

  • Cash flow guidance for 2026 unchanged at $650M; Q1 adjusted free cash flow roughly flat with working-capital investments to support growing backlog
  • No buyback amount and no specific net debt/cash runway figures were provided in the transcript

AI IconStrategy & Ops

  • Shifting strategic emphasis to stronger growth: targeted investments in new product development, sales force, and e-commerce technologies
  • ePOD example cited as targeted product with >20% adjusted EBITDA margin and high volumes expected to contribute meaningfully later
  • Data center capacity expansion: Canada facility expansion already producing switchgear; Texas facility on track with material arriving and production expected by midyear; ERP up and running

AI IconMarket Outlook

  • 2026 sales growth guidance updated to ~4.5% (up 150 bps vs prior assumption) on improved end-market conditions
  • 2026 adjusted EBITDA margin forecast 22.2% (up 20 bps vs prior year) but modestly below prior guidance; midpoint margin commentary includes weaker short-cycle mix in AMC
  • AMC 2026 annual sales growth raised to high single digits from mid-single digits; AMC high-end adjusted EBITDA margin midpoint guided to ~20.5% (midpoint reduced due to OEM acceleration mix)
  • IPS 2026 annual sales growth raised to mid-single digits from low single digits; IPS midpoint adjusted EBITDA margin outlook down 50 bps due to stronger OEM growth mix headwind
  • PES 2026 sales growth guidance raised to flat to flat-to-low single digit; residential HVAC volume now assumed down mid-single digits vs high single digits previously
  • Q2 sequencing: AMC margins improve sequentially (less tariff price/cost pressure and slightly better mix); IPS sales/margins improve sequentially; PES sales and margins rise sequentially

AI IconRisks & Headwinds

  • Near-term mix headwind in AMC: OEM versus aftermarket weighting; management indicated conservatism driven primarily by mix (not order rates)
  • Tariff price/cost timing and uncertainty, including potential later-implemented Section 301 tariffs and complexity of possible IEEPA refunds (none received yet)
  • Rare earth magnet supply constraints and residual tariff/cost overhang affecting AMC/IPS margins (AMC rare earth headwind quantified; tariff price/cost timing off by ~50 bps vs expectation)
  • Residential HVAC is short-cycle; management remains measured despite signs of floor (risk of renewed volatility)

Q&A: Analyst Interest

  • Topic: Holistic conservatism in 2026 guidance (mix vs synergies/tariffs) and why upside exists if demand continues; Management's detailed response: Management said conservatism is primarily mix-driven, not order-rate weakness, with AMC shifting closer to OEM vs aftermarket. They emphasized guidance includes neither remaining cost synergies nor potential ePOD shipments in 2026, and IEEPA refunds are not embedded because none have been received yet; upside could come from higher aftermarket mix and/or timing of these events.
  • Topic: Data center cadence, ePOD funnel visibility, and manufacturing build-out milestones; Management's detailed response: Management confirmed Canada expansion is already producing switchgear, and Texas facility production is targeted by midyear with ERP operational and materials arriving. For data center, 2025 was ~$120M; 2026 is ~$180M (no ePOD). For 2027 they described switchgear ~$240M plus ePOD additive ~$700M (total ~$900M+). No new funnel update beyond stabilized win rates; customers expect growth beyond 2027.
  • Topic: AMC margin bridge—rare earth, OEM/aftermarket mix, software timing, and tariff price/cost timing; Management's detailed response: Management quantified roughly 30 bps rare earth headwind, ~100+ bps mix impact on EBITDA from short-cycle OEM weighting vs aftermarket, and ~50 bps from automation software shipment timing slipping into Q2. An additional ~50 bps relates to tariff price/cost timing being off versus plan, expected to resolve through Q2; they expect AMC to be margin-neutral by year-end.

Sentiment: MIXED

Note: This summary was synthesized by AI from the RRX Q1 2026 earnings transcript. Financial data is complex; please verify all metrics against official SEC filings before making investment decisions.

📋 Official Regulatory 10-K / 10-Q SEC Filings

Direct authenticated documentation links to audited SEC database reports for RRX.

SEC EDGAR Live Feed
Loading financial data and tables...
📁

SEC Filings (RRX)

© 2026 Stock Market Info — Regal Rexnord Corporation (RRX) Financial Profile