Safe Bulkers, Inc.

Safe Bulkers, Inc. (SB) Market Cap

Safe Bulkers, Inc. has a market capitalization of $664.6M.

Price: $6.50

0.10 (1.56%)

Market Cap: 664.59M

NYSE · time unavailable

CEO: Polys Hajioannou

Sector: Industrials

Industry: Marine Shipping

IPO Date: 2008-05-30

Website: https://www.safebulkers.com

Safe Bulkers, Inc. (SB) - Company Information

Market Cap: 664.59M|Sector: Industrials

Company Profile

Safe Bulkers, Inc., together with its subsidiaries, provides marine drybulk transportation services. It owns and operates drybulk vessels for transporting bulk cargoes primarily coal, grain, and iron ore. As of March 18, 2022, the company had a fleet of 40 drybulk vessels having an average age of 10.4 years; and an aggregate carrying capacity of 3,925,500 deadweight tons. Its fleet consisted of 12 Panamax class vessels, 7 Kamsarmax class vessels, 15 post- Panamax class vessels, and 6 Capesize class vessels. Safe Bulkers, Inc. was incorporated in 2007 and is based in Monaco.

Analyst Sentiment

52%
Hold

From 2 Active Polls

1Y Forecast: $4.20

▼ -35.4% Potential Upside

Consensus Target Metrics

Low Bound

$4

Median

$4

High Bound

$4

Average

$4

Price & Moving Averages

Loading chart...

🎯 Wall Street Analyst Intelligence Report

1-Year structural target targets, chart projections, and sentiment maps.

Average 1Y Target
$4.20
▼ -35.38% Upside
Low Target
$4.20
-35% Risk
Median Target
$4.20
-35% Mid
High Target
$4.20
-35% Max
Consensus
Buy
14 / 22 Buys

Consensus Trend Projection

Trailing closures vs. 12-month metrics map.

Analyst Vote Distribution

Aggregate institutional coverage sentiment weights.

📊 Historical Valuation Multiples

Real-time Trailing Twelve Month (TTM) momentum side-by-side with discrete quarterly metrics.

Fiscal QuarterTTMQ4 2025Q3 2025Q2 2025Q1 2025Q4 2024Q3 2024Q2 2024Q1 2024
Period EndingTrailing 12MDec 31, 2025Sep 30, 2025Jun 30, 2025Mar 31, 2025Dec 31, 2024Sep 30, 2024Jun 30, 2024Mar 31, 2024
Market Cap ($M)665493454370388380553630542
Enterprise Value ($M)1,0528808558057878329581,049989
Price to Earnings Ratio (P/E)17.2510.426.3954.4713.384.905.505.715.36
Price/Earnings-to-Growth Ratio (PEG)0.5725.09
Price to Sales Ratio (P/S)2.416.806.225.636.025.317.288.026.64
Price to Book Ratio (P/B)0.800.590.550.450.470.460.670.780.69
Price to Free Cash Flow Ratio (P/FCF)9.6222.6019.3712.97-26.3322301.9915.7515.10
Enterprise Value to Sales (EV/Sales)12.1311.7012.2512.2311.6412.6113.3512.10
Enterprise Value to EBITDA (EV/EBITDA)7.9525.0820.6631.6525.9819.3019.8520.9320.19
Debt to Equity Ratio2.930.650.620.680.630.650.590.610.67

SB Growth Runway Model

Standard long term linear growth fade

Multi-Stage Discounted Cash Flow Sandbox

Market Price$6.50
Intrinsic Value$6.49
Market Alignment
Overvalued by 0.1%relative to calculated intrinsic value
9.00%
Exp: -4%-4%
i

Growth runway slowdown

This value provides a time window for the growth rate to decline beyond Stage 1 toward the terminal rate. Longer windows are most useful for companies with high growth starting conditions or strong competitive advantages. This option stretches out the growth rate slowdown across 5, 10, or 15-year steps. A high-growth starting condition (exceeding a 25% initial growth rate) automatically applies a curve decay to simulate realistic, rapid market saturation.
i

Terminal growth rate

With long-term inflation between 3-5%, revenue must grow by that baseline to maintain flat real-world market share. This value sets the permanent terminal growth rate to factor into the valuation beyond the growth slowdown runway toward maturity.

3-Stage Financial Runway Horizon

🧠 Perpetuity Horizon Engine (Stage 3: Post-2035)

Terminal FCF Base$0.04B
Perpetuity TV Value$0.75B
Discounted TV (PV)$0.32B
TV Weighting %55.1%
⚠️
Financial Model Disclaimer & Risk Disclosure: This interactive scenario simulator is an educational sandbox provided strictly for informational and analytical research purposes. Core historical financial statements and consensus estimates are sourced directly via Financial Modeling Prep (FMP). All downstream outputs are entirely deterministic, hypothetical projections generated by combining automated mathematical formulas (including linear interpolation and Gaussian bell-curve decay models) with user-selected variables and third-party financial data inputs. Users assume all liability for trading decisions executed based on these sandbox calculations.

📘 Full Research Report

ℹ️

AI-Generated Research: This report is for informational purposes only.

📘 SAFE BULKERS INC (SB) — Investment Overview

🧩 Business Model Overview

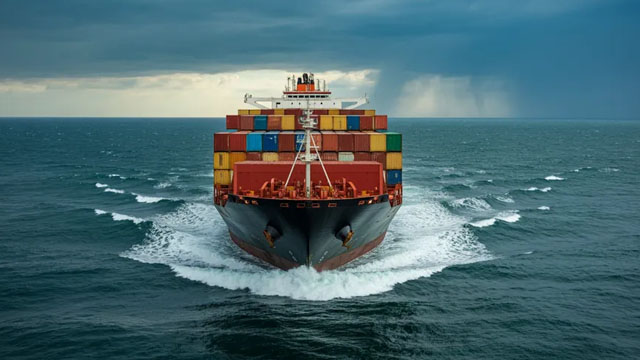
SAFE BULKERS is a dry-bulk shipping operator. The company earns revenue by transporting commodities such as iron ore, coal, and grain across global trade lanes using its owned and/or chartered fleet. In practice, revenue generation depends on (1) vessel availability and operational performance, (2) the contractual structure of employment (time charters vs. spot/short-term arrangements), and (3) the prevailing demand-supply balance for tonnage on relevant routes.

The value chain runs from vessel deployment (acquiring and maintaining capable tonnage) to commercial execution (securing cargo employment through brokers and charterers) and ultimately to asset monetization (earning freight or charter hire and preserving vessel earning power through maintenance and fleet renewal discipline).

💰 Revenue Streams & Monetisation Model

Dry-bulk shipping revenue is primarily charter hire, earned either on:

  • Time charters: contracted revenue visibility for a defined period, typically reducing earnings volatility.
  • Spot or short-term charters: higher upside potential when market conditions strengthen, but with greater volatility.

Margin drivers are dominated by:

  • Freight/charter rates vs. operating costs (crew, maintenance, insurance, voyage costs, and overhead).
  • Utilization (days in service and trading efficiency).
  • Fleet technical quality (fuel efficiency, downtime, and ability to meet counterparty requirements).
  • Contract mix: a higher share of time charters generally stabilizes cash flows through-cycle.

Because this is a capital-intensive industry, profitability also depends on fleet ownership economics: vessel impairments, residual value risk, and the cost of sustaining or upgrading the fleet.

🧠 Competitive Advantages & Market Positioning

Shipping is cyclical and entry barriers are imperfect; however, relative cost and execution advantages can persist through cycles. For SAFE BULKERS, the most relevant “moat-like” factors are:

  • Cost Advantage via Fleet Efficiency and Operating Discipline: lower per-day cash operating costs and fewer off-hire days can translate into better earnings capture in weaker freight periods.
  • Scale and Management Capabilities: a larger and more strategically managed fleet portfolio can improve employment flexibility, reduce operational variability, and enhance negotiating leverage with charter counterparties.
  • Commercial Relationships and Contracting Track Record: while not a software-style lock-in, repeated engagements and reputation can support employment access when markets tighten.

Competitive benchmarking (dry bulk peers):

  • Star Bulk Carriers (SBLK): similarly focused on dry bulk, with portfolio composition spanning major bulk vessel classes; competitive posture often hinges on fleet age, operating costs, and contracting strategy.
  • Eagle Bulk Shipping (EGLE): dry bulk operator with commercial emphasis on securing employment; competitive differentiation is frequently tied to fleet technical performance and employment quality.
  • Navios Maritime Partners / Navios Maritime (NMM-related entities): dry bulk exposure with a different fleet mix across vessel types; performance is influenced by asset utilization, financing structure, and charter coverage.

Industry focus contrast: SAFE BULKERS’ positioning is anchored in dry-bulk shipping rather than adjacent segments (tankers/containerships). Within dry bulk, competitiveness typically depends less on brand and more on vessel class suitability to demand centers, operating cost per day, and the ability to manage fleet renewal and regulatory compliance.

🚀 Multi-Year Growth Drivers

Over a 5–10 year horizon, growth and value creation are primarily driven by the interaction of global commodity demand and effective fleet supply:

  • Secular expansion of seaborne dry-bulk trade: demand for iron ore, coal, and agricultural commodities supports ton-mile consumption as economies industrialize and food demand grows.
  • Fleet aging and renewal dynamics: sustained scrapping and slower delivery pipelines can tighten effective supply, supporting higher average utilization and rate environments.
  • Regulatory-driven supply constraints: emissions standards and related retrofits can reduce available capacity or raise costs, favoring operators with disciplined capex planning and modernizing fleets.
  • Route and vessel-type fit: optimized vessel deployment across demand geographies can improve earnings capture versus peers with less flexible fleet composition.

In this industry, long-term outperformance is less about linear demand growth and more about earning a favorable share of the shipping cycle through cost control, contract mix, and fleet strategy.

⚠ Risk Factors to Monitor

  • Freight-rate cyclicality: dry bulk earnings can decline sharply when global fleet supply outpaces demand, compressing cash generation.
  • Capital intensity and refinancing risk: vessel capex, maintenance, and potential regulatory retrofits can strain liquidity, particularly if debt markets tighten.
  • Regulatory compliance risk: emissions rules can increase operating costs, require upgrades, or impair utilization if vessels fail to meet technical standards demanded by charterers.
  • Fuel and operating cost volatility: voyage costs, insurance, crewing expenses, and parts/maintenance inflation can affect margins.
  • Counterparty and credit risk: charter employment depends on charterer credit quality and contract performance.
  • Asset value and residual risk: weak markets can reduce vessel resale values, increasing impairment or limiting refinancing options.

📊 Valuation & Market View

Markets typically value dry bulk shipping using asset and earnings power frameworks that reflect high cyclicality. Common approaches include:

  • EV/EBITDA and cash flow metrics (with the understanding that earnings move with the cycle).
  • Price-to-book / NAV concepts, anchored to fleet replacement values and expected residual performance.
  • Multiples influenced by fleet quality (age, efficiency, compliance readiness) and by the mix of time charter coverage versus spot exposure.

Key valuation drivers are therefore structural: sustained operating-cost leadership, disciplined leverage, robust liquidity to fund maintenance and compliance, and an employment strategy that improves earnings capture across cycle states.

🔍 Investment Takeaway

SAFE BULKERS’ long-term investment case rests on achieving relative cost efficiency, maintaining fleet operational readiness, and navigating regulatory and refinancing requirements without compromising balance-sheet resilience. In a cyclical market, the most durable advantage is typically not contractual lock-in, but repeatable execution—lower off-hire, competitive operating economics, and disciplined fleet strategy—that allows the company to convert shipping cycle conditions into stronger risk-adjusted returns.


⚠ AI-generated — informational only. Validate using filings before investing.

📰 Market News & Coverage

15 Stories Available

Real-time institutional reporting and market updates for SB.

globenewswire.com2026-05-29

Safe Bulkers, Inc. Announces Availability of 2025 Sustainability Report

MONACO, May 29, 2026 (GLOBE NEWSWIRE) -- Safe Bulkers, Inc. (the “Company”) (NYSE: SB), an international provider of marine drybulk transportation services, announced today that the Company's 2025 Sustainability Report is available for download and can be accessed from its website using the link provided below.

globenewswire.com2026-05-29

Safe Bulkers, Inc. Announces Availability of 2025 Sustainability Report

MONACO, May 29, 2026 (GLOBE NEWSWIRE) -- Safe Bulkers, Inc. (the "Company") (NYSE: SB), an international provider of marine drybulk transportation services, announced today that the Company's 2025 Sustainability Report is available for download and can be accessed from its website using the link provided below.

globenewswire.com2026-05-27

Safe Bulkers, Inc. Publishes Prospectus Relating to the Admission to Trading and Listing on Euronext Athens

MONACO, May 27, 2026 (GLOBE NEWSWIRE) -- Safe Bulkers, Inc. (the "Company") (NYSE: SB), an international provider of marine drybulk transportation services, is pleased to announce that following ascertainment by Euronext Athens of the fulfilment of all listing requirements for a dual listing of Safe Bulkers' shares of common stock on the Main Market of Euronext Athens on May 26, 2026, the Board of Directors of the Hellenic Capital Market Commission has approved today the Company's prospectus for the admission to trading all of the Company's issued shares of common stock (i.

globenewswire.com2026-05-27

Safe Bulkers, Inc. Publishes Prospectus Relating to the Admission to Trading and Listing on Euronext Athens

MONACO, May 27, 2026 (GLOBE NEWSWIRE) -- Safe Bulkers, Inc. (the “Company”) (NYSE: SB), an international provider of marine drybulk transportation services, is pleased to announce that following ascertainment by Euronext Athens of the fulfilment of all listing requirements for a dual listing of Safe Bulkers' shares of common stock on the Main Market of Euronext Athens on May 26, 2026, the Board of Directors of the Hellenic Capital Market Commission has approved today the Company's prospectus for the admission to trading all of the Company's issued shares of common stock (i.e., all 101,826,580 dematerialized, registered voting shares of common stock, each with a par value of $0.001, issued by the Company) on the Main Market of the Regulated Securities Market of Euronext Athens. The listing prospectus is available on the Company's website at www.safebulkers.com/Euronextathens. The Company is not issuing any additional shares of common stock pursuant to the listing prospectus.

globenewswire.com2026-05-26

Safe Bulkers, Inc. Dual Listing on the Main Market of Euronext Athens Stock Exchange

MONACO, May 26, 2026 (GLOBE NEWSWIRE) -- Safe Bulkers, Inc. (the “Company”) (NYSE: SB), an international provider of marine drybulk transportation services, is pleased to announce today that, following today's session of its Listings and Market Operations Committee, Euronext Athens has confirmed that all listing requirements for a dual listing of Safe Bulkers' shares of common stock (ISIN code: MHY7388L1039) on the Main Market of Euronext are met, in accordance with Article 2, paragraph 4 of Law 3371/2005, subject to approval of a prospectus by the Hellenic Capital Markets Commission (the “HCMC”).

globenewswire.com2026-05-18

Safe Bulkers, Inc. Announces Sale of a 2006-Built Post-Panamax Class and of a 2008-Kamsarmax Class Dry-bulk Vessels

MONACO, May 18, 2026 (GLOBE NEWSWIRE) -- Safe Bulkers, Inc. (the "Company") (NYSE: SB), an international provider of marine dry bulk transportation services, announced today that it has entered into agreements for the sale of two vessels: MV Xenia, a 2006 Japanese-built Post-Panamax dry bulk vessel, for a gross sale price of $13.

globenewswire.com2026-05-18

Safe Bulkers, Inc. Announces Sale of a 2006-Built Post-Panamax Class and of a 2008-Kamsarmax Class Dry-bulk Vessels

MONACO, May 18, 2026 (GLOBE NEWSWIRE) -- Safe Bulkers, Inc. (the “Company”) (NYSE: SB), an international provider of marine dry bulk transportation services, announced today that it has entered into agreements for the sale of two vessels: MV Xenia, a 2006 Japanese-built Post-Panamax dry bulk vessel, for a gross sale price of $13.0 million, and MV Pedhoulas Commander, a 2008 Japanese-built Kamsarmax dry bulk vessel, for a gross sale price of $14.7 million. Both vessels are expected to be delivered to their new owners with their scheduled dry-dockings due, upon completion of their current voyages.

globenewswire.com2026-05-11

Safe Bulkers, Inc. Announces Recapitulation Agreements for the Acquisition of Four Newbuild Dry-bulk Vessels

MONACO, May 11, 2026 (GLOBE NEWSWIRE) -- Safe Bulkers, Inc. (the “Company") (NYSE: SB), an international provider of marine dry bulk transportation services, announced today that it has entered into recapitulation agreements for the acquisition of four Japanese newbuild dry bulk vessels. The three newbuild vessels are 82,000 dwt, Kamsarmax class, with scheduled delivery dates of two in the first half and one in the third quarter of 2029. One newbuild vessel is a 182,000 dwt Capesize class, with scheduled delivery date in the second half of 2029.

globenewswire.com2026-04-15

Safe Bulkers Announces Appointments to the Board of Directors

MONACO, April 15, 2026 (GLOBE NEWSWIRE) -- Safe Bulkers, Inc. (the Company) (NYSE: SB), an international provider of marine drybulk transportation services, announced today that on the recommendation of the Corporate Governance, Nominating and Compensation Committee, the Board of Directors of the Company (the “Board”) voted to expand the size of the Board from nine to eleven directors and to appoint Jeffrey Bunzel and Vassilis Hajioannou to fill the new positions, with immediate effect. The Board has determined that Mr. Bunzel is independent for the purposes of NYSE independence standards and has appointed Mr. Bunzel to serve on the Corporate Governance, Nominating and Compensation Committee, the Environmental, Social and Corporate Governance Committee and the Audit Committee.

seekingalpha.com2026-04-10

Safe Bulkers: Steady Execution, But The Easy Upside Looks Gone

Safe Bulkers, Inc. has surged YoY, driven by a modernized fleet and strong tailwinds in the dry bulk market. SB's young, compliance-ready fleet and balanced chartering strategy provide commercial advantages and cash flow resilience. Despite operational strengths, SB stock now trades near historical P/B peaks, compressing its dividend yield to a five-year low of 3%.

defenseworld.net2026-04-08

Safe Bulkers (NYSE:SB) Share Price Passes Above Two Hundred Day Moving Average – Should You Sell?

Safe Bulkers, Inc (NYSE: SB - Get Free Report)'s stock price crossed above its two hundred day moving average during trading on Tuesday. The stock has a two hundred day moving average of $5.29 and traded as high as $6.57. Safe Bulkers shares last traded at $6.4760, with a volume of 535,378 shares. Analyst Ratings

globenewswire.com2026-04-02

Safe Bulkers, Inc. Declares Quarterly Dividend on its 8.00% Series C Cumulative Redeemable Perpetual Preferred Shares; 8.00% Series D Cumulative Redeemable Perpetual Preferred Shares

MONACO, April 02, 2026 (GLOBE NEWSWIRE) -- Safe Bulkers, Inc. (the “Company”) (NYSE: SB), an international provider of marine drybulk transportation services, announced today that the Company's Board of Directors has declared:

defenseworld.net2026-04-02

Safe Bulkers, Inc (NYSE:SB) Sees Large Growth in Short Interest

Safe Bulkers, Inc (NYSE: SB - Get Free Report) was the target of a significant increase in short interest during the month of March. As of March 13th, there was short interest totaling 1,789,089 shares, an increase of 20.6% from the February 26th total of 1,484,027 shares. Approximately 2.9% of the company's stock are sold short.

globenewswire.com2026-03-04

Safe Bulkers Announces Filing of 2025 Annual Report on Form 20-F

MONACO, March 04, 2026 (GLOBE NEWSWIRE) -- Safe Bulkers, Inc. (“Safe Bulkers”) (NYSE: SB), an international provider of marine drybulk transportation services, announced today that it has filed its 2025 Annual Report on Form 20-F with the U.S. Securities and Exchange Commission (the “SEC”).

globenewswire.com2026-03-03

Safe Bulkers to Participate in Capital Link's 20th Annual International Shipping Forum in New York

MONACO, March 03, 2026 (GLOBE NEWSWIRE) -- Safe Bulkers, Inc. (the “Company”) (NYSE: SB), an international provider of marine drybulk transportation services, announced its participation in Capital Link's 20th Annual International Shipping Forum, to be held on Monday, March 9, 2026, at the Metropolitan Club in New York City. The forum brings together senior executives from leading shipping companies, institutional investors, analysts, and financial media to discuss developments in global shipping markets, capital market conditions, and industry outlook.

📊 AI Financial Analysis

Powered by StockMarketInfo
Earnings Data: Q Ending 2025-12-31

"SB reported revenue of $72.6M for the year 2025, with a net income of $11.8M, reflecting a healthy net income margin. The earnings per share (EPS) is $0.0961, indicating positive profitability. SB generated $20.1M in operating cash flow and maintained a free cash flow of the same amount, highlighting solid cash generation without capital expenditure requirements. The company has total assets of $1.4B against total liabilities of $572.5M, leading to strong equity of $830.7M. With net debt of $387M, SB exhibits a manageable leverage profile. Shareholder returns are beginning to materialize with regular dividends of $0.05 planned for the upcoming quarters, although no buybacks have been noted. SB's stock price has appreciated significantly, with an impressive 68.53% increase over the last year, positioning it favorably for shareholders. Overall, SB demonstrates promising growth potential and a sound financial footing."

Revenue Growth

Good

Strong revenue growth indicated by a healthy total revenue of $72.6M.

Profitability

Positive

Net income of $11.8M signifies positive profitability.

Cash Flow Quality

Good

Stable operating cash flow of $20.1M with consistent free cash flow.

Leverage & Balance Sheet

Positive

Strong balance sheet with total equity of $830.7M and manageable debt levels.

Shareholder Returns

Positive

Regular dividend payments initiated, enhancing shareholder returns.

Analyst Sentiment & Valuation

Good

Positive sentiment bolstered by strong price performance and defined price targets.

Disclaimer:This analysis is AI-generated for informational purposes only. Accuracy is not guaranteed and this does not constitute financial advice.

Fundamentals Overview

Loading fundamentals overview...

Management highlighted a healthier freight backdrop—Q4 strength and “healthy” early 2026—plus meaningful contracted revenue visibility via 7 Capes chartered at ~$24,000/day (avg 1.8 years) for >$130m backlog. They also reiterated capital flexibility (cash/RCF ~$385m total) and a $0.05/share dividend. However, the Q&A pressure points were operational and time-visibility constraints: management said there is no appetite for 2–3 year charters yet, expecting longer duration coverage only after sustained strength over “2 or 3 quarters.” On renewal, they admitted a hard market constraint—lack of quality secondhand tonnage available for sale (especially Japan-built/Chinese-built)—forcing reliance on shipyards that are booked for 2028, pushing deliveries to 2029. While management’s tone is confident on near-term improvement, the analyst-facing answers show limits to locking in longer coverage and to securing replacement tonnage quickly.

AI IconGrowth Catalysts

  • Freight market strength in Q4 2025 and “healthy” early 2026
  • Contracted Capesize backlog: 7 Capes chartered with avg remaining duration of 1.8 years and avg daily hire of ~$24,000 (implied contracted revenue backlog >$130m from Capes alone)
  • Fleet renewal supported by taking delivery of remaining order book (8 Phase II vessels) to compete on fuel efficiency/longer term

Business Development

  • Period/time-charter program: 7 Capesize vessels chartered (avg $24,000/day; avg 1.8 years remaining)
  • Charter appetite currently focused on 6–12 month terms (1-year deals approaching ~$18,000–$19,000/day for relevant vessel categories)

AI IconFinancial Highlights

  • Adjusted EBITDA: $37.4m in Q4 2025 vs $40.7m in Q4 2024
  • Adjusted EPS: $0.14 in Q4 2025 (transcript also references $0.15 in Q4 2024)
  • Dividend declared: $0.05 per common share
  • Daily vessel operating expenses (OpEx): +13% to $5,686/day in Q4 2025 vs $5,047/day in Q4 2024
  • Daily vessel OpEx excluding write-off/delivery expenses: +6% to $557/day in Q4 2025 vs $4,787/day in Q4 2024 (transcript appears internally inconsistent on the comparator figure; direction is still +6%)
  • Liquidity/cash: ~$167m as of Feb 13, 2026 plus ~$218m undrawn revolving credit facilities (total liquidity/capital resources ~$385m), plus contracted revenue of ~$178m

AI IconCapital Funding

  • Common dividends paid/declared: $0.05 per common share (amounts referenced elsewhere in transcript: $89m and $75m; Q4 declaration explicitly given as $0.05/share)
  • Cash on hand: ~€163m cash cited in presentation section (also later reiterated as ~$167m as of Feb 13, 2026)
  • Undrawn RCF: ~€220m cited (also reiterated as ~$218m)
  • Capital flexibility also referenced via “$182m borrowing capacity” (presentation section) and contracted revenue ~$178m

AI IconStrategy & Ops

  • Fleet renewal constrained by lack of quality secondhand tonnage (especially Japan-built and even Chinese built) available for sale
  • Operational renewal approach: look to shipyards because the secondary market lacks quality tonnage; shipyards largely booked for 2028, forcing deliveries into 2029
  • Renewal/fleet positioning emphasizes Japanese-built fleet (stated: ~80% Japanese built vs global ~40%) and fuel efficiency improvements (CII-related positioning discussed)

AI IconMarket Outlook

  • CAPE period/time charter visibility: $130m+ contracted revenue backlog from Capes alone (based on 7 charters)
  • Commentary: momentum “gather pace” with better freight rates; charters can “take 12-month” period charters now
  • Longer-term (2–3 year) contracts require more visibility; only expected after sustained strength over “2 or 3 quarters”

AI IconRisks & Headwinds

  • Secondary market hurdle: “lack of quality tonnage in secondhand market” available for sale (Japan-built and even Chinese-built) constraining renewal flexibility
  • Shipyard scheduling risk: many shipyards fully booked for 2028, with deliveries needing to move to 2029
  • Term-structure risk: “no interest for 2- or 3-year contracts” at present; market currently supports mainly 6–12 month coverage
  • Tariff/macro headwind acknowledged historically: analyst noted tariffs; management stated the prior year’s difficulty was tied to tariffs that started from September 2024 and “ended” around July 2025 (management mitigation: tariff-related issues were settling within a few countries, with market improving from second half of 2025)

Sentiment: MIXED

Note: This summary was synthesized by AI from the SB Q4 2025 earnings transcript. Financial data is complex; please verify all metrics against official SEC filings before making investment decisions.

📋 Official Regulatory 10-K / 10-Q SEC Filings

Direct authenticated documentation links to audited SEC database reports for SB.

SEC EDGAR Live Feed
No recent 10-K available.
No recent 10-Q available.
Loading financial data and tables...
📁

SEC Filings (SB)

© 2026 Stock Market Info — Safe Bulkers, Inc. (SB) Financial Profile