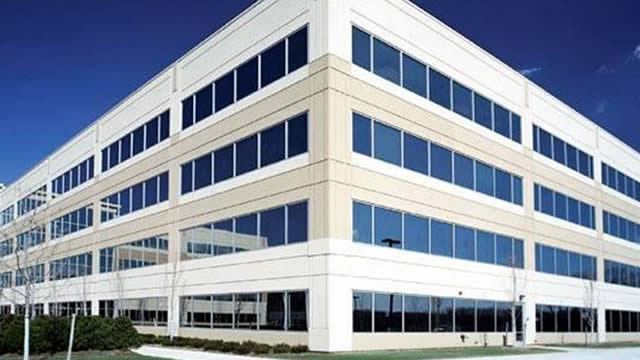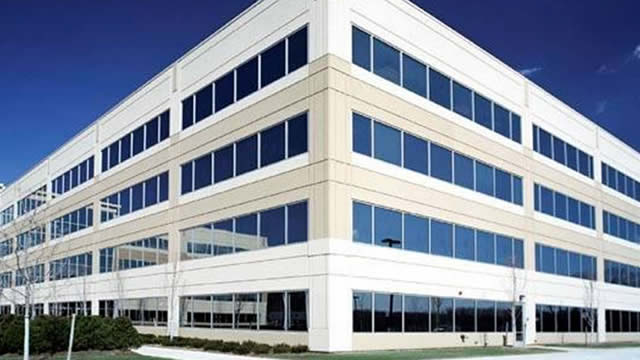
Urban Edge Properties

Urban Edge Properties (UE) Market Cap

Urban Edge Properties has a market capitalization of $2.86B.

Price: $22.66

-0.15 (-0.66%)

Market Cap: 2.86B

NYSE · time unavailable

CEO: Jeffrey S. Olson

Sector: Real Estate

Industry: REIT - Retail

IPO Date: 2015-01-16

Website: https://www.uedge.com

Urban Edge Properties (UE) - Company Information

Market Cap: 2.86B|Sector: Real Estate

Company Profile

Urban Edge Properties functions as a Real Estate Investment Trust (REIT) whose shares are publicly traded on the New York Stock Exchange. The firm is dedicated to the procurement, stewardship, enhancement, and modernization of retail properties situated in urban environments, with a significant emphasis on the dynamic New York metropolitan region. Its extensive portfolio comprises 78 distinct retail assets, collectively spanning a substantial 15.1 million square feet of total leasable space.

Analyst Sentiment

64%
Buy

From 7 Active Polls

1Y Forecast: $24.50

▲ +8.1% Potential Upside

Consensus Target Metrics

Low Bound

$24

Median

$25

High Bound

$25

Average

$25

Price & Moving Averages

Loading chart...

🎯 Wall Street Analyst Intelligence Report

1-Year structural target targets, chart projections, and sentiment maps.

Average 1Y Target
$24.50
▲ +8.12% Upside
Low Target
$24.00
6% Risk
Median Target
$24.50
8% Mid
High Target
$25.00
10% Max
Consensus
Hold
2 / 7 Buys

Consensus Trend Projection

Trailing closures vs. 12-month metrics map.

Analyst Vote Distribution

Aggregate institutional coverage sentiment weights.

📊 Historical Valuation Multiples

Real-time Trailing Twelve Month (TTM) momentum side-by-side with discrete quarterly metrics.

Fiscal QuarterTTMQ1 2026Q4 2025Q3 2025Q2 2025Q1 2025Q4 2024Q3 2024Q2 2024
Period EndingTrailing 12MMar 31, 2026Dec 31, 2025Sep 30, 2025Jun 30, 2025Mar 31, 2025Dec 31, 2024Sep 30, 2024Jun 30, 2024
Market Cap ($M)2,8562,5152,4142,5742,3452,3852,6862,6392,163
Enterprise Value ($M)4,7324,3924,0324,1893,9594,0434,3304,1433,793
Price to Earnings Ratio (P/E)26.3927.7548.6142.6510.1467.8622.4072.7617.50
Price/Earnings-to-Growth Ratio (PEG)2.548.0543.926.3913.18
Price to Sales Ratio (P/S)5.8718.9620.1921.4220.5620.1823.0823.4720.30
Price to Book Ratio (P/B)2.221.951.871.981.801.882.102.101.83
Price to Free Cash Flow Ratio (P/FCF)15.0964.2847.3546.2153.9773.1951.2372.1352.46
Enterprise Value to Sales (EV/Sales)33.1133.7234.8734.7034.2137.2136.8535.60
Enterprise Value to EBITDA (EV/EBITDA)14.5559.6461.4257.9034.8661.3048.5364.5740.29
Debt to Equity Ratio5.771.501.291.311.281.351.321.251.44

📘 Full Research Report

ℹ️

AI-Generated Research: This report is for informational purposes only.

📘 URBAN EDGE PROPERTIES (UE) — Investment Overview

🧩 Business Model Overview

Urban Edge Properties is a REIT that owns and manages income-producing, retail-focused real estate—predominantly open-air, neighborhood and community shopping centers in dense, established submarkets. The value chain is straightforward: (1) acquire and develop or redevelop retail properties with durable local demand, (2) lease space to a diversified mix of tenants (often including necessity-driven categories such as grocery and daily-services), and (3) generate cash flow through contractual rent collections while actively managing leasing, renewals, and capital programs to preserve or grow property-level fundamentals.

Because the company controls both the asset base and the property-management/leasing function, investment returns depend on asset selection (location and tenant demand), execution of lease-up and re-leasing, and capital discipline across redevelopment and maintenance.

💰 Revenue Streams & Monetisation Model

UE’s monetisation is primarily rental revenue structured around lease contracts. Revenue is largely recurring in nature, supported by multi-year tenant occupancy. Monetisation drivers typically include:

  • Base rent and contractual escalators: provides a baseline of recurring cash flow.
  • Tenant re-leasing and renewal spreads: rent resets at rollover points can raise or compress revenue depending on market fundamentals and tenant demand.
  • Ancillary income: common-area maintenance and other recoveries are sensitive to operating cost structure and occupancy levels.
  • Redevelopment/value-add programs: increase rentable area, improve tenant quality, and support higher rents after leasing.

Margin profile is driven by occupancy and rent collection performance, plus the ability to manage operating expenses and capital expenditures without impairing long-term earning power.

🧠 Competitive Advantages & Market Positioning

UE’s moat is best characterized as a geographic scarcity and execution advantage—the capacity to assemble and operate retail assets in established, high-demand submarkets where supply constraints and entitlement complexity limit rapid competitive replication. In practice, competitors can acquire similar properties, but doing so at scale with comparable tenant quality and redevelopment success is difficult.

  • Tenant demand durability (necessity-anchored design): open-air, neighborhood/community centers can be supported by everyday retail categories, which tend to show lower demand volatility than discretionary formats.
  • Operational leasing capabilities: a repeatable leasing/re-leasing process and property management platform can reduce downtime and protect cash flow through cycles.
  • Redevelopment know-how: thoughtful upgrades (site improvements, façades, tenant mix rebalancing) can improve long-run rents and absorption capacity.

COMPETITIVE BENCHMARKING:

  • Kimco Realty (KIM): broader portfolio scale with a focus spanning neighborhood and community shopping centers; UE’s distinction is concentration in urban/infill-style retail submarkets and a portfolio that emphasizes local demand and tenant-appropriate footprints.
  • Regency Centers (REG): strong positioning in retail with an emphasis on high-quality locations and long-term tenant relationships; UE competes by targeting specific infill characteristics and value-add/redevelopment pathways rather than relying solely on high-barrier first-choice locations.
  • Agree Realty (ADC): often emphasizes net lease structures and diversified grocery/necessity tenancy; UE competes by owning and operating centers where active leasing, tenant mix management, and property upgrades are central to value creation.

Overall, UE’s defensibility stems less from a technology-driven switching-cost construct and more from submarket land scarcity, tenant-demand fit, and repeatable redevelopment/execution—all of which are challenging to reproduce quickly.

🚀 Multi-Year Growth Drivers

  • Infill and “last-mile” retail demand: dense submarkets support recurring foot traffic and convenience retail, benefiting property types designed for everyday shopping.
  • Redevelopment and tenant-mix rebalancing: converting under-optimized spaces and upgrading the tenant roster can improve rent-per-square-foot and reduce vacancy exposure.
  • Leasing discipline and renewal management: structured re-leasing strategies can sustain occupancy through downturns and capture market rent growth during improving conditions.
  • Inflation-linked rent structures and recoveries: where leases include escalators and expense pass-throughs, cash flows can partially track cost inflation.
  • Capital recycling and portfolio optimization: selling non-core assets and reinvesting into higher-return properties can lift long-run performance if executed with disciplined underwriting.

The five-to-ten year opportunity is driven by maintaining property-level resilience while compounding value through selective redevelopment and disciplined capital allocation—rather than relying on large external category growth.

⚠ Risk Factors to Monitor

  • Tenant credit and lease rollover exposure: an adverse shift in tenant fundamentals can pressure occupancy and renewal spreads.
  • Retail secular pressure and format substitution: consumer preference changes can reduce demand for certain tenant categories, requiring active leasing and space repositioning.
  • Interest-rate and capital-market sensitivity: REIT earnings and valuation can be impacted by borrowing costs, refinancing availability, and investor demand for real estate credit risk.
  • Capital intensity of redevelopment: value-add projects require successful leasing post-improvement; overruns or slower absorption can dilute returns.
  • Property-level operating cost inflation: despite expense recoveries, higher insurance, labor, and maintenance costs can pressure margins if recoverability is imperfect.

📊 Valuation & Market View

The market typically values retail REITs through income and balance-sheet capacity, with emphasis on cash-flow metrics such as FFO/AFFO and NAV-derived assessments, rather than earnings multiples alone. Key valuation drivers include:

  • Stabilized occupancy and lease economics: rent growth, renewal spreads, and lease duration shape forward cash-flow expectations.
  • Same-property operating performance: expense discipline and recoverability influence cash margins.
  • Financing structure: leverage level, debt maturity profile, and hedging affect downside resilience.
  • Cap-rate environment and real estate cost of capital: valuation often moves with changes in required risk-adjusted returns.

For UE, the investment debate typically centers on the sustainability of property-level fundamentals and the ability of redevelopment/value-add to generate returns above the cost of capital.

🔍 Investment Takeaway

Urban Edge Properties offers a long-term thesis grounded in infill retail real estate fundamentals, active leasing capabilities, and redevelopment execution. The core strength is a defensible portfolio strategy that aligns property design with necessity-driven tenant demand in constrained submarkets—supporting durable cash flow through cycles. Upside depends on disciplined capital allocation and continued success in tenant mix and property improvements, while downside centers on leasing/credit risks and capital-market sensitivity inherent to REIT structures.


⚠ AI-generated — informational only. Validate using filings before investing.

📰 Market News & Coverage

15 Stories Available

Real-time institutional reporting and market updates for UE.

defenseworld.net2026-07-28

Bank of New York Mellon Corp Has $25.02 Million Position in Urban Edge Properties $UE

Bank of New York Mellon Corp grew its stake in Urban Edge Properties (NYSE: UE) by 5.9% in the first quarter, according to the company in its most recent filing with the Securities and Exchange Commission (SEC). The fund owned 1,252,067 shares of the real estate investment trust's stock after acquiring an additional

businesswire.com2026-07-07

Urban Edge Properties Announces Change to Date of Second Quarter 2026 Earnings Release and Conference Call

NEW YORK--(BUSINESS WIRE)--Urban Edge Properties Announces Change to Date of Second Quarter 2026 Earnings Release and Conference Call.

businesswire.com2026-06-17

Urban Edge Properties Invites You to Join Its Second Quarter 2026 Earnings Conference Call

NEW YORK--(BUSINESS WIRE)--Urban Edge Properties Invites You to Join Its Second Quarter 2026 Earnings Conference Call.

zacks.com2026-06-11

Urban Edge Properties (UE) is a Top Dividend Stock Right Now: Should You Buy?

Dividends are one of the best benefits to being a shareholder, but finding a great dividend stock is no easy task. Does Urban Edge Properties (UE) have what it takes?

seekingalpha.com2026-06-08

Urban Edge: Strong Leasing Momentum Supports Continued Upside

Urban Edge Properties is a shopping center REIT focused on densely populated Northeast U.S. markets with limited new supply. UE is driven by strong leasing fundamentals and a robust signed-not-open pipeline. Management guides for 5% FFO per share growth in 2026, supported by embedded rent escalators and redevelopment opportunities.

zacks.com2026-05-26

Urban Edge Properties (UE) Could Be a Great Choice

Dividends are one of the best benefits to being a shareholder, but finding a great dividend stock is no easy task. Does Urban Edge Properties (UE) have what it takes?

businesswire.com2026-05-06

Urban Edge Properties Declares a Quarterly Common Dividend of $0.21 per Share

NEW YORK--(BUSINESS WIRE)--Urban Edge Properties Declares a Quarterly Common Dividend of $0.21 per Share.

seekingalpha.com2026-05-03

REITs Excel, Earnings Swell, Fed Rebels

U.S. equity markets advanced for a fifth straight week - their longest winning streak since 2024 - as strong earnings, resilient data, and hopes for lasting Iran peace fueled optimism. Investors looked through another oil-price surge and inflationary pressure, focusing instead on corporate resilience and economic strength despite a complex macro backdrop shaped by geopolitical and policy uncertainty. The Fed held rates steady in an unusually fractured 8-4 vote, while Powell's plan to remain on the Board broke precedent and raised politically charged succession questions.

seekingalpha.com2026-04-29

Urban Edge Properties (UE) Q1 2026 Earnings Call Transcript

Urban Edge Properties (UE) Q1 2026 Earnings Call Transcript

businesswire.com2026-04-29

Urban Edge Properties Reports First Quarter 2026 Results

NEW YORK--(BUSINESS WIRE)--Urban Edge Properties Reports First Quarter 2026 Results.

zacks.com2026-04-21

Why Urban Edge Properties (UE) is a Great Dividend Stock Right Now

Dividends are one of the best benefits to being a shareholder, but finding a great dividend stock is no easy task. Does Urban Edge Properties (UE) have what it takes?

zacks.com2026-04-02

Why Urban Edge Properties (UE) is a Top Dividend Stock for Your Portfolio

Dividends are one of the best benefits to being a shareholder, but finding a great dividend stock is no easy task. Does Urban Edge Properties (UE) have what it takes?

defenseworld.net2026-03-30

Urban Edge Properties (NYSE:UE) Receives $22.00 Average PT from Brokerages

Urban Edge Properties (NYSE: UE - Get Free Report) has received a consensus rating of "Hold" from the six analysts that are presently covering the firm, Marketbeat reports. Four equities research analysts have rated the stock with a hold rating and two have given a buy rating to the company. The average 12 month price target

businesswire.com2026-03-19

Urban Edge Properties Invites You to Join Its First Quarter 2026 Earnings Conference Call

NEW YORK--(BUSINESS WIRE)--Urban Edge Properties Invites You to Join Its First Quarter 2026 Earnings Conference Call.

zacks.com2026-03-17

Urban Edge Properties (UE) is a Top Dividend Stock Right Now: Should You Buy?

Dividends are one of the best benefits to being a shareholder, but finding a great dividend stock is no easy task. Does Urban Edge Properties (UE) have what it takes?

📊 AI Financial Analysis

Powered by StockMarketInfo
Earnings Data: Q Ending 2026-03-31

"UE reported Q1 2026 revenue of $132.6M and net income of $24.3M (EPS $0.18). Revenue grew +10.7% QoQ (vs. $119.6M in Q4’25) and +12.2% YoY (vs. $118.2M in Q1’25). Net income rose +95.7% QoQ (from $12.4M in Q4’25) and +196.2% YoY (from $8.2M in Q1’25), indicating a sharp rebound in profitability. Profitability expanded meaningfully: gross margin jumped to 65.7% in Q1’26 from 8.1% in Q4’25 and 4.0% in Q1’25, while operating margin increased to 58.8% (vs. 27.8% in Q4’25 and 23.4% in Q1’25). However, the income statement shows extreme quarter-to-quarter variability, so the current run-rate should be monitored. Cash flow quality improved with operating cash flow (OCF) of $39.1M and free cash flow (FCF) of $39.1M. The company paid dividends of $26.4M; with no buybacks reported this quarter. Balance sheet liquidity remains solid with cash and short-term investments of $50.0M and equity at ~$1.38B, though total liabilities remain elevated. Total shareholder returns appear supportive given the stock’s 1-year price momentum of +23.15%. Analyst consensus suggests a modestly higher upside (target ~$21 vs. $22.02 current), implying limited valuation support despite strong recent momentum."

Revenue Growth

Positive

Revenue up +10.7% QoQ to $132.6M and +12.2% YoY vs. Q1’25 ($118.2M), with a higher trajectory vs the prior quarter.

Profitability

Good

Net income +95.7% QoQ and +196.2% YoY. Margins expanded sharply (net margin 18.3% vs 10.4% in Q4’25 and 6.9% in Q1’25), though volatility across quarters is notable.

Cash Flow Quality

Neutral

Q1’26 OCF and FCF of ~$39.1M supported dividends ($26.4M). No buybacks reported; payout appears high (payout ratio ~1.09 based on provided metrics).

Leverage & Balance Sheet

Fair

Equity is stable and substantial (~$1.38B). Liquidity is adequate (cash & ST investments ~$50.0M). However, liabilities remain large and balance sheet leverage is still meaningful.

Shareholder Returns

Good

Strong price momentum: +23.15% over 1 year. Dividend yield is about ~1.05%, so total return is dominated by capital appreciation.

Analyst Sentiment & Valuation

Neutral

Consensus target (~$21) is slightly below the current price ($22.02), suggesting limited upside from valuation despite improving fundamentals.

Disclaimer:This analysis is AI-generated for informational purposes only. Accuracy is not guaranteed and this does not constitute financial advice.

Fundamentals Overview

Loading fundamentals overview...

Urban Edge delivered a strong Q1: adjusted FFO was $0.36/share (+3% YoY) and same-property NOI (incl. redevelopment) rose 2.8%. The quarter benefited from $500k of out-of-period tax refunds, but bad debt was higher due to an isolated Puerto Rico QSR operator moving to cash basis—management expects normalization near ~75 bps of gross rents for the rest of the year. Leasing momentum remains the core driver: 419,000 sq ft executed, 52% cash rent spread on new leases, and leasing pipeline visibility supported by a $22m SNO rent pipeline and spreads expected to exceed 20%. Occupancy dipped 30 bps to 96.4% due to planned recapture at Hanover Commons, but management targets 97%–98% by year-end. Guidance increased $0.01/share at the low end to $1.48–$1.52, driven by a 25 bps lift in same-property NOI outlook. Growth is supported by a $157m redevelopment pipeline (13% yield) and the $54m Bridgewater acquisition (7.7% cap rate).

AI IconGrowth Catalysts

  • Signed but not open (SNO) pipeline driving near-term rent commencements: $22 million annual gross rent (~7% of current NOI), with visibility through 2027
  • Record leasing activity expected as leasing spreads exceed 20% (per management) supported by 419,000 sq ft executed in Q1 (84,000 new leases)
  • Redevelopment rent commencements contributing to higher NOI yield: nearly 50% yield on stabilized projects; stabilized 4 projects totaling ~$7 million in quarter

Business Development

  • Village at Bridgewater Commons acquisition (92,000 sq ft, Bridgewater, NJ) for $54 million at a 7.7% cap rate; tenants include Summit Health, Chipotle, Shake Shack, Millburn Deli, CAVA, Starbucks
  • 1031 acquisition structure tied to expected sale of a Kohl’s-anchored property in New Jersey (buyer in diligence; completion hoped soon)
  • Early recapture/active negotiations for Kohl’s space at Hanover Commons (Saks box recapture) with multiple potential users (grocer/apparel/additional shops)
  • Trader Joe’s and Ross at The Plaza at Woodbridge; Lidl and Boot Barn at Totowa Commons; Texas Roadhouse at The Outlets at Montehiedra; Big Blue at Plaza at Cherry Hill (redevelopment commencements)

AI IconFinancial Highlights

  • FFO (adjusted) $0.36/share in Q1: +3% YoY and exceeded internal expectations
  • Same-property NOI including redevelopment +2.8% YoY, driven by rent commencements and better-than-expected recoveries including $500,000 out-of-period tax refunds; partially offset by higher bad debt
  • Leasing: 52% same-space cash rent spread on new leases; 2 new anchor leases signed with 3% annual rent escalators
  • Leased occupancy 96.4% at quarter-end: down 30 bps vs prior quarter and Q1 2025; decline expected due to Saks box recapture evaluation
  • Guidance: increased 2026 FFO (adjusted) by $0.01/share at low end to $1.48–$1.52; reflects 25 bps increase on low end same-property NOI guidance to 3.0%–3.75%
  • Liquidity/cash: nearly $1 billion total liquidity; $30 million drawn on credit facility; no draws on delayed draw term loans
  • Financing: $62.5 million 7-year nonrecourse mortgage secured by The Plaza at Woodbridge, swapped to a fixed 5%
  • Bad debt outlook: uncollected rent expected to trend near ~75 bps of gross rents for remainder of year (vs Q1 elevated level); Q3/Q4 SNO acceleration
  • Future SNO recognition: another $3.3 million gross rents in remainder of 2026; 90% in Q3 and Q4

AI IconCapital Funding

  • No explicit buyback disclosed in transcript
  • Debt: $62.5 million 7-year nonrecourse mortgage placed in March (swapped fixed rate 5%)
  • Liquidity: nearly $1 billion total liquidity; $30 million credit facility drawn
  • No amounts drawn on 5-year or 7-year delayed draw term loans

AI IconStrategy & Ops

  • Occupancy management: target 97%–98% achievable by year-end; proactive conversion of under-leased space by negotiating recapture/terminations where landlords can accretively re-lease
  • Tenant re-lease strategy: market rents now high enough to support accretive lease termination and replacement tenancy (example: Framingham Kohl’s early recapture with active negotiations at significantly higher rent)
  • Redevelopment yield focus: active redevelopment pipeline $157 million expected yield 13%; stabilized projects generated nearly 50% yield; largely pre-leased to reduce risk
  • Asset management illustration (Woodbridge): refinancing after re-tenants’ NOI upside (Trader Joe’s, Ross, CAVA, karate studio) enabled extraction of $12 million more proceeds at 5%

AI IconMarket Outlook

  • 2026 FFO (adjusted) guidance raised to $1.48–$1.52/share (midpoint +5% growth vs 2025)
  • Same-property NOI guidance increased 25 bps on low end to 3.0%–3.75%
  • Expected SNO gross rent recognition: $3.3 million for remainder of year; 90% in Q3/Q4
  • Leasing spreads expected to exceed 20% (per management) leading to record leasing activity over coming quarters
  • Occupancy target: 97%–98% by end of year

AI IconRisks & Headwinds

  • Bad debt pressure in Q1 tied to isolated Puerto Rico franchise operator moved to cash basis (reserves for back/current rents); management expects more normalized ~75 bps of gross rent uncollected for rest of year
  • Near-term occupancy drag: 96.4% leased occupancy down 30 bps from prior quarter due to Saks box recapture at Hanover Commons while evaluating multiple uses
  • Commodity-like volatility risk to NOI from weather: Q1 operating expense up ~25% due to snow/snow-related costs (~$3.5 million vs prior year), expected to normalize in Q2–Q4
  • Anchor leasing escalator expectations not guaranteed: management does not expect 3%+ escalators to be the norm on every anchor deal

Q&A: Analyst Interest

  • Topic: Q1 bad debt—tenant specifics and normalization. Management described the largest increase as a Puerto Rico QSR franchise operator moved to a cash basis, reserving back and current rent. Post-quarter, it executed a payment plan: fully paid April and began arrears payments, supporting an isolated, non-systemic outlook.
  • Topic: Anchor renewal leverage and escalator expectations. Management confirmed tenants are approaching earlier for renewals due to scarce supply, shifting conversations toward “pay X to stay” leverage. However, they cautioned 3%+ escalators aren’t portfolio-wide norms; they framed improved anchor terms as an extended imbalance between supply and demand.
  • Topic: Bridgewater acquisition underwriting—cap rate framing and NOI growth sources. Management said the 7.7% cap rate traded higher because the anchor wasn’t a grocery store; Summit Health had ~11 years remaining with a long-term lease. They highlighted revised expectations for 2.75% NOI growth, with >half from contractual rent increases and option exercises.

Sentiment: POSITIVE

Note: This summary was synthesized by AI from the UE Q1 2026 earnings transcript. Financial data is complex; please verify all metrics against official SEC filings before making investment decisions.

📋 Official Regulatory 10-K / 10-Q SEC Filings

Direct authenticated documentation links to audited SEC database reports for UE.

SEC EDGAR Live Feed
Loading financial data and tables...
📁

SEC Filings (UE)

© 2026 Stock Market Info — Urban Edge Properties (UE) Financial Profile