Veeco Instruments Inc.

Veeco Instruments Inc. (VECO) Market Cap

Veeco Instruments Inc. has a market capitalization of $3.05B.

Price: $50.00

1.63 (3.37%)

Market Cap: 3.05B

NASDAQ · time unavailable

CEO: William John Miller

Sector: Technology

Industry: Semiconductors

IPO Date: 1994-11-29

Website: https://www.veeco.com

Veeco Instruments Inc. (VECO) - Company Information

Market Cap: 3.05B|Sector: Technology

Company Profile

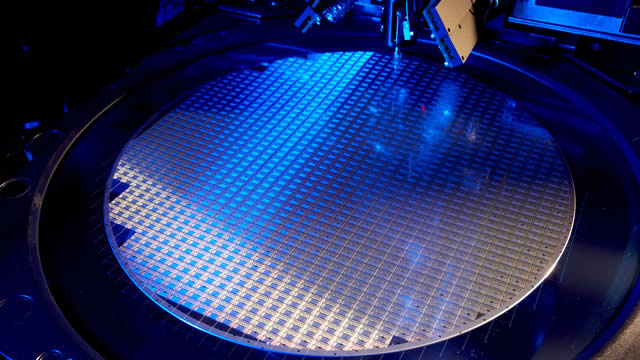
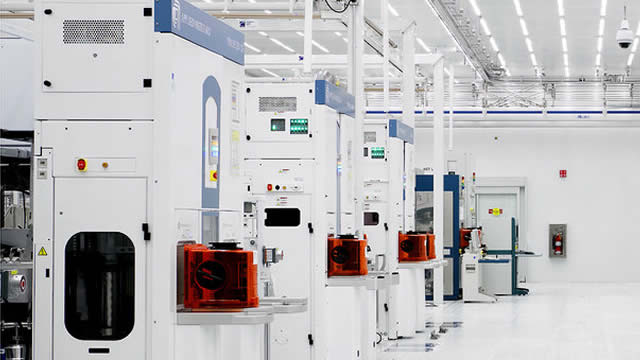
Veeco Instruments Inc., operating globally with its subsidiaries, specializes in the engineering, production, sale, and support of advanced semiconductor and thin film process equipment used primarily in the manufacture of electronic devices. Their comprehensive product portfolio features systems such as laser annealing, ion beam deposition and etch, metal organic chemical vapor deposition (MOCVD), single wafer wet processing and surface preparation, molecular beam epitaxy (MBE), and atomic layer deposition (ALD), alongside other deposition solutions and packaging lithography tools. These advanced processing platforms are essential for manufacturing diverse microelectronic components, including logic chips, dynamic random-access memory (DRAM), photonics devices, power electronics, radio frequency (RF) filters and amplifiers, magnetic heads for hard disk drives, and various other semiconductor applications. The company's clientele encompasses integrated device manufacturers (IDMs), foundries, outsourced semiconductor assembly and test (OSAT) providers, hard disk drive and photonics producers, as well as educational institutions and research facilities. Established in 1945, Veeco Instruments Inc. is headquartered in Plainview, New York.

Analyst Sentiment

58%
Buy

From 4 Active Polls

1Y Forecast: $55.00

▲ +10.0% Potential Upside

Consensus Target Metrics

Low Bound

$55

Median

$55

High Bound

$55

Average

$55

Price & Moving Averages

Loading chart...

🎯 Wall Street Analyst Intelligence Report

1-Year structural target targets, chart projections, and sentiment maps.

Average 1Y Target
$55.00
▲ +10.00% Upside
Low Target
$55.00
10% Risk
Median Target
$55.00
10% Mid
High Target
$55.00
10% Max
Consensus
Buy
19 / 36 Buys

Consensus Trend Projection

Trailing closures vs. 12-month metrics map.

Analyst Vote Distribution

Aggregate institutional coverage sentiment weights.

📊 Historical Valuation Multiples

Real-time Trailing Twelve Month (TTM) momentum side-by-side with discrete quarterly metrics.

Fiscal QuarterTTMQ1 2026Q4 2025Q3 2025Q2 2025Q1 2025Q4 2024Q3 2024Q2 2024
Period EndingTrailing 12MMar 31, 2026Dec 31, 2025Sep 30, 2025Jun 30, 2025Mar 31, 2025Dec 31, 2024Sep 30, 2024Jun 30, 2024
Market Cap ($M)3,0522,0461,6951,8281,2001,1601,5121,8692,641
Enterprise Value ($M)3,1342,1281,7931,8971,2741,2721,6812,0202,780
Price to Earnings Ratio (P/E)127.19-1567.59386.2242.2625.4023.9024.8120.7143.44
Price/Earnings-to-Growth Ratio (PEG)4.0854.34
Price to Sales Ratio (P/S)4.6612.9210.2711.027.236.938.3010.1115.01
Price to Book Ratio (P/B)3.422.311.912.091.401.431.962.503.69
Price to Free Cash Flow Ratio (P/FCF)71.15722.3278.27141.11220.3887.6165.16137.18479.92
Enterprise Value to Sales (EV/Sales)13.4410.8711.447.677.609.2310.9315.81
Enterprise Value to EBITDA (EV/EBITDA)55.20376.23147.15100.3463.6756.48128.1659.94105.16
Debt to Equity Ratio1.440.300.300.300.310.350.410.420.44

📘 Full Research Report

ℹ️

AI-Generated Research: This report is for informational purposes only.

📘 VEECO INSTRUMENTS INC (VECO) — Investment Overview

🧩 Business Model Overview

VECO designs and manufactures capital equipment used in the fabrication of semiconductors and thin-film devices, with a focus on high-vacuum deposition processes. The value chain is built around (1) translating customer process requirements into machine and recipe specifications, (2) delivering integrated tool performance for repeatable film quality, and (3) supporting the installed base through service, upgrades, and process optimization.

Revenue is tied to customers’ capital expenditure cycles, but the economics are supported by the long qualification and process-integration effort required to deploy new deposition tools into production. Once a tool is qualified, performance improvements and maintenance create a recurring service component.

💰 Revenue Streams & Monetisation Model

VECO monetizes primarily through:

  • Systems revenue (project / product sales): Sale of deposition and process equipment. Margins depend on product mix, manufacturing efficiency, and the extent of customization required by the end customer.
  • Service and spares: Installed-base maintenance, replacement components, and service contracts. This segment tends to be less cyclical than systems revenue and helps stabilize gross margin through cycle downturns.
  • Upgrades and process support: Enhancements to extend tool capability and improve yield/throughput, often leveraging installed-system knowledge.

The key margin drivers are (1) utilization and absorption of manufacturing costs, (2) mix of new tools versus service, and (3) the degree of customization and technical labor intensity needed to meet customer specifications.

🧠 Competitive Advantages & Market Positioning

VECO’s competitive position is primarily supported by high switching costs and process know-how rather than broad scale manufacturing alone.

  • High switching costs (process qualification and downtime risk): Semiconductor and thin-film manufacturing lines require extended qualification for film uniformity, defectivity, and recipe stability. Switching to a different tool supplier typically involves requalification, yield ramp time, and potential production risk—creating strong stickiness once a platform is embedded.
  • Installed-base learning curve: Service activities generate feedback that improves diagnostics, maintenance schedules, and upgrade paths. This strengthens customer retention and supports higher-value add-ons.
  • Technical differentiation in deposition performance: Precision deposition under controlled vacuum environments and repeatable process outcomes matter for device performance, driving continued demand for proven tool ecosystems.

Competitive benchmarking (examples):

  • Applied Materials — broader multi-process semiconductor equipment vendor with scale across deposition/etch and wafer processing. VECO’s focus is narrower in deposition tool expertise, where depth of process control and qualification can create differentiation.
  • Lam Research — concentrated on etch and related plasma processes. VECO competes in the deposition layer of device stacks rather than primarily in Lam’s core plasma etch franchises.
  • ASM International — strong in deposition and atomic layer deposition (ALD) ecosystems. VECO’s differentiation is tied to its specific deposition tool platforms and customer recipe performance; competitive outcomes depend on which process technology best satisfies the device architecture.

Across these rivals, VECO’s advantage typically comes from specialization and system-level process execution that reduces yield and ramp uncertainty for customers.

🚀 Multi-Year Growth Drivers

  • Semiconductor device complexity: As device generations advance, deposition uniformity, film quality, and defect control become more critical. That supports sustained capital intensity in deposition steps and upgrades for installed tooling.
  • Heterogeneous integration and specialized thin films: Increasing use of specialized materials stacks and engineered interfaces supports demand for deposition systems that can deliver tightly controlled process outcomes.
  • Long-lived installed base economics: Even when new system orders fluctuate, maintenance, spares, and capability upgrades extend tool life and maintain an ongoing revenue stream.
  • Share gains through process fit: Suppliers that can meet specific deposition performance requirements for a given device roadmap can secure multi-tool programs, expanding total addressable installations within each customer.

Over a 5–10 year horizon, the TAM is supported by durable capital intensity in semiconductor manufacturing and the need for specialized deposition steps in advanced device architectures, with growth supported by both new tool placements and installed-base upgrades.

⚠ Risk Factors to Monitor

  • Capital expenditure cyclicality: Systems revenue is highly sensitive to semiconductor and thin-film capex cycles; downturns can compress order flow and utilization.
  • Technological shifts in deposition methods: Device roadmaps can favor different deposition chemistries or approaches, potentially altering demand for specific equipment categories.
  • Competition from scaled platforms: Large integrated equipment vendors and technology-focused competitors may win share through platform breadth, bundled service capability, or aggressive pricing tied to scale.
  • Execution and ramp risk in complex tools: Customization, integration complexity, and qualification timelines can impact margins and delivery performance.
  • Export controls and geopolitical constraints: Semiconductor equipment is subject to regulatory restrictions that can affect addressable markets and customer purchasing behavior.

📊 Valuation & Market View

Equipment manufacturers such as VECO are often valued through a blend of EV/EBITDA and P/S frameworks, with valuation sensitivity to:

  • Order visibility and backlog quality: Sustainable order intake reduces earnings volatility.
  • Gross margin trajectory: Mix shifts toward service and stable manufacturing efficiency can support higher profitability.
  • Service attach rate and installed-base growth: Greater contribution from recurring service reduces cyclicality and can support a higher earnings multiple.
  • Cycle positioning and normalization assumptions: Markets typically re-rate the sector when fundamentals shift from trough conditions toward normalization.

The key market question is whether VECO’s installed-base economics and technical differentiation can dampen cyclicality while new system demand tracks advanced device investment needs.

🔍 Investment Takeaway

VECO’s long-term investment appeal rests on specialized deposition tool expertise that translates into high switching costs from process qualification and installed-base stickiness. While near-term results depend on semiconductor and thin-film capex cycles, the company’s service and upgrade model, combined with deep process performance knowledge, provides structural support for resilience through downturns and upside during capital expansions.


⚠ AI-generated — informational only. Validate using filings before investing.
📰 Market News & Coverage

15 Stories Available

Real-time institutional reporting and market updates for VECO.

defenseworld.net2026-07-30

Veeco Instruments Inc. $VECO Shares Bought by Fifth Third Bancorp

Fifth Third Bancorp lifted its stake in shares of Veeco Instruments Inc. (NASDAQ: VECO) by 1,548.5% during the undefined quarter, according to the company in its most recent filing with the Securities and Exchange Commission (SEC). The fund owned 15,084 shares of the semiconductor company's stock after purchasing an additional 14,169 shares during

defenseworld.net2026-07-28

Caxton Associates LLP Purchases Shares of 16,656 Veeco Instruments Inc. $VECO

Caxton Associates LLP purchased a new stake in Veeco Instruments Inc. (NASDAQ: VECO) during the first quarter, according to its most recent 13F filing with the Securities and Exchange Commission (SEC). The firm purchased 16,656 shares of the semiconductor company's stock, valued at approximately $564,000. Several other large investors have also modified their

globenewswire.com2026-07-22

Veeco Announces Date for Second Quarter 2026 Financial Results and Conference Call

PLAINVIEW, N.Y., July 22, 2026 (GLOBE NEWSWIRE) -- Veeco Instruments Inc. (NASDAQ: VECO) plans to release its second quarter 2026 financial results after the market closes on Wednesday, August 5, 2026. The company will host a conference call to review these results starting at 5:00 PM ET that day.

zacks.com2026-06-30

5 Small and Mid-Cap AI Stocks to Buy That Have Skyrocketed in 1H 2026

BAND, AIP, PENG, ATEN and VECO are among small- and mid-cap AI stocks that surged in 1H 2026 with more room to grow in 2H.

zacks.com2026-06-26

Zacks Industry Outlook Kulicke and Soffa , Ultra Clean and Veeco

Kulicke and Soffa , Ultra Clean and Veeco have been highlighted in this Industry Outlook article.

zacks.com2026-06-25

3 Stocks to Buy From the Prospering Electronics Manufacturing Industry

The Zacks Electronics - Manufacturing Machinery industry participants, such as KLIC, UCTT and VECO, are benefiting from strong demand for high-performance computing, advanced packaging and AI-driven demand amid challenging macroeconomic conditions.

fool.com2026-06-24

A Veeco Director Sold Nearly 18,000 Company Shares Worth $1.1 Million. Here's a Deeper Look at the Transaction.

This semiconductor equipment maker, known for advanced deposition and etch systems, just reported a notable insider sale in SEC filings.

fool.com2026-06-24

Director Sells 43,000 Veeco Instruments Shares for $2.7 Million

Veeco Instruments, a supplier of semiconductor process equipment, reported a notable insider sale amid a year of sharp stock gains.

zacks.com2026-06-16

Veeco (VECO) Soars 7.2%: Is Further Upside Left in the Stock?

Veeco (VECO) saw its shares surge in the last session with trading volume being higher than average. The latest trend in earnings estimate revisions may not translate into further price increase in the near term.

globenewswire.com2026-06-11

Ennostar Qualifies Veeco's New LUMINA®+ MOCVD System for Advanced Product Applications

Breakthrough system is the industry's largest capacity arsenide phosphide tool with the highest throughput Breakthrough system is the industry's largest capacity arsenide phosphide tool with the highest throughput

invezz.com2026-06-09

Veeco stock soars on NSA500 order as chip demand gains momentum

Shares of Veeco Instruments VECO moved sharply higher on Tuesday after the semiconductor equipment maker announced a follow-on order for its Nanosecond Annealing System (NSA500). The move signals growing customer confidence in the company's technology for advanced chip manufacturing.

globenewswire.com2026-06-09

Veeco Receives Follow-On Order for Nanosecond Annealing System; Expands Evaluation Activity

Second system order follows successful evaluation; third advanced logic customer engagement underway Second system order follows successful evaluation; third advanced logic customer engagement underway

gurufocus.com2026-05-27

A Look at Veeco Instruments Inc (VECO) After 3.6% Decline -- GF Value $29.29 vs Price $60.24

On May 27, 2026, Veeco Instruments Inc (VECO) shares fell 3.6% to $60.24. This price movement comes after a strong one-month gain of 21.1% and an impressive yea

globenewswire.com2026-05-21

Veeco Announces Upcoming Investor Events

PLAINVIEW, N. Y. , May 21, 2026 (GLOBE NEWSWIRE) -- Veeco Instruments Inc. (NASDAQ: VECO) today announced management is scheduled to participate in the following investor events: TD Cowen 54th Annual Technology, Media and Telecom Conference on Thursday, May 28th 2026, at The InterContinental New York Barclay Hotel in New York, NY.

globenewswire.com2026-05-21

Veeco Announces Upcoming Investor Events

PLAINVIEW, N.Y., May 21, 2026 (GLOBE NEWSWIRE) -- Veeco Instruments Inc. (NASDAQ: VECO) today announced management is scheduled to participate in the following investor events:

📊 AI Financial Analysis

Powered by StockMarketInfo
Earnings Data: Q Ending 2026-03-31

"VECO reported Q1 2026 revenue of $158.3M and net income of -$0.3M (EPS -$0.01). Revenue was -4.1% QoQ versus Q4 2025 ($165.0M) and -5.4% YoY versus Q1 2025 ($167.3M). Net income swung from +$1.1M in Q4 to -$0.3M in Q1 (profitability deterioration), and fell sharply from +$11.9M in Q1 last year. Profitability contracted meaningfully: gross margin declined to 35.3% from 37.1% in Q4 and 40.9% in Q1 last year, while operating margin turned negative (-1.7%) after being slightly negative in Q4 (-0.9%) and strongly positive in Q3/Q2/Q1 2025 (6.4% to 8.5%). Interest coverage is also negative, consistent with operating weakness. Cash flow quality remains mixed. Operating cash flow was +$7.9M in the quarter, producing modest free cash flow of +$2.8M, versus +$24.9M operating cash flow in Q4. The balance sheet looks resilient with $383.3M cash & short-term investments and total assets of $1.35B; equity was stable at $883.7M (slightly down from $885.5M). Total shareholder returns appear strongly positive given the stock price at $42.97 and 1-year momentum (+134.3%) even though dividends/buybacks are not evident in the cash flow provided. Revenue and Earnings-based metrics indicate a setback in profitability for Q1 2026 despite solid liquidity and strong market momentum."

Revenue Growth

Neutral

Revenue declined -4.1% QoQ (from $165.0M to $158.3M) and -5.4% YoY (from $167.3M to $158.3M), indicating a weakening top line trend into Q1.

Profitability

Neutral

Net income fell from +$1.1M (Q4) to -$0.3M (Q1) and from +$11.9M (Q1 last year) to -$0.3M. Operating margin deteriorated to -1.7% in Q1 2026 from -0.9% in Q4 and 8.5% in Q1 2025; gross margin also compressed (35.3% vs 37.1% QoQ and 40.9% YoY).

Cash Flow Quality

Fair

Operating cash flow was +$7.9M and free cash flow +$2.8M in Q1 2026, down from +$24.9M operating cash flow in Q4. While liquidity supports flexibility, near-term cash generation softened alongside losses.

Leverage & Balance Sheet

Positive

Total assets rose to $1.35B from $1.33B QoQ. Equity is stable ($883.7M vs $885.5M). Liquidity is strong with $383.3M cash & short-term investments; net debt slightly improved to ~$78.9M.

Shareholder Returns

Good

Strong 1-year price momentum (+134.3% 1y_change) should materially lift total shareholder return expectations. Dividend payments were $0 in the cash flow provided; buybacks also appear absent.

Analyst Sentiment & Valuation

Caution

Consensus price target ($34.75) is below the current price ($42.97), implying the market is pricing in optimism despite recent profitability deterioration; valuation signals are mixed given negative earnings in the latest quarter.

Disclaimer:This analysis is AI-generated for informational purposes only. Accuracy is not guaranteed and this does not constitute financial advice.

Fundamentals Overview

Loading fundamentals overview...

VECO delivered Q1 2026 results within guidance: $158M revenue and non-GAAP EPS of $0.14, but gross margin fell to ~36.2% (from 37.7% prior quarter). Management traced the margin and revenue shortfall to a BIS export-license requirement for a China LSA customer, causing one fewer shipped system and ~$8M top-line impact. Offsetting this, the quarter showed strong forward momentum. The company announced >$250M of indium phosphide laser manufacturing orders across MOCVD, wet processing, and SPECTOR ion beam deposition, with shipping expected to start in Q3 and the largest ramp in Q1 2027. Management also guided Q2 gross margin of 38%-40% and reiterated FY2026 revenue of $740M-$800M with diluted non-GAAP EPS of $1.50-$1.85. Strategic focus remains on scaling SPECTOR capacity (10x by early 2027) and expanding wet processing capacity (including outsourced manufacturing), while acknowledging mature-node China weakness as the main semi headwind for 2026.

AI IconGrowth Catalysts

  • AI/data-center build-out driving demand across annealing (LSA + next-gen nanosecond annealing), high-bandwidth memory, and advanced packaging wet processing/lithography for 2.5D AI accelerators
  • Compound semiconductor inflection: multiyear revenue opportunity (~$2B next several years) tied to silicon photonics transition from copper interconnects to co-packaged optics
  • Indium phosphide laser manufacturing momentum: Lumina MOCVD batch orders plus downstream WaferEtch/WaferStorm wet processing and SPECTOR ion beam deposition for laser facet coatings
  • Advanced Packaging volume orders scheduled through 2H26 and 1H27 supporting sustained AI accelerator ramps
  • Sustained bookings and visibility: delivery orders extend into 2027; compound and semiconductor order acceleration continued from 2H25 into Q1 26

Business Development

  • Multiple customers (unnamed) placing >$250M aggregate orders for indium phosphide laser manufacturing tools (MOCVD, wet processing, Ion Beam Deposition) with delivery starting 2026 and accelerating 2027
  • SPECTOR IBD: engagement with leading suppliers of next-generation 800-gig and 1.6 terabyte optical transceivers for hyperscale customers (major portion of the >$250M order activity)
  • Logic/foundry: LSA production tool of record at all three Tier 1 logic customers; next-gen nanosecond annealing evaluating at Tier 1 customers with an additional evaluation shipment expected to a third Tier 1 logic customer in coming months (product named: next-generation nanosecond annealing platform)
  • Memory: production tool of record at a leading HBM supplier; LSA evaluation system at a second Tier 1 DRAM manufacturer with potential for initial pilot line and high-volume manufacturing orders in 2027
  • Memory/Ion Beam Deposition: multiple IBD300 systems under evaluation at leading DRAM customers with activity extending throughout 2026
  • GaN: evaluation for Propel 300 at a leading power IDM; pilot line order for a multi-chamber system previously announced end of 2025 with expected shipment end-of-year timeframe
  • Wet processing capacity expansion via an outsourced partner contract manufacturer in Southeast Asia (partner not named)

AI IconFinancial Highlights

  • Revenue $158M: slightly below midpoint of Q1 guidance and prior quarter; semiconductor $109M (down 1%), compound semiconductor $19M (down 6% QoQ), data storage $10M (flat), scientific/other $20M (down 16%)
  • Non-GAAP operating income $9M; non-GAAP diluted EPS $0.14, within guidance ranges
  • Gross margin 36% vs implied higher prior quarter (management cited Q1 gross margin ~36.2% vs 37.7%); OpEx $49M
  • Margin headwind explained: one fewer LSA system to a China customer due to BIS license requirement impact; ~$8M top-line impact and resulted in gross margin being outside the guidance range
  • Effective tax rate ~11% with income tax expense ~$1M; net income ~$9M; diluted EPS on 62M shares
  • Q2 non-GAAP outlook: revenue $170M-$190M; gross margin 38%-40%; OpEx $52M-$55M; diluted EPS $0.20-$0.32 (net income $12M-$21M) on 64M shares
  • FY2026 reiterated guidance: revenue $740M-$800M; diluted non-GAAP EPS $1.50-$1.85

AI IconCapital Funding

  • Cash and short-term investments: $383M at quarter end (down $7M)
  • CapEx: $5M during Q1
  • Share count context: diluted EPS on 62M shares (Q1) and 64M shares (Q2 outlook)
  • Working capital: accounts receivable up $40M to $151M; inventory up $7M to $282M; accounts payable up $5M to $60M; contract liabilities/customer deposits up $19M to $69M
  • No buyback or debt levels were disclosed in the transcript

AI IconStrategy & Ops

  • Manufacturing footprint/capacity expansion to support increasing customer demand and timely deliveries
  • SPECTOR IBD capacity plan: increase capacity ~10x from current base level, with that level targeted for early 2027; possible further doubling later
  • Wet processing capacity plan: expand existing facility and add outsourced partner contract manufacturer in Southeast Asia for additional capacity
  • Logic and memory technology roadmap: LSA remains production tool of record at all three Tier 1 logic customers; next-gen nanosecond annealing progressing through evaluations; memory penetration via LSA evaluation system and ongoing IBD300 evaluations
  • Compound semi commercialization approach: secure early deployments tied to customer production ramps; expand footprint to meet demand

AI IconMarket Outlook

  • Q2 2026 non-GAAP: revenue $170M-$190M; gross margin 38%-40%; OpEx $52M-$55M; diluted EPS $0.20-$0.32
  • FY2026 reiterated: revenue $740M-$800M; diluted non-GAAP EPS $1.50-$1.85; management highlighted growth accelerating in 2H26
  • Compound semiconductor outlook: indium phosphide laser SAM $700M by 2030; other photonics SAM $550M by 2030; GaN Power SAM $250M by 2030; compound semi SAM framing through 2030
  • Semiconductor served available market: annealing SAM $1.3B by 2030; Ion Beam Deposition SAM $500M by 2030; Advanced Packaging SAM $1B by 2030

AI IconRisks & Headwinds

  • China mature-node headwind: mature node China business decline due to reduced investment in new fabs; cited as a semi-business headwind for 2026 (narrow base predominately 40/28nm LSA)
  • Export/license constraint risk: BIS informed one China customer would require a license to ship to certain fabs, leading to one fewer LSA system shipment (~$8M top-line impact) and gross margin outside guidance
  • Execution/capacity risk: ability to ramp SPECTOR IBD capacity to reduce lead and cycle times; lead times currently ~9 months and management expects step-up in output starting Q1 2027
  • Customer evaluation duration risk: Ion Beam deposition evaluations extended through end of 2026; tool improvements needed (automation, reliability/particle performance) to meet high-volume requirements
  • Competitive dynamics: in epitaxy, management indicated second-source positioning versus a primary incumbent; competitive pressures could affect share

Q&A: Analyst Interest

  • Order timing and ramp: Management stated the >$250M indium phosphide laser manufacturing aggregate orders (shipping starting 2026) will begin shipping in Q3. They expect the most significant ramp in Q1 2027, with visibility tied to major increases in output/capacity and customer production schedules.
  • Tool mix, competitive positioning, and sourcing: Management broke the indium phosphide opportunity into epi (MOCVD), wet processing, and laser facet coatings via SPECTOR ion beam deposition. They characterized laser facet coatings as a strong incumbent position, epitaxy as a second provider/second source, and wet processing as strong with leaders, implying partial share capture vs an incumbent.
  • Gross margin and China license impact: Management attributed the Q1 gross margin decline to operational/shipment changes: one fewer LSA system shipped to a China customer after BIS license guidance requiring licensing for certain fabs. That event drove about an $8M top-line impact and pushed results outside the gross margin guidance range.

Sentiment: MIXED

Note: This summary was synthesized by AI from the VECO Q1 2026 earnings transcript. Financial data is complex; please verify all metrics against official SEC filings before making investment decisions.

📋 Official Regulatory 10-K / 10-Q SEC Filings

Direct authenticated documentation links to audited SEC database reports for VECO.

SEC EDGAR Live Feed
Loading financial data and tables...
📁

SEC Filings (VECO)

© 2026 Stock Market Info — Veeco Instruments Inc. (VECO) Financial Profile