Whirlpool Corporation

Whirlpool Corporation (WHR) Market Cap

Whirlpool Corporation has a market capitalization of $2.56B.

Price: $39.47

-0.53 (-1.32%)

Market Cap: 2.56B

NYSE · time unavailable

CEO: Marc Robert Bitzer

Sector: Consumer Cyclical

Industry: Furnishings, Fixtures & Appliances

IPO Date: 1955-09-15

Website: https://www.whirlpoolcorp.com

Whirlpool Corporation (WHR) - Company Information

Market Cap: 2.56B|Sector: Consumer Cyclical

Company Profile

Whirlpool Corporation manufactures and markets home appliances and related products. It operates through four segments: North America; Europe, Middle East and Africa; Latin America; and Asia. The company's principal products include refrigerators, freezers, ice makers, and refrigerator water filters; laundry appliances and related laundry accessories; cooking and other small domestic appliances; and dishwasher appliances and related accessories, as well as mixers. It markets and distributes its products primarily under the Whirlpool, Maytag, KitchenAid, JennAir, Amana, Roper, Affresh, Gladiator, Swash, everydrop, Speed Queen, Hotpoint, Bauknecht, Indesit, Ignis, Privileg, Consul, Eslabon de Lujo, Brastemp, Acros, Ariston, Diqua, and Royalstar brands. The company sells its products to retailers, distributors, dealers, builders, and other manufacturers, as well as directly to consumers. Whirlpool Corporation was founded in 1911 and is headquartered in Benton Harbor, Michigan.

Analyst Sentiment

42%
Underperform

From 12 Active Polls

1Y Forecast: $48.75

▲ +23.5% Potential Upside

Consensus Target Metrics

Low Bound

$32

Median

$54

High Bound

$55

Average

$49

Price & Moving Averages

Loading chart...

🎯 Wall Street Analyst Intelligence Report

1-Year structural target targets, chart projections, and sentiment maps.

Average 1Y Target
$48.75
▲ +23.51% Upside
Low Target
$32.00
-19% Risk
Median Target
$54.00
37% Mid
High Target
$55.00
39% Max
Consensus
Hold
2 / 20 Buys

Consensus Trend Projection

Trailing closures vs. 12-month metrics map.

Analyst Vote Distribution

Aggregate institutional coverage sentiment weights.

📊 Historical Valuation Multiples

Real-time Trailing Twelve Month (TTM) momentum side-by-side with discrete quarterly metrics.

Fiscal QuarterTTMQ1 2026Q4 2025Q3 2025Q2 2025Q1 2025Q4 2024Q3 2024Q2 2024
Period EndingTrailing 12MMar 31, 2026Dec 31, 2025Sep 30, 2025Jun 30, 2025Mar 31, 2025Dec 31, 2024Sep 30, 2024Jun 30, 2024
Market Cap ($M)2,5593,2144,0334,3945,6695,0116,3375,9065,538
Enterprise Value ($M)9,0379,69211,22211,73612,92312,00912,39912,90012,576
Price to Earnings Ratio (P/E)14.34-9.809.3315.0521.8117.40-4.0513.556.32
Price/Earnings-to-Growth Ratio (PEG)5.792.195.16-1.12135.10
Price to Sales Ratio (P/S)0.170.980.981.091.501.381.531.481.39
Price to Book Ratio (P/B)0.620.851.481.852.441.952.361.941.79
Price to Free Cash Flow Ratio (P/FCF)-255.86-3.594.03-84.50-89.99-6.326.5346.5120.14
Enterprise Value to Sales (EV/Sales)2.962.742.913.423.323.003.233.15
Enterprise Value to EBITDA (EV/EBITDA)8.6365.0434.5341.3244.7240.16-233.9436.8661.35
Debt to Equity Ratio6.191.882.883.483.593.122.732.662.65

WHR Growth Runway Model

Standard long term linear growth fade

Multi-Stage Discounted Cash Flow Sandbox

Market Price$39.47
Intrinsic Value$0.00
Market Alignment
Overvalued by 255.6%relative to calculated intrinsic value
9.00%
Exp: -8%-8%
i

Growth runway slowdown

This value provides a time window for the growth rate to decline beyond Stage 1 toward the terminal rate. Longer windows are most useful for companies with high growth starting conditions or strong competitive advantages. This option stretches out the growth rate slowdown across 5, 10, or 15-year steps. A high-growth starting condition (exceeding a 25% initial growth rate) automatically applies a curve decay to simulate realistic, rapid market saturation.
i

Terminal growth rate

With long-term inflation between 3-5%, revenue must grow by that baseline to maintain flat real-world market share. This value sets the permanent terminal growth rate to factor into the valuation beyond the growth slowdown runway toward maturity.

3-Stage Financial Runway Horizon

🧠 Perpetuity Horizon Engine (Stage 3: Post-2035)

Terminal FCF Base$0.21B
Perpetuity TV Value$3.87B
Discounted TV (PV)$1.63B
TV Weighting %51.9%
⚠️
Financial Model Disclaimer & Risk Disclosure: This interactive scenario simulator is an educational sandbox provided strictly for informational and analytical research purposes. Core historical financial statements and consensus estimates are sourced directly via Financial Modeling Prep (FMP). All downstream outputs are entirely deterministic, hypothetical projections generated by combining automated mathematical formulas (including linear interpolation and Gaussian bell-curve decay models) with user-selected variables and third-party financial data inputs. Users assume all liability for trading decisions executed based on these sandbox calculations.

📘 Full Research Report

ℹ️

AI-Generated Research: This report is for informational purposes only.

📘 WHIRLPOOL CORP (WHR) — Investment Overview

🧩 Business Model Overview

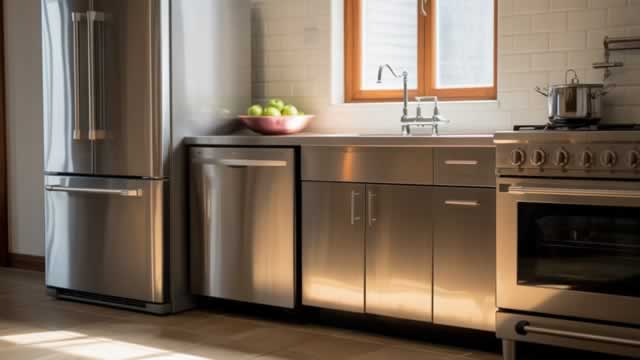
Whirlpool designs, manufactures, and sells home appliances across major categories including laundry, refrigerators/freezers, dishwashers, and cooking. The business monetizes through a direct and indirect distribution network that moves appliances to retailers and, in some channels, to builders and contractors. After-sale revenue is supported by a service and parts ecosystem (repairs, replacement components, and service labor), which helps retain customers over the multi-year lifespan of installed appliances.

💰 Revenue Streams & Monetisation Model

Revenue is primarily transactional: appliance unit sales driven by replacement cycles, new household formation, and building activity. Monetisation also includes recurring or quasi-recurring elements through service work and parts, which tend to be less cyclical than core appliance demand. Margin structure depends on (1) production cost position (labor productivity, factory utilization, and sourcing terms), (2) mix shift toward higher-priced segments and margin-accretive product features, (3) logistics and working-capital efficiency, and (4) commodity and input costs (notably steel and compressors) alongside foreign exchange impacts.

🧠 Competitive Advantages & Market Positioning

Whirlpool’s durability is anchored more in operating and distribution strengths than in software-like lock-in. The principal moats are:

  • Switching costs via installed base and service coverage: Consumers typically keep appliances for years; the existing installed base supports demand for parts and service, which reduces customer friction and supports aftermarket economics.
  • Cost advantages from scale and global manufacturing footprint: Competitors face similar demand cycles, so relative margin performance often reflects execution in manufacturing efficiency, procurement, and logistics.
  • Distribution leverage with retailers and builders: Scale purchasing and commercial relationships support shelf space, promotional discipline, and the ability to place product efficiently across regions.

Competitive benchmarking (industry peers): Whirlpool competes with Haier, LG Electronics, and Electrolux in major appliance categories and geographies. Compared with these rivals, Whirlpool’s positioning emphasizes durable brand franchises in core markets and a focus on operational execution—manufacturing efficiency, sourcing, and service enablement—rather than a strategy dependent on rapid technology-led product differentiation alone.

🚀 Multi-Year Growth Drivers

  • Replacement-cycle expansion from energy-efficiency standards: Regulatory requirements and consumer utility incentives increase the economic case for upgrading older appliances, supporting long-run unit demand.
  • Emerging-market penetration and formal retail/distribution growth: Long-run appliance ownership per household rises as incomes increase and distribution networks deepen.
  • Category mix shift: Higher-value features (efficiency, connectivity options, and premium design attributes) can improve average selling prices and profitability when production is aligned to demand.
  • Service and parts attach opportunities: As the installed base grows, aftermarket revenue can provide steadier cash flows relative to appliance-only cycles.

⚠ Risk Factors to Monitor

  • Demand cyclicality and promotional intensity: Appliance markets track housing and consumer discretionary spending; downturns can pressure volumes and pricing.
  • Input cost volatility and supply-chain execution: Steel, compressors, and freight costs can swing margins; working-capital discipline and inventory management become critical.
  • Competitive pricing and capacity actions: Global players can use aggressive pricing or capacity utilization to defend share, affecting industry profitability.
  • Regulatory and product compliance costs: Energy-efficiency, safety, and labeling requirements can increase engineering and manufacturing complexity.
  • Technology and product-cycle risk: Consumer expectations for reliability, connected features, and user experience can shift faster than planned product roadmaps.

📊 Valuation & Market View

Market valuation typically reflects the sector’s operating leverage and cyclicality, often using EV/EBITDA and enterprise value-to-earnings frameworks. Key valuation drivers include (1) margin sustainability driven by cost position and mix, (2) the ability to maintain pricing discipline through promotions and channel normalization, (3) inventory and working-capital behavior, and (4) aftermarket/service contribution relative to appliance-only earnings. A persistent view of resilient aftermarket economics and strong manufacturing execution generally supports a higher multiple than a purely volume-driven assessment.

🔍 Investment Takeaway

Whirlpool’s investment case rests on durable operating moats—scale-driven cost advantages, distribution leverage, and customer stickiness supported by the installed base and aftermarket service/parts. Over a full cycle, the company’s ability to defend margins through procurement discipline and product/mix execution can translate replacement and ownership growth into attractive long-term cash generation, despite appliance demand cyclicality.


⚠ AI-generated — informational only. Validate using filings before investing.

📰 Market News & Coverage

15 Stories Available

Real-time institutional reporting and market updates for WHR.

zacks.com2026-06-05

Whirlpool (WHR) Down 17% Since Last Earnings Report: Can It Rebound?

Whirlpool (WHR) reported earnings 30 days ago. What's next for the stock?

prnewswire.com2026-06-04

INVESTOR ALERT: Pomerantz Law Firm Investigates Claims On Behalf of Investors of Whirlpool Corporation - WHR

NEW YORK, June 4, 2026 /PRNewswire/ -- Pomerantz LLP is investigating claims on behalf of investors of Whirlpool Corporation ("Whirlpool" or the "Company") (NYSE: WHR). Such investors are advised to contact Danielle Peyton at newaction@pomlaw.com or 646-581-9980, ext.

zacks.com2026-06-02

Whirlpool (WHR) Stock Dips While Market Gains: Key Facts

Whirlpool (WHR) closed the most recent trading day at $41.01, moving 3.37% from the previous trading session.

prnewswire.com2026-06-02

Whirlpool Announces Upsize and Pricing of Offering of Secured Notes

BENTON HARBOR, Mich., June 2, 2026 /PRNewswire/ -- Whirlpool Corporation (NYSE: WHR) ("Whirlpool" or the "Company") announced today that it priced its offering of $1.0 billion in aggregate principal amount of 7.500% Senior Secured Second Lien Notes due 2031 (the "2031 Notes") and $1.0 billion in aggregate principal amount of 7.875% Senior Secured Second Lien Notes due 2034 (the "2034 Notes" and, together with the 2031 Notes, the "Notes").

globenewswire.com2026-06-02

INVESTOR ALERT: Pomerantz Law Firm Investigates Claims On Behalf of Investors of Whirlpool Corporation - WHR

NEW YORK, June 02, 2026 (GLOBE NEWSWIRE) -- Pomerantz LLP is investigating claims on behalf of investors of Whirlpool Corporation (“Whirlpool” or the “Company”) (NYSE: WHR).  Such investors are advised to contact Danielle Peyton at newaction@pomlaw.com  or 646-581-9980, ext. 7980.

prnewswire.com2026-06-01

Whirlpool Announces Tender Offer and Consent Solicitation for Outstanding Notes Due 2026 and 2027

/PRNewswire/ -- Whirlpool Corporation (NYSE: WHR) ("Whirlpool" or the "Company") announced today that it has commenced a tender offer (the "Tender Offer") to

prnewswire.com2026-06-01

Whirlpool Announces Offering of Secured Notes

BENTON HARBOR, Mich., June 1, 2026 /PRNewswire/ -- Whirlpool Corporation (NYSE: WHR) ("Whirlpool" or the "Company") announced today that it is planning to offer, subject to market conditions and other factors, $750 million in aggregate principal amount of Senior Secured Second Lien Notes due 2031 (the "2031 Notes") and $750 million in aggregate principal amount of Senior Secured Second Lien Notes due 2034 (the "2034 Notes" and, together with the 2031 Notes, the "Notes").

prnewswire.com2026-05-28

INVESTOR ALERT: Pomerantz Law Firm Investigates Claims On Behalf of Investors of Whirlpool Corporation - WHR

NEW YORK, May 28, 2026 /PRNewswire/ -- Pomerantz LLP is investigating claims on behalf of investors of Whirlpool Corporation ("Whirlpool" or the "Company") (NYSE: WHR).  Such investors are advised to contact Danielle Peyton at newaction@pomlaw.com or 646-581-9980, ext.

globenewswire.com2026-05-26

INVESTOR ALERT: Pomerantz Law Firm Investigates Claims On Behalf of Investors of Whirlpool Corporation - WHR

NEW YORK, May 26, 2026 (GLOBE NEWSWIRE) -- Pomerantz LLP is investigating claims on behalf of investors of Whirlpool Corporation (“Whirlpool” or the “Company”) (NYSE: WHR).  Such investors are advised to contact Danielle Peyton at newaction@pomlaw.com  or 646-581-9980, ext. 7980.

gurufocus.com2026-05-21

Whirlpool Corp (WHR) Stock Up 4.1% and Still Undervalued -- GF Score: 54/100

On May 21, 2026, Whirlpool Corp (WHR) shares rose 4.1% today, closing at $43.21. This move comes amid a challenging year for the company, as shares have dropped

prnewswire.com2026-05-21

INVESTOR ALERT: Pomerantz Law Firm Investigates Claims On Behalf of Investors of Whirlpool Corporation - WHR

NEW YORK, May 21, 2026 /PRNewswire/ -- Pomerantz LLP is investigating claims on behalf of investors of Whirlpool Corporation ("Whirlpool" or the "Company") (NYSE: WHR). Such investors are advised to contact Danielle Peyton at newaction@pomlaw.com or 646-581-9980, ext.

globenewswire.com2026-05-19

INVESTOR ALERT: Pomerantz Law Firm Investigates Claims On Behalf of Investors of Whirlpool Corporation - WHR

NEW YORK, May 19, 2026 (GLOBE NEWSWIRE) -- Pomerantz LLP is investigating claims on behalf of investors of Whirlpool Corporation (“Whirlpool” or the “Company”) (NYSE: WHR).  Such investors are advised to contact Danielle Peyton at newaction@pomlaw.com  or 646-581-9980, ext. 7980.

247wallst.com2026-05-17

Whirlpool's CEO Warns Consumer Spending Today Looks Like the 2008 Financial Crisis

Whirlpool (NYSE:WHR | WHR Price Prediction) CEO Marc Bitzer is making one of the bluntest recession comparisons of this earnings cycle.

globenewswire.com2026-05-17

WHR Investors Have Opportunity to Join Whirlpool Corporation Fraud Investigation with the Schall Law Firm

LOS ANGELES, May 17, 2026 (GLOBE NEWSWIRE) -- The Schall Law Firm, a national shareholder rights litigation firm, announces that it is investigating claims on behalf of investors of Whirlpool Corporation ("Whirlpool" or "the Company") (NYSE: WHR) for violations of the securities laws.

globenewswire.com2026-05-17

WHR Investors Have Opportunity to Join Whirlpool Corporation Fraud Investigation with the Schall Law Firm

LOS ANGELES, May 17, 2026 (GLOBE NEWSWIRE) -- The Schall Law Firm, a national shareholder rights litigation firm, announces that it is investigating claims on behalf of investors of Whirlpool Corporation (“Whirlpool” or “the Company”) (NYSE: WHR) for violations of the securities laws. The investigation focuses on whether the Company issued false and/or misleading statements and/or failed to disclose information pertinent to investors.

📊 AI Financial Analysis

Powered by StockMarketInfo
Earnings Data: Q Ending 2026-03-31

"Windsor (WHR) reported Q1’26 revenue of $3.273B and gross margin of 12.7%. Net income was $0 with EPS of -$1.43 (negative), alongside an operating income of $56M (1.7% margin) but a sharply negative bottom-line after other income/expense and tax line items. QoQ, revenue fell from $4.098B in Q4’25 to $3.273B (-20.2%), while operating income declined from $144M to $56M (-61.1%). Gross margin also compressed slightly (14.0% to 12.7%). Profitability is weaker versus last quarter, and the reported net income deterioration is material (Q4’25 net income $108M to Q1’26 $0; EPS swung to negative). YoY, revenue decreased versus Q1’25’s $3.621B (-9.6%). Operating income declined from $188M to $56M (-70.2%), and net income moved from $72M to $0 (a decline of 100%). Over the quarter set, WHR’s margins have generally been range-bound to contracting in the most recent quarter. Cash flow in Q1’26 was negative: operating cash flow was -$827M and free cash flow was -$895M, indicating a working-capital and non-cash drag. Balance sheet resilience remains mixed: total assets were $16.18B with equity of $3.78B, but leverage is elevated with net debt around $6.48B. Total shareholder returns are pressured given price momentum is negative (1Y change -26.6%). Dividend/buyback signals were not evidenced in this quarter’s cash flow (dividends paid $0; repurchases $0). Analyst valuation context is also modest versus price targets (consensus target $55 vs. $56.83 current)."

Revenue Growth

Neutral

Q1’26 revenue was $3.273B, down 20.2% QoQ from $4.098B and down 9.6% YoY from $3.621B; trend is weakening.

Profitability

Neutral

Operating margin fell from 3.5% (Q4’25) to 1.7% (Q1’26) and net margin deteriorated from 2.6% to 0%; YoY net income fell from $72M to $0.

Cash Flow Quality

Neutral

Q1’26 operating cash flow was -$827M and free cash flow -$895M, versus positive OCF in Q4’25 ($1.15B); dividend and buyback cash flows were $0 this quarter.

Leverage & Balance Sheet

Caution

Assets were stable-ish at $16.18B, equity was $3.78B, but leverage remains high with total debt ~$7.10B and net debt ~$6.48B.

Shareholder Returns

Neutral

Price momentum is negative: 1Y change -26.6% and no clear dividend/repurchase support in Q1’26 cash flow.

Analyst Sentiment & Valuation

Fair

Consensus target is $55 vs. current ~$56.83 (slightly below), implying limited upside; no strong valuation catalyst in the provided data.

Disclaimer:This analysis is AI-generated for informational purposes only. Accuracy is not guaranteed and this does not constitute financial advice.

Fundamentals Overview

Loading fundamentals overview...

WHR’s Q1 2026 results reflect a macro-driven demand and pricing shock rather than a collapse in underlying operational actions. Ongoing EBIT margin was 1.3% and EPS was -$0.56, with ~$0.32 of EPS hurt from a Beko Europe noncash minority-interest loss. Management’s margin deterioration is quantified: price/mix -275 bps, net cost -175 bps, partially offset by favorable marketing/technology and currency (+100 bps total). The company is countering with the largest price increase in over a decade: a >10% promotional price map in effect in Q2 and an additional ~4% lease price increase effective July 9. They also accelerate vertical integration/automation and footprint optimization, guiding >$150M cost takeout in 2026 and structural inventory improvements. 2026 outlook is cautious but specific: ~1.5% revenue growth, ~4% EBIT margin, and >$300M free cash flow, while forecasting North America demand down ~5% full year amid Section 232 tariff regime changes.

AI IconGrowth Catalysts

  • UV laundry tower (Whirlpool branded) rollout with industry-first UV cleaning technology; exceeding expectations and capturing ~5 points of share within weeks
  • Kitchen intelligent wall oven with intelligent cooking camera; Best of Show award; selling through toward highest market share level in over a decade
  • KitchenAid suite momentum (began shipping late last year); strong sell-out performance despite softer industry
  • SDA Global: continued direct-to-consumer growth supporting ~10% net sales growth (ex-currency) and 250 bps EBIT margin expansion

Business Development

  • Strategic investment in Peres Group, Ohio (named in cost/vertical integration plan)
  • Modernization and footprint changes: Perrysburg, Ohio production facility; shift production from Pilar, Argentina to Rio Claro, Brazil
  • Equity offering raised ~$1.1B; proceeds used for debt paydown and accelerating vertical integration/automation

AI IconFinancial Highlights

  • Q1 2026 ongoing EBIT margin: 1.3%; ongoing EPS: -$0.56
  • EPS impacted by ~$0.32 noncash loss tied to minority interest in Beko Europe B.V. (and management stated no further losses will be recognized based on current carrying value)
  • Margin walk: price/mix -275 bps; net cost -175 bps YoY; raw materials -50 bps; tariffs neutral in Q1; marketing/technology +50 bps; currency +50 bps; transaction impacts -50 bps (Beko noncash loss)
  • Revenue/volume: MDA North America net sales -8% YoY to $2.2B; company drove ~20% YoY volume reduction
  • Free cash flow: -$896M (inventory reduction benefits outweighed by lower earnings)
  • Capex: guidance $400M for 2026 (no Q1 capex details provided in transcript)

AI IconCapital Funding

  • Strategic equity offering raised ~ $1.1B
  • Debt: expects to pay down >$900M in 2026; target long-term debt below $5B
  • Liquidity/credit: amending credit facility to reduce available line from $3.5B to ~$2.25B effective in May; process ongoing to close next credit facility
  • Dividends: pausing quarterly dividend starting in Q2 (to preserve balance-sheet capacity for debt paydown and organic growth)
  • Q1 cash return: paid $0.90 dividend per share in the quarter

AI IconStrategy & Ops

  • Largest price increase in more than a decade executed in two steps on April 17: promotional price map increase >10% in effect in Q2; lease price increase effective July 9 adding ~4%
  • Accelerating $115M cost-saving target in 2026 supported by design-to-value engineering
  • Vertical integration/automation and manufacturing/logistics footprint optimization expected to unlock ~$40M savings in 2026 plus supply chain resiliency improvements
  • Renewed strategic sourcing: completed phase one; expect ~$15M savings in 2026
  • Additional corporate fixed-cost actions: expect ~$20M in sales (details to be shared near future)
  • Manufacturing investment: $60M Perrysburg, Ohio facility; expected ~ $30M annualized EBIT benefit
  • Factory actions: Armada, Iowa modernization expected ~$70M annualized EBIT benefit; Rio Claro, Brazil shift (from Argentina) expected ~$20M annualized EBIT benefit

AI IconMarket Outlook

  • 2026 like-for-like revenue growth: ~1.5%
  • 2026 ongoing EBIT margin: expects ~70 bps ongoing contraction to full-year ~4%
  • 2026 free cash flow: >$300M (~2% of net sales) driven by structural inventory optimization
  • 2026 ongoing EPS: $3 to $3.50; includes ~$1 impact from equity offering and ~$1 from adjusted effective tax rate ~25% (increase vs 2025)
  • Industry demand: global down ~3% in 2026; North America down ~5% full year
  • Tariff/Section 232: management emphasized April updates; also clarified these expectations reflect currently announced tariffs and do not factor future/potential trade policy changes

AI IconRisks & Headwinds

  • Consumer sentiment at lowest in 50 years; management cited war in Iran contributing to U.S. consumer sentiment index plunging to lowest on record in March
  • Category demand shock: U.S. appliance industry demand down 7.4% in Q1; March down 10% (last similar seen during global financial crisis)
  • Promotional environment volatility tied to IEEPA/Supreme Court dynamics; management expects aggressive promotions to resume after the IEEPA ruling due to skepticism and anticipated refunds
  • Cost inflation pressure: steel/base metals/resins; current/projected steel costs at maximum pricing of long-term steel agreements; raw materials -50 bps and updated guidance includes ~75 bps raw-material headwind
  • Tariff cost headwind: expects ~175 bps negative impact from tariff announced in 2025 and updated in April 2026, with additional Section 232 appliance costs

Q&A: Analyst Interest

  • Consumer volatility vs other categories: Management attributed appliance demand drop to appliances being a big-ticket discretionary purchase tied to consumer confidence (not $50 items). They cited Q1 industry demand -7.4% with March -10%, plus “spare parts and repair” resilience indicating consumers delay replacements, supporting a laggy recovery.
  • North America Q2 and back-half margin trajectory: Management would not give specific Q2 margin guidance, but linked margin recovery to (1) consumer-visible pricing sticking in the first two weeks after April 17 actions, (2) PMAP >10% already effective, (3) promo participation reduction, and (4) delayed/trailing promotion cost effects flowing into Q2.
  • Price execution mechanics and timing: Management described the multi-tier plan—promo price map increase >10% now, then list/lease price increases effective July 9 (~additional 4%). They emphasized retail pricing differs from bottom-line timing because Q1 still carried trailing promotion investments from prior periods.

Sentiment: CAUTIOUS

Note: This summary was synthesized by AI from the WHR Q1 2026 earnings transcript. Financial data is complex; please verify all metrics against official SEC filings before making investment decisions.

📋 Official Regulatory 10-K / 10-Q SEC Filings

Direct authenticated documentation links to audited SEC database reports for WHR.

SEC EDGAR Live Feed
Loading financial data and tables...
📁

SEC Filings (WHR)

© 2026 Stock Market Info — Whirlpool Corporation (WHR) Financial Profile