Westlake Corporation

Westlake Corporation (WLK) Market Cap

Westlake Corporation has a market capitalization of .

No quote data available.

CEO: Jean-Marc Gilson

Sector: Basic Materials

Industry: Chemicals - Specialty

IPO Date: 2004-08-12

Website: https://www.westlake.com

Westlake Corporation (WLK) - Company Information

Market Cap: -|Sector: Basic Materials

Company Profile

Westlake Corporation manufactures and supplies petrochemicals, polymers, and building products worldwide. It operates through two segments, Performance and Essential Materials; and Housing and Infrastructure Products. The Performance and Essential Materials segment manufactures and markets polyethylene, styrene monomer, ethylene co-products, PVC, VCM, ethylene dichloride chlor-alkali, and chlorinated derivative products. The Housing and Infrastructure Products segment manufactures and sells residential PVC siding; PVC trim and moldings; roofing applications; decorative stone; windows; PVC decking; PVC films for various inflatables, wallcovering, tape, and roofing applications; polymer composite roof tiles; PVC pipe and fittings; PVC compounds; and various consumer and commercial products such as landscape edging; industrial, home and office matting; marine dock edging; and masonry joint controls. The company offers its products to a range of customers, including chemical processors, plastics fabricators, small construction contractors, municipalities, and supply warehouses for use in various consumer and industrial markets, including residential construction, flexible and rigid packaging, automotive products, healthcare products, water treatment, and coatings, as well as other durable and non-durable goods. The company was formerly known as Westlake Chemical Corporation and changed its name to Westlake Corporation in February 2022. The company was founded in 1986 and is headquartered in Houston, Texas. Westlake Corporation is a subsidiary of TTWF LP.

Analyst Sentiment

63%
Buy

From 14 Active Polls

1Y Forecast: $116.33

▲ +0.0% Potential Upside

Consensus Target Metrics

Low Bound

$88

Median

$116

High Bound

$145

Average

$116

Price & Moving Averages

Loading chart...

🎯 Wall Street Analyst Intelligence Report

1-Year structural target targets, chart projections, and sentiment maps.

Average 1Y Target
$116.33
▲ +37.44% Upside
Low Target
$88.00
4% Risk
Median Target
$116.00
37% Mid
High Target
$145.00
71% Max

Consensus Trend Projection

Trailing closures vs. 12-month metrics map.

Analyst Vote Distribution

Aggregate institutional coverage sentiment weights.

Sentiment volume allocation data unavailable.

Historical valuation matrix unavailable.

📘 Full Research Report

ℹ️

AI-Generated Research: This report is for informational purposes only.

📘 WESTLAKE CORP (WLK) — Investment Overview

🧩 Business Model Overview

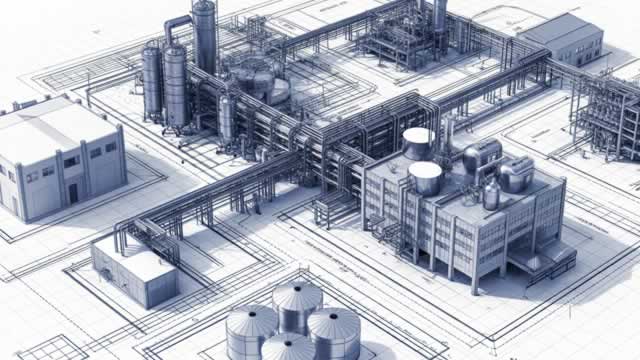
Westlake Corp operates as an integrated producer of core vinyl and olefin-derived materials, with downstream processing that turns commodity feedstocks into higher-specification products used across construction, industrial applications, and packaging. The value chain centers on (1) manufacturing basic chemical intermediates (notably ethylene and related chemicals), (2) converting them into PVC and vinyl-related products, and (3) selling those products into end-markets where formulation, regulatory/quality requirements, and dependable supply matter. Integration and multi-step processing reduce reliance on spot purchases for key inputs and improve the economics of converting low-cost feedstock into finished goods.

💰 Revenue Streams & Monetisation Model

Revenue is primarily generated from the sale of vinyls and vinyl-related products, along with engineered products that draw from the same manufacturing platform and know-how. Monetisation is largely transactional—pricing varies with commodity spreads and end-demand—but margin structure is supported by operational leverage and integration. Key margin drivers include: (1) the ethane/ethylene-to-vinyl spread (feedstock vs. product pricing), (2) plant utilization and reliability (fixed-cost absorption), (3) product mix across commodity and higher-value specifications, and (4) cost control in energy, maintenance, logistics, and freight.

The model can be viewed as cyclical at the top line (driven by petrochemical cycles) while the profit engine is determined by relative cost position and conversion efficiency across the value chain.

🧠 Competitive Advantages & Market Positioning

Core moat: Geographic cost advantage and integrated conversion economics. For North American vinyl and olefin producers, the dominant structural edge is the ability to source favorable feedstock and convert it into downstream products with cost-effective manufacturing footprint. Westlake’s positioning benefits from having major production facilities concentrated in regions where low-cost hydrocarbon feedstock and existing industrial infrastructure support competitive cost per unit.

Why it is hard to displace: Building an integrated, cost-competitive chemical complex requires substantial capital, long lead times, permitting expertise, specialized process knowledge, and an established supply chain for inputs and logistics for outputs. Competitors can add capacity, but matching an incumbent’s integrated cost structure and operational maturity is difficult. For customers, supplier qualification, quality consistency, and supply reliability also create practical friction against frequent switching—especially for applications requiring compliance and stable performance.

Competitive benchmarking (industry peers):

  • Formosa Plastics (vinyl chain and PVC/related production) — generally compares via vinyl capacity and regional cost structures; Westlake differentiates through its integrated North American cost position and downstream reach across multiple engineered products.
  • Shintech (PVC-focused in North America) — competes on manufacturing footprint and access to favorable logistics and feedstock; Westlake’s competitive posture is strengthened by a broader manufacturing platform and conversion efficiency across chemical intermediates to finished products.
  • LyondellBasell (broader olefins/polyolefins and large-scale chemicals) — competes on scale and integration, but Westlake’s emphasis is more concentrated on the vinyl and engineered products value chain where cost and conversion discipline can translate into durable relative margins.

🚀 Multi-Year Growth Drivers

Over a 5–10 year horizon, growth is shaped less by market share expansion in a structurally mature sector and more by capacity additions, normalized cycle performance, and operating execution. Key drivers include:

  • North American demand resilience for vinyl and engineered building-related materials: Construction and industrial replacement cycles sustain structural demand, with long-lived usage characteristics in many applications.
  • Industrial and building stock renewal: Vinyl-based and related engineered materials often participate in replacement and retrofit dynamics, supporting demand durability even through periodic downturns.
  • Capacity rationalization and utilization discipline: In petrochemical markets, value frequently accrues to producers that can manage maintenance schedules, debottleneck selectively, and sustain utilization during downturns.
  • Margin expansion from mix and downstream conversion: Incremental improvements in conversion efficiency and product mix can outperform pure commodity producers.
  • Strategic investment in logistical and operational infrastructure: In chemicals, transport efficiency, terminal access, and reliability materially affect delivered cost and customer service levels, reinforcing the economic moat.

⚠ Risk Factors to Monitor

  • Commodity cycle risk: Petrochemical margins are sensitive to spreads between feedstock and product pricing; downturns can pressure profitability even with good cost positioning.
  • Feedstock and energy price volatility: The cost advantage depends on sustained favorable differentials; changes in natural gas/condensate dynamics or competing feedstocks can erode the spread.
  • Capacity additions and competitive intensity: New supply in PVC and related chains can lead to price compression and lower utilization.
  • Regulatory and environmental compliance: Emissions controls, permitting requirements, and waste/effluent standards can increase costs or constrain operating schedules.
  • Capital intensity and execution risk: Chemical manufacturing relies on large projects with long lead times; construction delays, commissioning issues, or cost overruns can impair returns.

📊 Valuation & Market View

Chemical equities are typically valued on an enterprise value basis relative to earnings power—commonly using EV/EBITDA—because the business exhibits cycle-driven earnings variability. The market generally focuses on drivers such as (1) through-cycle cost position and integration benefits, (2) ability to sustain utilization and manage maintenance, (3) net leverage and access to liquidity, and (4) credibility of capital allocation toward projects that maintain or improve relative unit economics. In practice, valuation tends to expand when investors believe spreads will be supported for longer, operational discipline will persist, and incremental capacity will not overwhelm the demand balance.

🔍 Investment Takeaway

Westlake’s long-term case rests on a structurally advantaged cost and conversion model in North American vinyl and related chemical production, supported by integrated manufacturing, geographic infrastructure, and operational execution. While the industry remains cyclical, the durability of Westlake’s relative economics—driven by feedstock advantage, scale, and conversion depth—provides a rational foundation for steady compounding across cycles, assuming disciplined capacity management and rigorous compliance and capital execution.


⚠ AI-generated — informational only. Validate using filings before investing.

📊 AI Financial Analysis

Powered by StockMarketInfo
Earnings Data: Q Ending 2026-04-02

"WLK (latest: 2026-04-02, Q1) reported Revenue of $2.65B and Net Income of -$169M, with EPS of -$1.31. YoY, Revenue declined to $2.65B from $2.846B (down ~6.8%), while Net Income loss narrowed from -$40M to -$169M (net income deteriorated ~+322% vs. last year). QoQ, Revenue rose from $2.533B in 2025-12-31 (up ~4.7%), but Net Income fell further from -$544M to -$169M (an improvement of ~+69%). Profitability remains weak: gross margin improved to ~4.2% from -17.3% in Q4, and the net margin improved to about -6.4% from -21.5% QoQ, indicating material cost/revenue normalization versus the prior quarter. Cash flow quality is mixed. Operating cash flow was -$94M and free cash flow was -$303M, both indicating cash burn in the quarter. Balance sheet resilience is better on liquidity: cash & short-term investments were $2.48B at 2026-04-02, down from $2.93B QoQ, while total assets were ~ $19.71B. Leverage appears lower than Q4, with total debt of $0.50B versus $6.44B previously (likely large quarter-end reclassification/repayment effects). Shareholder return looks supportive: the stock is up ~24.7% over 1Y (capital appreciation tailwind), and the dividend yield is ~0.45%, providing limited offset to losses."

Revenue Growth

Caution

QoQ Revenue increased ~4.7% ($2.53B to $2.65B), but YoY Revenue decreased ~6.8% ($2.85B to $2.65B), indicating still-weak year-over-year demand.

Profitability

Neutral

Net loss narrowed QoQ (Net Income -$544M to -$169M; improvement ~69%), and net margin improved to ~-6.4% from -21.5%. However, YoY Net Income worsened materially (from -$40M to -$169M).

Cash Flow Quality

Neutral

Operating cash flow was -$94M and free cash flow was -$303M in the latest quarter, reflecting cash burn despite an improved accounting margin profile vs. Q4.

Leverage & Balance Sheet

Positive

Total assets were stable (~$19.71B). Liquidity remains substantial (cash & ST investments ~$2.48B). Leverage appears lower vs Q4 with total debt $0.50B vs $6.44B, and net debt is negative (-$1.78B), suggesting capacity to fund operations, though quarter-end movements may reflect timing/reclassification.

Shareholder Returns

Positive

1Y price change is +24.7%, a strong momentum tailwind. Dividend yield is ~0.45% and buybacks are not evident in the cash flow, so total return is likely driven mostly by price appreciation.

Analyst Sentiment & Valuation

Fair

Current price ~$112.61 vs consensus target ~$109.57 implies modest upside/near-term valuation is roughly in-line. However, profitability losses keep valuation sensitive.

Disclaimer:This analysis is AI-generated for informational purposes only. Accuracy is not guaranteed and this does not constitute financial advice.

Fundamentals Overview

Loading fundamentals overview...

So What? Westlake delivered a Q1 earnings inflection driven by the 3-pillar profitability program and an abrupt PEM backdrop shift from the Middle East conflict, which tightened polymer/energy supply and raised North America value capture. However, margins remain pressured by timing mismatches: PVC cost increases (including winter gas) did not fully catch up with realized prices in Q1, and management expects pricing pass-through lags to weigh on HIP/PIM margins in early Q2. The company still targets $600M EBITDA uplift in 2026, and reliability is improving from a low base, including epoxy returning to profitability. Balance sheet flexibility is intact (cash/investments $2.5B; debt $5.6B) with a planned $500M debt call in Q2 and $900M capex. Guidance narrows to lower-end 2026 HIP revenue and EBITDA margin ranges, reflecting slower homebuilding season starts and elevated transportation/PVC input costs.

AI IconGrowth Catalysts

  • PEM price/margin momentum driven by Middle East conflict supply disruptions: management cites ~10%–15% disruption to global polyethylene and ~5% disruption to global PVC resin, plus up to ~20% disruption to global oil supply reducing NAFTA availability
  • Improving PAM/polimercell profitability and operating rates toward end of quarter as supply disruptions persist and North America sourcing demand rises
  • HIP sequential improvement in March driven by weather normalization and homebuilding season starting; growth also supported by infrastructure spending and data center build-out (cooling water demand)
  • ~$150 million EBITDA uplift in Q1 from the 3-pillar profitability improvement plan (footprint optimization, cost savings, reliability initiatives)

Business Development

  • Nonbinding letter of intent to acquire a PVC and VCM plant in Billman, Germany (North Sea Coast; advantageous logistics for low-cost feedstocks)
  • ACI acquisition referenced as supporting global compounds performance and strengthening position in high-voltage wire and cable market (electric vehicle and data center demand tailwind)

AI IconFinancial Highlights

  • Reported Q1 net sales of $2.7B; reported net loss of $100M (loss per share $0.77), versus net loss of $33M in Q1 2025
  • Underlying EBITDA and profitability exclude identified items: $67M settlement of certain legal claims in the pipe and fittings business plus $18M shutdown-related expenses (aggregate $85M); non-GAAP used for operational commentary
  • Management cited Q1 segment performance: PEM net sales $1.7B; PEM EBITDA $36M with 3% sequential volume growth excluding 2025 plant shutdown impacts; HIP net sales $1.0B; HIP EBITDA $186M
  • HIP EBITDA down $17M YoY due to lower average sales price and slightly lower EBITDA margin; sequentially HIP sales +10% with volume +15% and average sales price -5%
  • PIMS EBITDA $36M in Q1; -$9M QoQ largely due to ~34% higher natural gas price from cold weather early in quarter
  • FIFO vs LIFO accounting provided favorable pretax impact of ~$37M in Q1 (estimate, unaudited)
  • Q1 profitability improvement plan delivered approximately $150M EBITDA uplift; CFO/CEO emphasized improved epoxy business profitability after footprint actions
  • Guidance midpoint shift: 2026 HIP revenue and EBITDA margin now toward lower end—HIP revenue $4.4B–$4.6B with EBITDA margin 19%–21% (excluding identified items), citing slower homebuilding season and higher transportation/raw material costs (especially PVC resin)

AI IconCapital Funding

  • Cash and investments: $2.5B as of March 31, 2026; total debt: $5.6B
  • In April, company gave notice to call remaining $500M of debt in Q2 2026 that was otherwise scheduled to mature later in 2026
  • Net cash used for operating activities: $94M in Q1, including ~$50M cash outlays associated with 2025 footprint optimization actions
  • 2026 total capital expenditures expected to be $900M (about $100M lower than 2025), aligned with annual depreciation
  • Cash interest expense expected to be ~$215M for 2026
  • Management stated that despite higher prices increasing receivables, it expects Q2 to generate free cash flow (implied working capital benefit with moderate gas/ethane costs)

AI IconStrategy & Ops

  • 3-pillar profitability improvement plan on track: footprint optimization reduced PEM fixed costs and returned epoxy to profitability; cost savings + reliability initiatives contributed to Q1 ~$150M EBITDA uplift
  • Plant reliability: management says improved operability but still not at desired end-state; reliability initiatives are part of achieving the targeted $600M EBITDA uplift in 2026
  • PVC/HIP pricing actions announced to offset higher PVC resin and transportation/fuel costs; pricing lags expected to create near-term margin pressure
  • Utilization/operability commentary: polyethylene run rates described as full; PVC operating rates mid-80s, expected to elevate into Q2/Q3 peak construction season with caustic/chlorine operations supporting PVC
  • Shutdown/closures impact: identified items include $18M shutdown-related expenses in Q1; PIM/PVC volumes adjusted for 2025 plant shutdown effects when describing sequential growth

AI IconMarket Outlook

  • 2026 HIP guidance: revenue $4.4B–$4.6B; EBITDA margin 19%–21% (excluding identified items), toward lower end of previously communicated range
  • Guidance drivers: slower-than-expected homebuilding season start plus significant transportation and raw material cost increases (particularly PVC resin); management expects cost pass-through but timing may create near-term headwind
  • Management expects Middle East-related supply disruptions could persist throughout 2026
  • Order book/near-term demand: CFO stated HIP order book “looks very good” as Q2 begins from a volumes perspective

AI IconRisks & Headwinds

  • Near-term transitory margin headwinds from elevated North American natural gas costs due to unusually cold weather: cited ~$45M EBITDA headwind for PIM vs Q1 2025; Q1 PIM also impacted by ~34% higher natural gas price QoQ
  • PVC price realization lags versus cost increases: stated that announced price increases are not fully recognized across the entire quarter; potential month-to-2-month lag between HIP/PIM price nominations and PVC resin roll-forward
  • Lower sequential PVC-related margin than cost increases because PVC pricing “has not been fully catching up” with associated costs (notably elevated natural gas costs in January/February)
  • HIP demand uncertainty tied to housing affordability pressures from mortgage rates and increased building costs; management cited uncertainty using indicators like single-family housing permits and starts
  • Export/destination logistics volatility tied to Gulf conflict: management described logistics being “jocking around,” without quantifying customer-level effects

Q&A: Analyst Interest

  • PEM sequential drivers and stranded cost/reliability: Management explained PVC price resets at end of 2025 were impactful, but PVC margin hadn’t fully captured cost increases, especially elevated January–February natural gas. They also said improved reliability/operability reduces stranded-cost concerns, though improvements are not yet at target levels.
  • HIP margin lag from PVC/transport pass-through: Management described a 1–2 month lag between announced HIP price nominations and how PVC resin pricing rolls through into realized margins. They indicated Q2 could show headwind in the front half, with better benefit by Q3; Q4 typically seasonally slower.
  • PVC pricing path and numeric build for Q2 realization: Management provided an explicit PVC timing table: achieved $0.01 Jan, $0.02 Feb, $0.03 Mar; achieved $0.05 in April; nominated $0.04 for May, still seeking the full previously announced $0.10 across April–May via customer negotiations and continued traction.

Sentiment: MIXED

Note: This summary was synthesized by AI from the WLK Q1 2026 earnings transcript. Financial data is complex; please verify all metrics against official SEC filings before making investment decisions.

Loading financial data and tables...
© 2026 Stock Market Info — Westlake Corporation (WLK) Financial Profile