Select Water Solutions, Inc.

Select Water Solutions, Inc. (WTTR) Market Cap

Select Water Solutions, Inc. has a market capitalization of $1.91B.

Price: $18.34

-0.57 (-3.04%)

Market Cap: 1.91B

NYSE · time unavailable

CEO: John D. Schmitz

Sector: Utilities

Industry: Regulated Water

IPO Date: 2017-06-26

Website: https://www.selectwater.com

Select Water Solutions, Inc. (WTTR) - Company Information

Market Cap: 1.91B|Sector: Utilities

Company Profile

Headquartered in Gainesville, Texas, and established on November 21, 2016, Select Water Solutions, Inc. delivers specialized water management and chemical services. The company's operations are structured across three primary business units: Water Infrastructure, Water Services, and Chemical Technologies. Within its Water Infrastructure segment, the firm designs, builds, and manages both permanent and temporary infrastructural systems, addressing comprehensive water lifecycle management and waste treatment needs. The Water Services segment provides an array of offerings to exploration and production (E&P) companies, including water transfer, well flowback and testing, fluids transportation, containment solutions, and automated water network management. Finally, the Chemical Technologies segment is responsible for the logistics and supply of a diverse portfolio of chemicals crucial for applications like hydraulic fracturing, well stimulation, cementing operations, pipeline services, and well completions.

Analyst Sentiment

86%
Strong Buy

From 6 Active Polls

1Y Forecast: $22.00

▲ +20.0% Potential Upside

Consensus Target Metrics

Low Bound

$21

Median

$21

High Bound

$24

Average

$22

Price & Moving Averages

Loading chart...

🎯 Wall Street Analyst Intelligence Report

1-Year structural target targets, chart projections, and sentiment maps.

Average 1Y Target
$22.00
▲ +19.99% Upside
Low Target
$21.00
15% Risk
Median Target
$21.00
15% Mid
High Target
$24.00
31% Max
Consensus
Buy
13 / 15 Buys

Consensus Trend Projection

Trailing closures vs. 12-month metrics map.

Analyst Vote Distribution

Aggregate institutional coverage sentiment weights.

📊 Historical Valuation Multiples

Real-time Trailing Twelve Month (TTM) momentum side-by-side with discrete quarterly metrics.

Fiscal QuarterTTMQ1 2026Q4 2025Q3 2025Q2 2025Q1 2025Q4 2024Q3 2024Q2 2024
Period EndingTrailing 12MMar 31, 2026Dec 31, 2025Sep 30, 2025Jun 30, 2025Mar 31, 2025Dec 31, 2024Sep 30, 2024Jun 30, 2024
Market Cap ($M)1,9111,6851,0791,1111,0171,2291,5431,1441,260
Enterprise Value ($M)1,9401,7151,4141,4321,2781,4911,6561,2651,388
Price to Earnings Ratio (P/E)93.5448.96-779.77103.5623.8937.28-235.2618.1124.47
Price/Earnings-to-Growth Ratio (PEG)8.72-103.585.1410.64
Price to Sales Ratio (P/S)1.374.603.113.452.793.284.423.083.45
Price to Book Ratio (P/B)2.041.701.341.381.271.551.941.441.61
Price to Free Cash Flow Ratio (P/FCF)-20.21-24.73-178.47-47.23319.92-22.97121.5868.6337.05
Enterprise Value to Sales (EV/Sales)4.694.084.443.513.984.743.413.80
Enterprise Value to EBITDA (EV/EBITDA)8.9032.4729.7426.7319.9826.7139.1419.4523.64
Debt to Equity Ratio0.140.090.440.420.390.370.170.170.19

WTTR Growth Runway Model

Standard long term linear growth fade

Multi-Stage Discounted Cash Flow Sandbox

Market Price$18.34
Intrinsic Value$21.00
Market Alignment
Undervalued by 14.6%relative to calculated intrinsic value
9.00%
Exp: -0%-0%
i

Growth runway slowdown

This value provides a time window for the growth rate to decline beyond Stage 1 toward the terminal rate. Longer windows are most useful for companies with high growth starting conditions or strong competitive advantages. This option stretches out the growth rate slowdown across 5, 10, or 15-year steps. A high-growth starting condition (exceeding a 25% initial growth rate) automatically applies a curve decay to simulate realistic, rapid market saturation.
i

Terminal growth rate

With long-term inflation between 3-5%, revenue must grow by that baseline to maintain flat real-world market share. This value sets the permanent terminal growth rate to factor into the valuation beyond the growth slowdown runway toward maturity.

3-Stage Financial Runway Horizon

🧠 Perpetuity Horizon Engine (Stage 3: Post-2035)

Terminal FCF Base$0.15B
Perpetuity TV Value$2.73B
Discounted TV (PV)$1.16B
TV Weighting %58.0%
⚠️
Financial Model Disclaimer & Risk Disclosure: This interactive scenario simulator is an educational sandbox provided strictly for informational and analytical research purposes. Core historical financial statements and consensus estimates are sourced directly via Financial Modeling Prep (FMP). All downstream outputs are entirely deterministic, hypothetical projections generated by combining automated mathematical formulas (including linear interpolation and Gaussian bell-curve decay models) with user-selected variables and third-party financial data inputs. Users assume all liability for trading decisions executed based on these sandbox calculations.

📘 Full Research Report

ℹ️

AI-Generated Research: This report is for informational purposes only.

📘 SELECT WATER SOLUTIONS INC CLASS A (WTTR) — Investment Overview

🧩 Business Model Overview

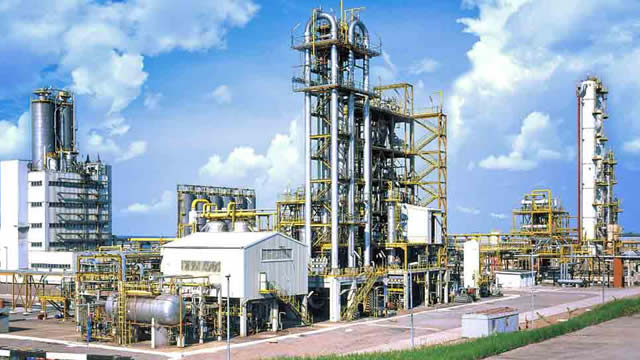
SELECT WATER SOLUTIONS INC Class A operates in the upstream energy value chain by providing produced-water logistics and treatment/recycling services. The process is typically volume-driven: produced water generated at oil and gas sites is collected, transported or staged using owned/operated assets (and logistics infrastructure), then treated to enable reuse in operations or disposed of where required. The business monetizes the gap between where water is produced and where it can be handled at the lowest operational cost—factoring in permitted disposal options, treatment capacity, and the physical distance between well sites and end-use or disposal points.

The customer experience is shaped by operational continuity: water volumes change with drilling pace and production rates, and treatment and logistics must remain synchronized with field operations. That operating coupling supports customer repeat behavior and contract renewals, particularly where infrastructure is already deployed.

💰 Revenue Streams & Monetisation Model

Revenue is primarily tied to managed volumes of produced water and related services. Monetisation generally includes:

  • Per-volume service revenue for hauling, storage, treatment, recycling, and/or disposal—driven by produced water rates and operating intensity.
  • Contracted arrangements with oil and gas operators and service partners that can add durability through minimum volumes, agreed service terms, and defined pricing frameworks.
  • Secondary value capture through operational efficiencies (e.g., routing, asset utilization, and reuse optimization) that improve gross margin per treated unit.

Margin drivers are largely operational: asset utilization, transportation distance, treatment chemistry/consumables efficiency, and the ability to route water to the lowest-cost permissible disposition path. Revenue can be cyclical with drilling activity, but the structural value of access to logistics and permitted capacity supports comparatively resilient economics once infrastructure is built and deployed.

🧠 Competitive Advantages & Market Positioning

SELECT WATER SOLUTIONS’ moat is best characterized as logistical and regulatory “capacity lock-in”, reinforced by practical switching costs.

  • Geographic cost advantage (infrastructure proximity): Competitive outcomes depend heavily on minimizing the distance from where produced water is generated to where it can be treated or disposed. Companies with dense operating footprints and permitted endpoints reduce per-unit logistics costs.
  • Permits and compliance execution: Disposal and treatment often require specific permits and ongoing compliance. Building or expanding compliant capacity is time- and capital-intensive, limiting competitors’ ability to rapidly match service capability.
  • Operational switching costs: Field operators value reliability and continuity. When routes, schedules, and treatment configurations are already integrated with an operator’s upstream activity, switching providers can increase operational risk and coordination costs.

Competitive benchmarking: Key competitors and alternatives include:

  • Evoqua / Xylem (water treatment solutions with broader treatment technology and EPC/service capabilities)
  • Veolia (industrial water and wastewater services with strong engineering and asset footprint)
  • Ecolab (Nalco Water) (treatment chemicals and industrial water services)

SELECT WATER SOLUTIONS’ positioning differs from these larger, diversified players by emphasizing oil-and-gas produced-water handling with an infrastructure-and-logistics focus rather than primarily technology-led treatment deployments. The competitive advantage is less about proprietary treatment chemistry and more about the ability to move and handle produced water efficiently across a defined geographic area, backed by owned/managed assets and compliance-ready capacity.

🚀 Multi-Year Growth Drivers

  • Scale of produced-water volumes: Oil and gas production expansion and the ongoing need to manage water produced alongside hydrocarbons create sustained demand for handling and disposal/reuse services.
  • Reuse and disposal cost pressure: Cost escalation and operational constraints tend to favor solutions that increase water reuse and optimize the disposal pathway, supporting contract renewals and volume share where infrastructure is in place.
  • Operational integration and contracted services: As operators seek reliability, the portion of produced-water handling supported by service agreements can increase, supporting longer-lived revenue visibility relative to purely spot services.
  • Geographic footprint density: Over a 5–10 year horizon, value can compound where a provider builds dense infrastructure that shortens logistics routes and improves asset utilization, creating a reinforcing advantage versus fragmented competitors.

⚠ Risk Factors to Monitor

  • Commodity-driven volume cyclicality: Produced-water volumes typically track upstream drilling and completion activity, which can pressure utilization and margins.
  • Regulatory and permitting risk: Changes in disposal regulations, permitted capacity limits, or compliance standards can require capital expenditures and may constrain routing options.
  • Execution and asset availability: Water handling is operationally demanding; downtime, equipment failures, or insufficient treatment performance can impact customer retention and contract economics.
  • Capital intensity and expansion discipline: Growth can require meaningful investment in capacity and logistics. Overexpansion in weaker demand conditions can impair returns.
  • Customer concentration: Dependence on a limited set of operators can increase bargaining power risks and create volatility if customer activity profiles change.

📊 Valuation & Market View

Market valuation for companies in produced-water logistics and treatment services typically hinges on cash generation durability, asset utilization, and contracted service mix. Investors commonly frame valuation using EV/EBITDA and EV-to-revenue depending on the visibility of volume and margin structure. Key valuation drivers include:

  • Utilization and per-unit cost curve: How efficiently assets convert volume into operating profit.
  • Contract durability and customer quality: The extent of volume commitments and the creditworthiness of counterparties.
  • Capex-to-growth quality: Whether expansion increases throughput at attractive incremental returns or merely maintains scale.
  • Geographic density and routing economics: The degree to which infrastructure reduces logistics costs and preserves margins across varying field activity levels.

In this sector, valuation compression risk tends to be linked to weaker utilization and rising compliance or operating costs, while rerating typically follows evidence of sustained per-unit economics and disciplined capital deployment.

🔍 Investment Takeaway

SELECT WATER SOLUTIONS’ long-term investment case rests on infrastructure-based logistics economics—specifically, geographic proximity to permitted disposal and treatment endpoints that reduce per-unit handling costs, supported by regulatory execution and operational switching costs. Over a multi-year horizon, growth potential is tied to continued produced-water management demand, reuse/disposal optimization, and the compounding value of a dense operating footprint.


⚠ AI-generated — informational only. Validate using filings before investing.

📰 Market News & Coverage

15 Stories Available

Real-time institutional reporting and market updates for WTTR.

gurufocus.com2026-06-03

LibertyStream Delivers First Tonne of Lithium Carbonate to U.S. Industrial Customer

LibertyStream Infrastructure Partners Inc. (TSXV: LIB | OTCQB: VLTLF | FSE: I2D) (“LibertyStream” or the “Company”) is pleased to announce that it has

zacks.com2026-05-27

Here's Why 'Trend' Investors Would Love Betting on Select Water Solutions, Inc. (WTTR)

If you are looking for stocks that are well positioned to maintain their recent uptrend, Select Water Solutions, Inc. (WTTR) could be a great choice. It is one of the several stocks that passed through our "Recent Price Strength" screen.

zacks.com2026-05-26

Earnings Estimates Moving Higher for Select Water Solutions, Inc. (WTTR): Time to Buy?

Select Water Solutions, Inc. (WTTR) shares have started gaining and might continue moving higher in the near term, as indicated by solid earnings estimate revisions.

zacks.com2026-05-26

What Makes Select Water Solutions, Inc. (WTTR) a New Strong Buy Stock

Select Water Solutions, Inc. (WTTR) has been upgraded to a Zacks Rank #1 (Strong Buy), reflecting growing optimism about the company's earnings prospects. This might drive the stock higher in the near term.

gurufocus.com2026-05-21

EnerCom Announces Premier Networking Events for the 31st Annual Energy Investment Conference, Including Monday Charity Golf Tournament, Monday VIP Welcome Mixer, and Tuesday Casino Night

EnerCom Announces Premier Networking Events for the 31st Annual Energy Investment Conference, Including Monday Charity Golf Tournament, Monday

fool.com2026-05-13

This Under-the-Radar Energy Stock Could Be the Best Buy of 2026

Select Water Solutions isn't the first energy stock on many investors' list. Maybe it ought to be.

seekingalpha.com2026-05-06

Select Water Solutions, Inc. (WTTR) Q1 2026 Earnings Call Transcript

Select Water Solutions, Inc. (WTTR) Q1 2026 Earnings Call Transcript

zacks.com2026-05-05

Here's What Key Metrics Tell Us About Select Water Solutions, Inc. (WTTR) Q1 Earnings

Although the revenue and EPS for Select Water Solutions, Inc. (WTTR) give a sense of how its business performed in the quarter ended March 2026, it might be worth considering how some key metrics compare with Wall Street estimates and the year-ago numbers.

zacks.com2026-05-05

Select Water Solutions, Inc. (WTTR) Beats Q1 Earnings and Revenue Estimates

Select Water Solutions, Inc. (WTTR) came out with quarterly earnings of $0.08 per share, beating the Zacks Consensus Estimate of $0.01 per share. This compares to earnings of $0.08 per share a year ago.

prnewswire.com2026-05-05

Select Water Solutions Announces First Quarter 2026 Financial, Operational and Strategic Updates

Generated first quarter 2026 consolidated revenue of $366 million, an increase of $19 million or 6%, as compared to the fourth quarter of 2025 Increased net income by $11 million and improved adjusted EBITDA by $13 million sequentially during the first quarter of 2026 relative to the fourth quarter of 2025 Generated record quarterly Water Infrastructure revenue of $97 million during the first quarter of 2026, an increase of $16 million or 19%, as compared to the fourth quarter of 2025 Announces multiple new long-term contracted Water Infrastructure projects in the Permian, Bakken, MidCon and Northeast regions Announces $28.6 million of acquisitions, closed during early May 2026, adding surface acreage and minerals, disposal capacity, water rights, and storage infrastructure in the Northern Delaware Basin GAINESVILLE, Texas, May 5, 2026 /PRNewswire/ -- Select Water Solutions, Inc. (NYSE: WTTR) ("Select" or the "Company"), a leading provider of sustainable water and chemical solutions, today announced its financial and operating results for the quarter ended March 31, 2026. John Schmitz, Chairman of the Board, President and CEO, stated, "The first quarter represented a strong start to the year for Select.

fool.com2026-05-04

Kailix Advisors Establishes Significant Stake in Select Water Solutions, According to Recent SEC Filing

Select Water Solutions (WTTR) is moving deeper into water infrastructure and recycling, where pipelines and treatment systems can make revenue less tied to daily field activity. The appeal for investors is whether WTTR can improve earnings quality while still benefiting from shale demand.

zacks.com2026-04-23

Select Water Solutions, Inc. (WTTR) Moves 6.2% Higher: Will This Strength Last?

Select Water Solutions, Inc. (WTTR) was a big mover last session on higher-than-average trading volume. The latest trend in earnings estimate revisions might not help the stock continue moving higher in the near term.

prnewswire.com2026-04-21

Select Water Solutions Announces 2026 First Quarter Earnings Release and Conference Call Schedule

GAINESVILLE, Texas, April 21, 2026 /PRNewswire/ -- Select Water Solutions, Inc. (NYSE: WTTR) today announced that it will release 2026 first quarter financial results on Tuesday, May 5, 2026 after the market closes. In conjunction with the release, the Company has scheduled a conference call, which will also be broadcast live over the Internet, on Wednesday, May 6, 2026 at 11:00 a.m.

prnewswire.com2026-04-16

Select Water Solutions Announces Quarterly Cash Dividend of $0.07 Per Share

GAINESVILLE, Texas, April 16, 2026 /PRNewswire/ -- Select Water Solutions, Inc. (NYSE: WTTR) ("Select" or the "Company"), a leading provider of sustainable water and chemical solutions to the energy industry, today announced that its Board of Directors declared a quarterly cash dividend of $0.07 per share of Class A common stock to be paid on May 13, 2026, to holders of record as of the close of business on April 30, 2026. A comparable distribution of $0.07 per unit has also been approved to the unitholders of SES Holdings, LLC, which will be subject to the same payment and record dates.

businesswire.com2026-04-09

LibertyStream Commences Lithium Carbonate Production at Select Water Solutions Facility and Secures First U.S. Purchase Order

DALLAS--(BUSINESS WIRE)---- $LIB.v #criticalminerals--LibertyStream Infrastructure Partners Inc. (TSXV: LIB | OTCQB: VLTLF | FSE: I2D) (“LibertyStream” or the “Company”) is pleased to announce that it has begun production from its DLE Unit and its Lithium Carbonate Refining Facility (the “Lithium Carbonate Operating Facility”) at Select Water Solutions' (NYSE:WTTR) (“Select”) site in Howard County, north-east of Midland. The Company has also pre-sold its first tonne of production of lithium carbonate from its Lithium Carbo.

📊 AI Financial Analysis

Powered by StockMarketInfo
Earnings Data: Q Ending 2026-03-31

"WTTR reported Q1’26 revenue of $365.96M and net income of $8.61M (EPS $0.078; diluted $0.077). QoQ, revenue rose +5.7% (from $346.50M in Q4’25) while net income improved sharply from a loss of $(0.35)M to +$8.61M. YoY, revenue declined -2.3% (from $374.38M in Q1’25) and net income increased from $8.24M to $8.61M (+4.5%), indicating earnings resilience despite slightly softer top-line. Profitability improved sequentially: net margin expanded to 2.35% in Q1’26 from -0.10% in Q4’25, and gross margin widened to 17.8% (vs 12.7% in Q4’25). Over the last four quarters, margins have been volatile (notably a high gross margin in Q3’25), but the current quarter shows a clear rebound. Cash flow quality remains mixed. Q1’26 operating cash flow (OCF) was $10.24M but free cash flow was -$68.1M after capex (PPE investment). Balance sheet resilience is moderate: total assets grew to $1.71B while equity remains strong at ~$1.00–1.12B depending on how equity lines are interpreted (total stockholders’ equity ~$0.99B). Shareholder returns look strong: the stock price is up +80.5% over 1 year, and the dividend yield is ~0.52%. Overall, momentum is a key support, but sustaining cash conversion into FCF will be crucial."

Revenue Growth

Neutral

QoQ revenue up +5.7% (Q4’25 $346.5M → Q1’26 $366.0M). YoY revenue down -2.3% (Q1’25 $374.4M → Q1’26 $366.0M), indicating slight top-line softness.

Profitability

Good

Net income turned positive QoQ (from -$0.35M in Q4’25 to +$8.61M in Q1’26; +$8.96M). YoY net income up +4.5% (+$0.37M). Net margin improved to 2.35% vs -0.10% QoQ; gross margin also widened to 17.8% from 12.7%.

Cash Flow Quality

Caution

OCF was modest at +$10.2M, but FCF was -$68.1M due to heavy capex. Dividend paid was -$8.75M, and the payout ratio is high (~101.7% of net income), leaving less cushion if earnings soften.

Leverage & Balance Sheet

Positive

Total assets increased to ~$1.71B. Equity remains sizable (~$0.99B stockholders’ equity; ~$1.12B in retained/other equity line). Leverage appears manageable with total debt of ~$85.6M and net debt of ~$29.6M, though working-capital swings drive cash volatility.

Shareholder Returns

Strong

Strong capital appreciation: 1Y price change +80.46%. Dividend yield is low (~0.52%), but buyback activity (repurchased -$7.6M in Q1’26) plus price momentum supports total shareholder return.

Analyst Sentiment & Valuation

Neutral

Consensus target is $16 vs current price $14.87 (modest upside). Valuation metrics show elevated earnings multiple (P/E ~49x) and negative FCF-based ratios, increasing sensitivity to future cash conversion.

Disclaimer:This analysis is AI-generated for informational purposes only. Accuracy is not guaranteed and this does not constitute financial advice.

Fundamentals Overview

Loading fundamentals overview...

Select Water Solutions delivered a strong Q1 2026 with consolidated revenue up $19.5M, adjusted EBITDA up $13.5M, and net income up $11.5M versus Q4 2025, driven primarily by Water Infrastructure. Water Infrastructure revenue rose 19% QoQ to a record ~$97M and produced a 56% gross margin before D&A, lifting consolidated gross margins before D&A above 30% for the first time/all-time high. Management raised full-year Water Infrastructure growth guidance to 25%–30% YoY (from 20%–25%), supported by planned late Q2/Q3 project startups and continued commercialization wins (MVCs, acreage dedications, ROFR dedications, and interruptibles). Water Services sequentially improved (+7% revenue; margins 21.8% vs 19.6%) and Chemical Technologies guided for another step up (Q2 revenue +10%–15%; margins 20%–21%). The company ended with $196M net debt and >$300M liquidity post-equity offering, while raising 2026 net CapEx to $200M–$250M. Q&A emphasized macro uncertainty but no customer schedule changes tied to gas takeaway; they remain positioned for incremental volume and pricing upside.

AI IconGrowth Catalysts

  • Water Infrastructure commercialization wins: added low-/no-capital MVCs, acreage dedications, ROFR dedications, and interruptible agreements across Permian, Northeast, Bakken, and MidCon
  • Record Water Infrastructure gross margin before D&A of 56% and consolidated gross margins before D&A above 30% (all-time high), supporting outperformance vs guidance
  • Late Q2 and Q3 projects slated to come online, expected to drive continued back-half 2026 and 2027 Water Infrastructure growth
  • Chemical Technologies demand and project momentum in friction reducers and specialty surfactants, supporting strong sequential Q2 growth expectations

Business Development

  • New multiyear Northeast disposal dedication agreement with a core customer, executed alongside becoming the preferred water transfer provider for that customer
  • Added since start of Q1 2026: 3 new MVCs, 2 additional acreage dedications, 2 new ROFR dedications, and 8 new interruptible agreements (Permian, Northeast, Bakken, MidCon)
  • May acquisitions in the Northern Delaware Basin: ~4,000 acres of surface/minerals; 30,000 bpd disposal capacity; 1,800 acre-feet of annual water rights; 500,000 barrels of storage (Texas and New Mexico)
  • Data center dialogues in West Texas (no named customer disclosed) focused on water solutions, services/rentals/power-related support, and waste stream management

AI IconFinancial Highlights

  • Consolidated vs Q4 2025: revenue +$19.5M; adjusted EBITDA +$13.5M; net income +$11.5M
  • Water Infrastructure: +19% revenue QoQ vs Q4 2025; record quarterly segment revenue ~$97M; recycled/disposed volume growth; 56% gross margins before D&A
  • Water Infrastructure gross margin before D&A: increased to 56%, lifting consolidated gross margins before D&A above 30% for the first time and to an all-time high
  • Full-year Water Infrastructure guidance raised to 25%–30% YoY growth (from 20%–25%)
  • Water Services: +7% top-line revenue sequentially vs guidance; gross margins before D&A 21.8% in Q1 vs 19.6% in Q4; Q2 margins expected 20%–22%
  • Chemical Technologies: Q1 revenue $78M and gross margins 19% in line with guidance; Q2 expected sequential revenue +10%–15% and margins 20%–21%
  • Consolidated adjusted EBITDA: $77.6M in Q1; above high end of guidance; Q2 adjusted EBITDA expected $77M–$80M
  • SG&A: decreased >6% to $40.6M (~11% of revenue)
  • D&A: expected ~$47M–$50M in Q2, modest tick-up later into the low-50s as capital projects complete
  • Balance sheet: after equity offering, revolver fully repaid; ended with $196M net debt and >$300M total available liquidity; quarterly interest expected $4M–$6M

AI IconCapital Funding

  • Equity offering executed (amount not stated); liquidity enhanced with >$300M total available liquidity
  • Repaid revolver fully following the equity offering
  • Cash flow: operating cash flow drag in Q1 due to increased accounts receivable; expected to cycle through during the year
  • CapEx: $78M in Q1; expects CapEx acceleration in Q2 as projects target late Q2/early Q3 completion
  • Full-year 2026 net CapEx raised to $200M–$250M (from $175M–$225M); $50M–$60M expected for maintenance/margin improvement

AI IconStrategy & Ops

  • Focus on value maximization from invested capital via increased commercialization and contracted service offering expansion; prioritizing low-to-no capital opportunities
  • Water Infrastructure network optimization through MVCs, dedications (acreage and ROFR), and interruptible agreements; leveraging existing basin footprint to add incremental committed volumes and utilization
  • Northern Delaware Basin acquisitions expected to integrate efficiently and bolster operational/economic development potential
  • Cost actions: SG&A reduction (>6% QoQ basis as described) and strong margin leverage from Water Infrastructure outperformance
  • Automation/not explicitly described; operating strategy emphasized on contracting, commercialization, and margin/earnings power conversion through-cycle

AI IconMarket Outlook

  • Water Infrastructure: expects relatively steady Q2 segment performance; with projects online in late Q2 and Q3, positioned to exceed prior full-year guidance and now expects 25%–30% YoY growth in 2026
  • Water Services: forecast modest low single-digit % revenue decline in Q2 driven by nonrecurrence of certain Q1 spot market water sales; margins expected steady at 20%–22%
  • Chemical Technologies: expects strong sequential Q2 revenue growth of 10%–15% and margins increasing into 20%–21% range
  • Consolidated adjusted EBITDA Q2: $77M–$80M
  • Interest expense: expected $4M–$6M per quarter near term
  • CapEx 2026: $200M–$250M net (with maintenance $50M–$60M)

AI IconRisks & Headwinds

  • Macro/commodity volatility: management is monitoring Middle East-related commodity outlook shifts and customer activity/pricing behaviors, with potential for activity pullback or stabilization uncertainty
  • Execution and timing risk: back-half performance depends on projects coming online late Q2 and Q3; Q4 visibility described as unclear
  • Water Services variability: Q2 revenue decline expected due to nonrecurrence of sizable Q1 spot market water sales (timing/volume normalization risk)
  • Operating cash flow timing: Q1 drag from higher accounts receivable expected to cycle through later in the year
  • Natural gas takeaway concerns: management stated no meaningful change in customer outlook/commitment schedules for new capacity; still dependent on commodity profile and customer response

Q&A: Analyst Interest

  • Macro-driven activity ramp: Management described conversations with customers indicating frac intensity may be pulled forward (or stabilized) as operators keep additional crews running; they are not taking an aggressive activity stance, but see potential tailwinds for services and potential infrastructure volume timing through late Q2/Q3.
  • Northern Delaware acquisition/contract accretion and framework: Management framed the commercial arrangements as low-capital (aggregate less than ~$5M) leveraging existing footprint. They emphasized ROFR/tie-in/brownfield pathways to add committed capacity with accretive incremental barrels, and referenced greenfield underwriting as still ~4-year cash-on-cash.
  • Peak rentals, portfolio optimization, and capital-to-free-cash-flow: Management said there is no material change yet on peak rentals, though they continue actively evaluating. They discussed capital efficiency leveraging recycling-first network economics, and reiterated light maintenance needs (~$60M), with services/chemicals modeled for ~70%–80% free cash flow conversion from gross profit.

Sentiment: POSITIVE

Note: This summary was synthesized by AI from the WTTR Q1 2026 earnings transcript. Financial data is complex; please verify all metrics against official SEC filings before making investment decisions.

📋 Official Regulatory 10-K / 10-Q SEC Filings

Direct authenticated documentation links to audited SEC database reports for WTTR.

SEC EDGAR Live Feed
Loading financial data and tables...
📁

SEC Filings (WTTR)

© 2026 Stock Market Info — Select Water Solutions, Inc. (WTTR) Financial Profile