Weyerhaeuser Company

Weyerhaeuser Company (WY) Market Cap

Weyerhaeuser Company has a market capitalization of .

No quote data available.

CEO: Devin W. Stockfish

Sector: Basic Materials

Industry: Paper, Lumber & Forest Products

IPO Date: 1973-05-03

Website: https://www.weyerhaeuser.com

Weyerhaeuser Company (WY) - Company Information

Market Cap: -|Sector: Basic Materials

Company Profile

Weyerhaeuser Company, one of the world's largest private owners of timberlands, began operations in 1900. We own or control approximately 11 million acres of timberlands in the U.S. and manage additional timberlands under long-term licenses in Canada. We manage these timberlands on a sustainable basis in compliance with internationally recognized forestry standards. We are also one of the largest manufacturers of wood products in North America. Our company is a real estate investment trust. In 2020, we generated $7.5 billion in net sales and employed approximately 9,400 people who serve customers worldwide. We are listed on the Dow Jones Sustainability North America Index. Our common stock trades on the New York Stock Exchange under the symbol WY.

Analyst Sentiment

79%
Strong Buy

From 12 Active Polls

1Y Forecast: $29.50

▲ +0.0% Potential Upside

Consensus Target Metrics

Low Bound

$28

Median

$29

High Bound

$33

Average

$30

Price & Moving Averages

Loading chart...

🎯 Wall Street Analyst Intelligence Report

1-Year structural target targets, chart projections, and sentiment maps.

Average 1Y Target
$29.50
▲ +20.51% Upside
Low Target
$28.00
14% Risk
Median Target
$28.50
16% Mid
High Target
$33.00
35% Max

Consensus Trend Projection

Trailing closures vs. 12-month metrics map.

Analyst Vote Distribution

Aggregate institutional coverage sentiment weights.

Sentiment volume allocation data unavailable.

Historical valuation matrix unavailable.

📘 Full Research Report

ℹ️

AI-Generated Research: This report is for informational purposes only.

📘 WEYERHAEUSER REIT (WY) — Investment Overview

🧩 Business Model Overview

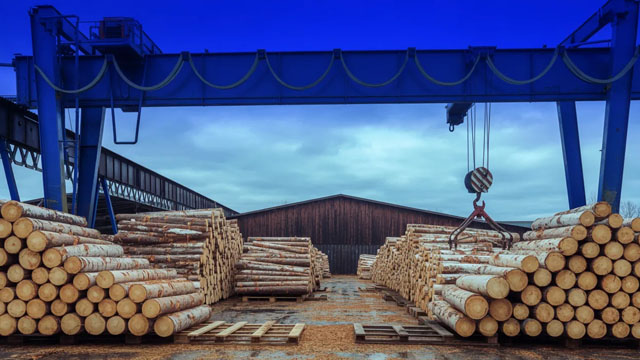
Weyerhaeuser operates as a vertically oriented timberland owner and manager. The core “engine” is ownership of productive forest acreage, active silviculture, and harvesting execution that converts long-duration biological growth into saleable forest products. Value is realized through (i) selling logs/wood fiber to mills and (ii) leveraging the spatial fit between timberlands and downstream processing capacity—reducing procurement and hauling friction for customers. The company’s real asset base also enables selective monetization of land and non-core assets when market conditions support efficient redeployment.

💰 Revenue Streams & Monetisation Model

  • Timber harvest and product sales (primary): Revenue is driven by harvest volumes and prevailing wood-fiber pricing across product streams (sawlogs, pulpwood, and other fiber categories). Margins typically track harvest timing, logging/transport costs, and the quality mix of the harvested stands.
  • Long-term supply arrangements and customer relationships: While pricing can be market-linked, the company’s scale and managed forest productivity support repeatable fiber flows to industrial customers, improving utilization consistency for counterpart mills.
  • Land and related asset monetisation (secondary): Sales or monetization of land parcels, rights, and specialty properties contribute additional optionality. These tend to be less frequent than harvest-driven revenue but can improve total return across cycles.

Overall monetisation is structurally weighted toward real asset production rather than short-cycle operating exposure. Margin drivers are largely operational (harvesting efficiency, fiber mix, logistics) and macro-relative (housing/industrial wood demand affecting end-market prices).

🧠 Competitive Advantages & Market Positioning

Weyerhaeuser’s competitive edge is rooted in durable geographic cost advantage and asset scarcity. Timberland productivity is heterogeneous across regions; productive acres with favorable soils, growth rates, and weather resilience are difficult to replicate. In addition, proximity to industrial wood users and processing infrastructure lowers delivered cost for customers, supporting Weyerhaeuser’s ability to win and retain supply relationships.

  • Geographic & logistical advantages: Timberlands positioned near rail/road corridors and processing capacity reduce transportation costs and delivery lead times, effectively lowering the “delivered wood” cost for customers.
  • Scale and forest management capability: Large acreage and active silviculture improve resource planning, harvested mix optimization, and operational continuity across long growth cycles.
  • Long-duration asset stickiness: Competitors cannot rapidly scale productive timberland. Biological growth timelines and land acquisition constraints create structural persistence in supply capability.

Competitive benchmarking:

  • Rayonier (RYN): Competes primarily as a timberland-focused operator with different regional exposure and product mix emphasis.
  • PotlatchDeltic (DLB): Timberland owner with its own regional network and customer relationships; faces similar cycles but not identical geographic/logistical footprints.
  • Hancock Timber Resource (HTI): Another timberland manager/operator; competes for fiber supply and land monetisation, but with differing acreage quality and regional proximity to end markets.

Compared with these timberland-focused peers, Weyerhaeuser typically emphasizes operational breadth and logistics fit across its key regions, aiming to convert acreage productivity into dependable delivered fiber economics.

🚀 Multi-Year Growth Drivers

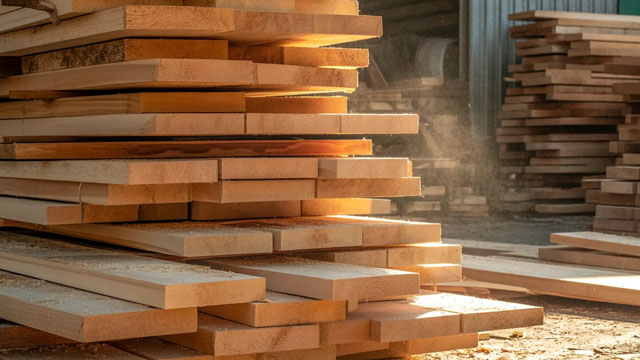
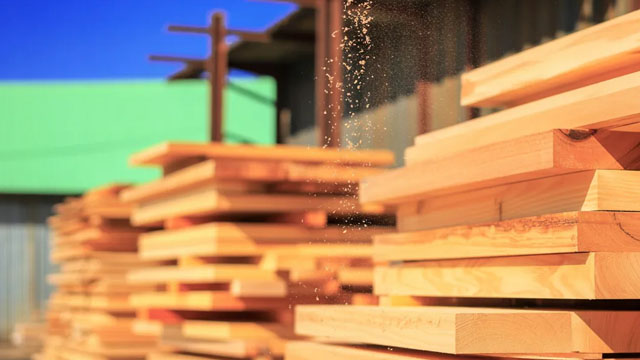
  • Demand for wood in construction and engineered products: Structural use cases for wood—particularly engineered wood products—can support higher-value fiber utilization and improved demand durability versus purely paper/commodity uses.
  • Conversion of biological growth into higher-grade outputs: Ongoing forest management upgrades (species selection, thinning strategy, rotation optimization) can improve yield quality and realized pricing per harvested acre.
  • Decarbonization and ecosystem value monetisation: Forest assets benefit from rising policy and corporate focus on carbon stewardship. This can create incremental revenue opportunities and improve the investment attractiveness of sustainably managed timberlands.
  • Optionality from land and non-core monetization: Over a multi-year horizon, selective sales and redeployment can sharpen capital efficiency, particularly when land-use alternatives offer attractive embedded value.
  • Resilience from supply-side constraints: Limited availability of high-quality timberland constrains competitive supply growth, supporting the long-term value of existing productive acres.

⚠ Risk Factors to Monitor

  • Timber and wood-fiber price cycles: Revenues are sensitive to commodity end-markets (housing, industrial demand). Harvest timing and product mix can partially mitigate, but not eliminate, cyclicality.
  • Climate, pests, and operational disruption: Biological and weather risks can impair growth rates, reduce recoverable volume, and increase salvage or replanting costs.
  • Regulatory and environmental requirements: Forestry practices, land-use restrictions, protected habitat rules, and reporting standards can affect harvest schedules and cost structure.
  • Capital intensity and balance-sheet/financing conditions: While timberland is a long-lived asset, sustaining silviculture and meeting cash obligations can be influenced by interest-rate and credit conditions.
  • REIT compliance and payout durability: The structure requires consistent tax-compliant distributions; business performance and capital allocation must remain aligned with REIT requirements.

📊 Valuation & Market View

Markets typically value timberland REITs using a blend of cash flow fundamentals and real-asset value. In practice, investors monitor:

  • Dividend/total payout capacity: Sustainable free cash flow relative to distributions is central for REIT-focused investors.
  • Operating cash flow drivers: Harvest volumes, delivered cost trends, and realized pricing spreads across product categories.
  • Asset value considerations: Timberland value and replacement cost logic influence valuation floors, especially when future growth and carbon stewardship are emphasized.
  • Interest-rate sensitivity: Discount rates and cost of capital affect the equity value of income-oriented real assets.

Key valuation “movers” are therefore tied to fiber economics (pricing and cost), harvest discipline, and the perceived durability of real-asset cash flows across cycles.

🔍 Investment Takeaway

Weyerhaeuser’s long-term investment case rests on the structural economics of owning productive timberlands: geographic/logistical cost advantage, operational scale in forest management, and the scarcity and durability of high-quality acreage. While outcomes remain exposed to timber-cycle volatility and environmental/regulatory constraints, the asset-driven business model and supply-side limitations create a credible foundation for resilient cash generation over a multi-year horizon.


⚠ AI-generated — informational only. Validate using filings before investing.

📊 AI Financial Analysis

Powered by StockMarketInfo
Earnings Data: Q Ending 2026-03-31

"Weyerhaeuser (WY) reported Q1 2026 revenue of $1.727B and net income of $156M (net margin 9.0%). EPS was not provided in the dataset for the quarter. Versus Q1 2025, revenue declined (YoY) from $1.763B to $1.727B (about -2.1%), while net income also fell from $83M to $156M (about +87.8%). Versus the prior quarter, revenue rose (QoQ) from $1.541B to $1.727B (about +12.2%), and net income improved from $74M to $156M (about +110.0%). Profitability strengthened in Q1: gross margin expanded to 18.4% from ~2.1% in Q4 2025, and net margin improved to 9.0% from 4.8% (QoQ). On a sequential basis, operating income turned positive (Q4 showed a loss), indicating cost control and/or improved mix. Cash flow quality is mixed: operating cash flow was $52M, but free cash flow was also $52M (capex shown as 0). Capital returns remain shareholder-friendly—dividends paid were $151M (payout ratio ~97% of net income in Q1), with modest buybacks (~$10M). Balance sheet resilience looks stable: total assets were $16.4B and equity $9.44B, while net debt was low at ~$73M (though higher cash levels fell sharply QoQ). Total shareholder returns are likely supported by ongoing dividends, while the provided market data shows only -1.6% 1-year price change (no >20% momentum). Analyst consensus targets imply upside versus $25.17 current price."

Revenue Growth

Fair

QoQ revenue increased to $1.727B (+12.2%), but YoY revenue fell from $1.763B to $1.727B (about -2.1%), indicating modest top-line softness.

Profitability

Positive

Net income improved materially QoQ ($74M to $156M, +110.0%) and gross/net margins expanded sharply QoQ (net margin 4.8% to 9.0%), suggesting improving operating conditions.

Cash Flow Quality

Neutral

Operating cash flow was $52M in Q1, generating free cash flow of $52M (capex reported as 0). Dividends remain high (~$151M) with a payout ratio near ~97% of net income in the quarter.

Leverage & Balance Sheet

Neutral

Equity was stable at ~$9.44B and total assets were $16.4B. Net debt was very low (~$73M), but cash dropped sharply QoQ (cash $464M to $299M), warranting monitoring.

Shareholder Returns

Neutral

Dividends are a meaningful component (dividends paid ~$151M) and buybacks were modest (~$10M). However, the provided 1-year price change is -1.6%, so capital appreciation has not been strong.

Analyst Sentiment & Valuation

Positive

Consensus price target is $29.83 vs. $25.17 current price, implying roughly 18% upside. No evidence of extreme downside from targets in the provided data.

Disclaimer:This analysis is AI-generated for informational purposes only. Accuracy is not guaranteed and this does not constitute financial advice.

Fundamentals Overview

Loading fundamentals overview...

So What? Weyerhaeuser’s Q1 delivered sharp earnings leverage (+120% adjusted EBITDA vs Q4) driven primarily by Wood Products pricing strength (lumber +~13% realizations; OSB +~8%) and an outsized SLS quarter benefiting from a $94M Florida Conservation Easement and real estate timing. Timberlands were steadier (+5% West EBITDA) but remained exposed to international demand softness (muted Japan log markets; early-stage China reactivation). Management’s Q2 outlook keeps Timberlands flat vs Q1 and targets Wood Products adjusted EBITDA comparable to Q1, while SLS declines ~$70M in adjusted EBITDA and ~$80M in earnings due to conservation transaction timing. The company is actively managing macro/cost risks: gross inflation headwind is ~$10M/month from energy, resin, and freight driven by the Middle East conflict, largely offset through procurement/logistics and cost pass-through. Tariff relief (AR7) points to duties falling ~10% (~45% to ~35%) around August/fall. Growth execution continues via AeroStrand/Pro Panel and expanded distribution.

AI IconGrowth Catalysts

  • Wood Products new product launches AeroStrand and Pro Panel (previewed at International Builders’ Show in February) with “overwhelmingly positive” feedback and expected strong demand
  • Monticello-related volume ramp into 2026/next year: AeroStrand positioned to broaden opportunity set from timber strand technology once Monticello comes online
  • Distribution footprint expansion: new location in Billings, Montana; new facility in Gallatin, Tennessee operational by year-end (distribution network to 22 locations)
  • Lumber price tailwind: framing lumber composite strengthening tied to spring season replacement of lean inventories and supply constraints from prior curtailments/closures

Business Development

  • February divestiture of non-core timberlands in Virginia for $192 million
  • April final proceeds of $22 million from the transfer of timber licenses in British Columbia to the buyer of the Princeton Mill (final proceeds associated with Princeton transaction)
  • Florida Conservation Easement transaction completing in Q1: $94 million conservation easement, conveying ~61,000 acres with restricted future development while Weyerhaeuser retains ownership for sustainable forest management

AI IconFinancial Highlights

  • GAAP Q1 2026: $156 million net income / $0.22 diluted EPS; net sales $1.7 billion
  • Excluding special items: $77 million / $0.11 diluted EPS
  • Adjusted EBITDA $308 million, +120% vs Q4; improved across each segment
  • Timberlands (ex special): $57 million earnings; adjusted EBITDA $120 million (+5% vs Q4); West export logs to Japan: muted Japan demand tied to elevated customer inventories and lower log prices
  • Strategic Land Solutions (SLS): $169 million earnings; adjusted EBITDA $193 million (+$98 million vs Q4) driven by timing/mix of real estate sales and completion of $94 million Florida Conservation Easement
  • Wood Products (ex special): $14 million earnings; adjusted EBITDA $71 million (+$91 million vs Q4), largely due to higher lumber and OSB pricing
  • Lumber: average sales realizations increased ~13% vs Q4; adjusted EBITDA $27 million (+$84 million vs Q4)
  • OSB: average sales realizations up ~8% vs Q4; adjusted EBITDA $3 million (+$13 million vs Q4); temporary winter weather disruptions early in quarter
  • Engineered Wood Products: adjusted EBITDA $39 million, down $10 million vs Q4 due to lower average sales realizations and higher OSB web stock raw material costs; order files slightly upticked in March; volume expected to rise seasonally in Q2
  • Second quarter guidance (ex special items): Timberlands adjusted EBITDA and earnings comparable to Q1; SLS adjusted EBITDA ~70 million lower vs Q1; earnings ~80 million lower vs Q1 (conservation transaction timing partially offset by real estate strength)
  • Tariffs/cost impacts: Middle East conflict increased export costs (ocean freight) and higher energy cost pressures; gross headwind estimated at ~$10 million/month with majority offset via procurement/logistics and cost pass-through

AI IconCapital Funding

  • Cash balance ~$300 million; total debt $5.4 billion at quarter-end
  • Repaid $150 million, 7.7% notes upon maturity during the quarter
  • Returned $151 million to shareholders via quarterly base dividend; additional ~$10 million via share repurchase activity in Q1
  • Q1 capital expenditures $112 million, including $30 million tied to EWP facility in Arkansas
  • Monticello 2026 investments expected to be ~$300 million; CapEx for Monticello excluded from adjusted FAD used in cash return framework
  • Generated $52 million cash from operations (noted as typically the lowest operating cash flow quarter due to seasonal working-capital build)

AI IconStrategy & Ops

  • Portfolio optimization: completed divestiture of non-core Virginia timberlands; finalized Princeton transaction proceeds from BC timber license transfer
  • Segment reporting update: Strategic Land Solutions re-framed with expanded disclosure into three business lines (Real Estate, Natural Resources, Climate Solutions), with cadence enhanced for Climate Solutions
  • Operations: returned to a more normal operating posture in lumber following late-2025 market-related adjustments; unit manufacturing costs lower in Q1
  • OSB operations: production and sales volumes slightly lower due to early-quarter winter weather disruptions; planned annual maintenance outages at three OSB mills anticipated to drive cost increases in Q2
  • Distribution: network expanded to 22 locations via Billings, MT and Gallatin, TN facility (by year-end)

AI IconMarket Outlook

  • Timberlands Q2 2026: adjusted EBITDA and earnings before special items expected comparable to Q1
  • Western domestic log market: steady log demand expected; average domestic sales realizations slightly higher than Q1 (April price increases expected to hold through quarter end); fee harvest volumes and forestry/road costs higher; per unit log and haul costs higher (higher elevation + elevated fuel costs)
  • Western export (Japan/China) Q2: log markets expected relatively stable but at reduced levels; shipments and pricing comparable to Q1; export costs higher due to Middle East conflict
  • South Q2: log inventories elevated; seasonally increasing log supply; sawlog demand relatively stable; fiber demand soft; sales realizations comparable to Q1; fee harvest volumes and forestry/road costs higher; per unit log/haul costs moderately higher (fuel)
  • North Q2: average sales realizations moderately higher than Q1; fee harvest volumes significantly lower due to spring breakup
  • SLS Q2: adjusted EBITDA approximately $70 million lower and earnings approximately $80 million lower than Q1 due to conservation unit transaction timing in Q1; partially offset by stronger real estate business
  • SLS full-year adjusted EBITDA: approximately $425 million; basis as % of total SLS sales expected between 20% and 30%
  • Wood Products Q2 (ex special items): adjusted EBITDA comparable to Q1 excluding effects from changes in average sales realizations for lumber and OSB; improved sales volumes offset by higher costs from transportation/raw materials inflation and planned OSB outages

AI IconRisks & Headwinds

  • Japan housing consumption headwinds kept log markets muted in Q1; customers’ finished goods inventories remained elevated; log prices decreased
  • China re-establishment of export program remains early stage; shipments limited by Chinese real estate weakness and seasonal construction slowdown (Lunar New Year)
  • Southern timber markets: sawlog markets subdued due to log supply outpacing demand from drier-than-normal weather; fiber demand moderated as mills reduced consumption before spring maintenance and lower finished goods takeaway
  • OSB/Engineered Wood Products: EWP demand softer than initial early-Q1 expectations; order improvement only slight in March; engineered wood EBITDA pressured by lower realizations and higher OSB web stock costs
  • Cost inflation: headwind on a gross basis estimated at ~$10 million/month from higher energy costs (Middle East conflict), including log/haul, fertilizer, transportation, ocean freight, resin/additives, and logistics
  • Tariff uncertainty: preliminary AR7 dropped duties ~10%; all-in duties expected to decline from ~45% to ~35% with timing around August (possibly pushed to fall)

Q&A: Analyst Interest

  • Topic: Wood Products margin sustainability with flat/volatile lumber pricing. Management emphasized profitability is driven by product-line supply-demand dynamics rather than housing headlines. They cited mill curtailments reducing supply, supporting Q1 lumber pricing, and argued new product innovation plus cost discipline provide upside when pricing normalizes.
  • Topic: Tariffs/duties trajectory and timing (AR7). Management referenced preliminary AR7 results reducing duties by ~10%, implying all-in duties could fall from ~45% to ~35% for softwood lumber duties and the 232 10% tariff. Management suggested timing around August, sometimes pushed into fall.
  • Topic: Inflation pressure quantification (resin/freight) and how it nets to guidance; capital/leverage framing. Management estimated gross headwind about ~$10M/month across businesses from energy-driven log/haul, fertilizer, ocean freight, resin/additives, and transportation, offset by procurement/logistics and vendor/customer pass-through. They reiterated leverage targets are mid-cycle (3.5x) with balance-sheet levers.

Sentiment: MIXED

Note: This summary was synthesized by AI from the WY Q1 2026 earnings transcript. Financial data is complex; please verify all metrics against official SEC filings before making investment decisions.

Loading financial data and tables...
© 2026 Stock Market Info — Weyerhaeuser Company (WY) Financial Profile