The York Water Company

The York Water Company (YORW) Market Cap

The York Water Company has a market capitalization of $484.3M.

Price: $29.88

-0.09 (-0.28%)

Market Cap: 484.25M

NASDAQ · time unavailable

CEO: Joseph Thomas Hand

Sector: Utilities

Industry: Regulated Water

IPO Date: 1999-05-03

Website: https://www.yorkwater.com

The York Water Company (YORW) - Company Information

Market Cap: 484.25M|Sector: Utilities

Company Profile

The York Water Company specializes in the acquisition, treatment, and delivery of potable water. Beyond its core water supply operations, the firm manages a comprehensive wastewater network, comprising three distinct collection systems and five full-service collection and purification plants. Its primary water sources include Lake Williams and Lake Redman, two reservoirs with a combined capacity of approximately 2.2 billion gallons. This supply is augmented by a 15-mile conduit channeling water from the Susquehanna River to Lake Redman, alongside nine active groundwater wells providing water to customers in Adams County. The company serves a diverse industrial customer base, spanning sectors such as home furnishings, electronics manufacturing, food processing, paper production, defense materials, textile fabrication, climate control systems, cleaning product formulation, sports equipment, and motorcycle assembly. These services reach 51 communities across three counties in the south-central portion of Pennsylvania. Established in 1816, The York Water Company is headquartered in York, Pennsylvania.

Analyst Sentiment

50%
Hold

From 1 Active Polls

Consensus Target Matrix

Data feed parsing pending...

Price & Moving Averages

Loading chart...

🎯 Wall Street Analyst Intelligence Report

1-Year structural target targets, chart projections, and sentiment maps.

Average 1Y Target
$31.37
▲ +5.00% Upside
Low Target
$22.41
-25% Risk
Median Target
$30.47
2% Mid
High Target
$37.34
25% Max
Consensus
Hold
0 / 4 Buys

Consensus Trend Projection

Trailing closures vs. 12-month metrics map.

Analyst Vote Distribution

Aggregate institutional coverage sentiment weights.

📊 Historical Valuation Multiples

Real-time Trailing Twelve Month (TTM) momentum side-by-side with discrete quarterly metrics.

Fiscal QuarterTTMQ1 2026Q4 2025Q3 2025Q2 2025Q1 2025Q4 2024Q3 2024Q2 2024
Period EndingTrailing 12MMar 31, 2026Dec 31, 2025Sep 30, 2025Jun 30, 2025Mar 31, 2025Dec 31, 2024Sep 30, 2024Jun 30, 2024
Market Cap ($M)484439459438455499470538528
Enterprise Value ($M)722676691666673710676736719
Price to Earnings Ratio (P/E)20.2822.7922.2017.6822.5134.2722.8522.9326.44
Price/Earnings-to-Growth Ratio (PEG)0.172.925.594.454.15
Price to Sales Ratio (P/S)299.2921.86-7.9121.5323.7027.0224.9227.2728.16
Price to Book Ratio (P/B)1.781.811.911.841.942.152.032.352.34
Price to Free Cash Flow Ratio (P/FCF)-12.00-89.14-19.92-61.83-85.77-152.28-84.1818.89-92.52
Enterprise Value to Sales (EV/Sales)33.69-11.9132.7035.0738.4935.8137.3438.35
Enterprise Value to EBITDA (EV/EBITDA)21.3265.38698.0956.4162.8671.1863.2562.5965.59
Debt to Equity Ratio7.010.980.970.960.930.910.890.870.85
⚠️

Valuation Model Suspended

API Payload Error: Inverted or negative baseline Free Cash Flow margin detected (-21.3%).

Troubleshooting Notice: The upstream financial data supplier has uploaded corrupted or inverted baseline metrics for YORW. The server sandbox cannot calculate an intrinsic value path from negative cash generation baselines.

📘 Full Research Report

ℹ️

AI-Generated Research: This report is for informational purposes only.

📘 YORK WATER (YORW) — Investment Overview

🧩 Business Model Overview

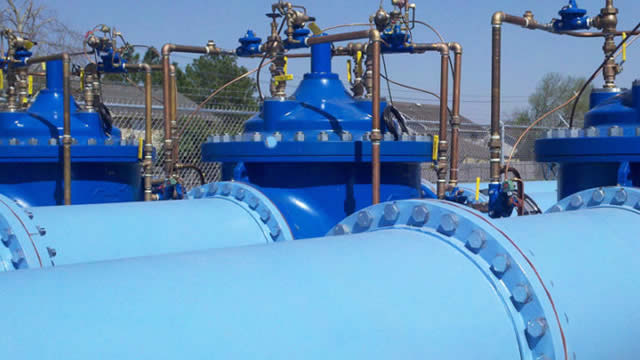
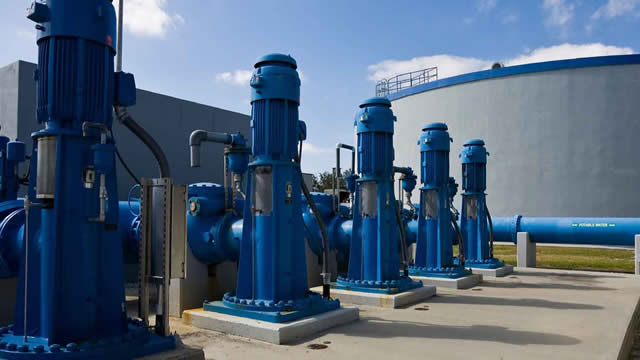
York Water operates a regulated, geographically defined water utility service territory. The business model is straightforward: York Water owns and maintains water production assets (wells/intakes and treatment), a distribution network (mains, storage, pumps), and customer meters, then bills customers under regulated tariffs. Because service rights are tied to the utility’s footprint and governed by regulators, customers typically cannot switch providers, which makes the system’s cash flows driven by ongoing service availability, approved operating practices, and permitted capital investment.

💰 Revenue Streams & Monetisation Model

Revenue is primarily recurring and rate-based, with monetisation anchored in regulated tariffs and metered consumption. Typical components include:

  • Metered water service: Charges linked to usage, including demand and volumetric rates.
  • Fixed/availability charges: Ongoing customer charges that support baseline cash generation regardless of usage volatility.
  • Regulatory-authorised pass-throughs: Certain costs can be recovered through tariff mechanisms, reducing long-term earnings volatility versus unregulated utilities.

Margin drivers are closely tied to the ability to recover prudent costs and earn an allowed return on the rate base. Operating efficiency, labor/material cost control, and successful regulatory recovery of capital expenditures (capex) and operating expenses are the key determinants of profitability.

🧠 Competitive Advantages & Market Positioning

York Water competes primarily with other regulated water and wastewater utilities that serve distinct service territories; competition is limited by franchise/service rights rather than by product differentiation.

  • Primary moat: High switching costs — Water service is a localized utility. Customers cannot feasibly replace piping networks and treatment infrastructure, creating a durable customer lock-in.
  • Regulatory moat — Tariff setting and rate-case frameworks can provide earnings support for prudent investments and operating practices, subject to regulatory oversight.
  • Geographic operating footprint — Dense, entrenched networks in the service area create long-lived assets and reduce the likelihood of meaningful displacement by alternative providers.

Competitive benchmarking (public peers and alternative regulated operators):

  • American Water Works (AWK) — Larger scale operator with a broader footprint; competes for acquisitions and regulatory approvals rather than customer switching.
  • Middlesex Water (MDWS) — Similar regulated model with distinct territory exposure.
  • SJW Group (SJW) — Regulated utility with geographic concentration and a comparable rate-base-driven earnings profile.

York Water’s positioning emphasizes a more concentrated regional operating footprint, where the moat is reinforced by local infrastructure ownership, established service rights, and regulator-governed tariff recovery—rather than by broad geographic scale.

🚀 Multi-Year Growth Drivers

Over a 5–10 year horizon, growth is less about volume expansion and more about expanding and modernizing the rate base while maintaining system reliability. Key drivers typically include:

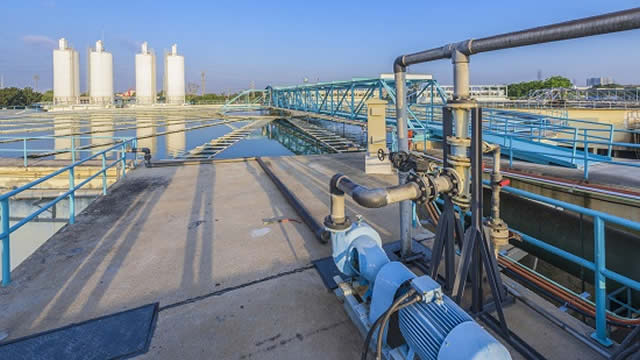
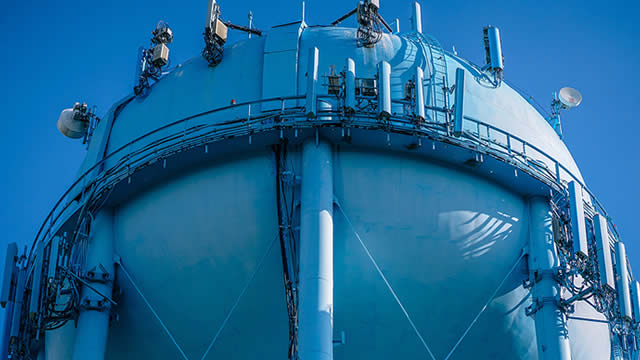
  • Infrastructure renewal and system upgrades: Aging mains, treatment upgrades, storage expansion, and automation improve reliability and support regulatory recovery.
  • Regulatory-driven water quality compliance: Standards for contaminants and treatment efficacy can require capital investment, often supported by tariff mechanisms when prudently incurred.
  • Demand stability with tariff structure support: While usage may fluctuate due to conservation, fixed charges and rate design can sustain revenue durability.
  • Service territory opportunities: Extensions, targeted development connections, and utility program growth can add customers and marginal usage within the franchised footprint.

The most durable compounding mechanism for regulated utilities is the ability to invest at reasonable execution risk, then translate capex into an expanded and recoverable rate base under the regulatory framework.

⚠ Risk Factors to Monitor

  • Regulatory outcome risk: Rate-case timing, allowed returns, disallowances, and tariff design can affect earnings durability and the conversion of capex into recoverable value.
  • Capital intensity and execution risk: Water systems require continuous investment; project overruns, contractor performance issues, or permitting delays can pressure cash flow and regulatory recoveries.
  • Water quality and environmental compliance risk: Treatment requirements (including emerging contaminants) can drive higher-than-planned capex and operating costs.
  • Demand and conservation pressure: Conservation can reduce volumetric revenue; the tariff structure and fixed charge components become critical to offset usage declines.
  • Financing and interest-rate sensitivity: As rate base expands, capital markets access and cost of debt influence capital planning and coverage metrics.
  • Climate and operational stress: Drought conditions, storm impacts, and source-water variability can strain operations and increase O&M needs.

📊 Valuation & Market View

The regulated water utility sector is typically valued on steady, rate-base-linked cash generation rather than high growth. Market participants often focus on:

  • EV/EBITDA and utility earnings multiples as a shorthand for operating profitability and capital structure normalization.
  • Dividend sustainability and payout coverage for income-oriented investors.
  • Regulatory fundamentals: allowed returns, rate-case outcomes, and the trajectory of rate base expansion.
  • Quality of earnings: the extent to which earnings reflect durable recoveries of prudently incurred costs versus temporary timing effects.

Key valuation “drivers” are regulatory decisions (allowed return and recoverability), capex execution quality, and the balance between operating cost growth and tariff recovery.

🔍 Investment Takeaway

York Water offers a durable, evergreen utility thesis built on local infrastructure ownership and structurally high switching costs. The core investment case rests on (1) regulatory frameworks that can support cost recovery and returns on prudently invested capital, and (2) ongoing capex needs driven by system reliability, water quality compliance, and infrastructure modernization. For investors, the fundamental question is less about market share and more about regulatory and execution discipline—how effectively the company converts required investment into a recoverable, reliable earnings stream.


⚠ AI-generated — informational only. Validate using filings before investing.

📰 Market News & Coverage

15 Stories Available

Real-time institutional reporting and market updates for YORW.

globenewswire.com2026-05-05

The York Water Company Reports Three Months Earnings

YORK, Pa., May 05, 2026 (GLOBE NEWSWIRE) -- The York Water Company's (NASDAQ:YORW) President, JT Hand, announced the Company's financial results for the first quarter of 2026.

fool.com2026-05-05

I Just Opened a Position in Wall Street's Greatest Dividend Stock -- a Company That's Been Paying Dividends Since the Early 1800s

Dividend stocks have more than doubled the average annual return of non-payers over the previous 52 years. The stock I purchased has lost 44% of its value over the trailing five years, with a premium valuation, high inflation, and a recent public offering sending its shares to an eight-year low.

globenewswire.com2026-04-22

The York Water Company Announces Closing of Its Common Stock Public Offering

YORK, Pa., April 22, 2026 (GLOBE NEWSWIRE) -- The York Water Company (“York Water” or the “Company”) (NASDAQ: YORW), a provider of water and wastewater utility services, announced today the closing of the underwriters' full exercise of the underwriters' option to purchase 228,261 additional shares along with the previously-announced public offering of 1,521,739 shares of the Company's common stock at a price to the public of $28.50 per share. The net proceeds to York Water from the purchase of such additional shares was approximately $6.3 million, bringing the total net proceeds from the offering, after deducting the underwriting discounts and commissions and other offering expenses, to approximately $47.7 million.

globenewswire.com2026-04-17

The York Water Company Announces Closing of Its Common Stock Public Offering

YORK, Pa., April 17, 2026 (GLOBE NEWSWIRE) -- The York Water Company (“York Water” or the “Company”) (NASDAQ: YORW), a provider of water and wastewater utility services, announced today the closing of its previously-announced public offering of 1,521,739 shares of its common stock at a price to the public of $28.50 per share. The net proceeds to York Water from the offering, after deducting the underwriting discounts and commissions and other offering expenses, are approximately $41.4 million.

fool.com2026-04-16

Why York Water Stock Just Sank to a 52-Week Low

York Water is issuing new shares, and investors aren't happy with that. This water giant, however, is a top dividend-paying stock, and is now trading at an attractive price.

globenewswire.com2026-04-16

The York Water Company Announces Pricing of 2026 Public Offering of Common Stock

YORK, Pa., April 16, 2026 (GLOBE NEWSWIRE) -- The York Water Company (“York Water” or the “Company”) (NASDAQ: YORW), a provider of water and wastewater utility services, announced today the pricing of its previously announced underwritten public offering of common stock. York Water priced an offering of 1,521,739 shares of its common stock at a price to the public of $28.50 per share. The aggregate gross proceeds from the offering are expected to be approximately $43 million, before deducting underwriting discounts and commissions payable by York Water. York Water has granted the underwriters a 30-day option to purchase up to 228,261 additional shares of its common stock at the public offering price, less underwriting discounts and commissions.

seekingalpha.com2026-04-15

York Water: Dividends Minted Since 1816

York Water Company offers unmatched dividend reliability, having paid uninterrupted dividends since 1816 and serving as the nation's oldest investor-owned utility. YORW is executing a $145 million capital plan through 2027, driving customer growth, infrastructure upgrades, and regulatory compliance, supporting robust EPS and dividend growth forecasts. Shares trade at a forward PE of 18.8, representing a 22% discount to a fair value PE of 24, with a potential 32% upside through March 2027 if growth and re-rating materialize.

fool.com2026-03-18

Meet Wall Street's Greatest Dividend Stock: A Virtually Unknown Small-Cap Company That's Run Circles Around Coca-Cola and ExxonMobil in an Important Category

Buying and holding high-quality dividend stocks has been among the best long-term investment strategies on Wall Street. Elite dividend stocks are hard to come by, with only around two dozen public companies having paid a continuous dividend for at least 100 years.

247wallst.com2026-03-10

Hidden Gems for Nervous Investors: 4 Safe Haven Stocks Flying Below the Radar

With the CBOE Volatility Index (VIX) sitting at 25.50 and up 34.9% over the past month, investors are increasingly rotating toward names that offer stability, predictable income, and low correlation to broader market swings.

globenewswire.com2026-03-03

The York Water Company Reports 2025 Annual and Fourth Quarter Results

YORK, Pa., March 03, 2026 (GLOBE NEWSWIRE) -- The York Water Company's (NASDAQ:YORW) President and CEO, JT Hand, announced the Company's 2025 financial results.

defenseworld.net2026-02-21

CenterBook Partners LP Sells 43,372 Shares of The York Water Company $YORW

CenterBook Partners LP lowered its stake in shares of The York Water Company (NASDAQ: YORW) by 55.8% in the third quarter, according to the company in its most recent Form 13F filing with the Securities and Exchange Commission. The firm owned 34,383 shares of the utilities provider's stock after selling 43,372 shares during

seekingalpha.com2026-02-09

210 Years Of Dividends: York Water

The York Water Company is reaffirmed as a Buy, offering a 16% discount to fair value and double-digit total return potential. YORW's robust financials, A- credit rating, and conservative leverage support continued bolt-on acquisitions and dividend growth. The pending rate case and favorable acquisition environment are key catalysts, with a decision expected by March 1st.

fool.com2026-01-27

Say Hello to the 3 Greatest Dividend Stocks on Wall Street -- 2 of Which Most Investors Aren't Even Aware Exist

Dividend stocks have a knack for handily outperforming non-payers over multidecade periods. One of Wall Street's truly special dividend stocks has increased its payout to shareholders more than 130 times since going public in 1994.

defenseworld.net2026-01-19

The York Water Company (NASDAQ:YORW) Sees Significant Decrease in Short Interest

The York Water Company (NASDAQ: YORW - Get Free Report) was the target of a large drop in short interest in the month of December. As of December 31st, there was short interest totaling 431,402 shares, a drop of 20.9% from the December 15th total of 545,373 shares. Approximately 3.0% of the company's shares are short

fool.com2026-01-16

3 Dividend Champions to Buy and Hold for Decades

Inflation has totaled 19% since 2021, but three Dividend Champion stocks have grown their dividends faster. These stocks could get a second look from income-hungry investors if the Fed lowers rates again as expected.

📊 AI Financial Analysis

Powered by StockMarketInfo
Earnings Data: Q Ending 2026-03-31

"Headlines (2026-03-31, Q1): Revenue $20.07M; Net Income $4.81M; diluted EPS $0.33. QoQ (vs. 2025-12-31): Revenue increased meaningfully from a negative/erroneous Q4 figure (−$58.02M) to $20.07M; Net income rose from $5.17M to $4.81M (slight decline). Profitability improved sequentially in the sense that operating and net profit ratios normalized from deeply negative Q4 margins to +31.6% operating margin and +24.0% net margin. YoY (vs. 2025-03-31): Revenue grew from $18.46M to $20.07M, +8.8% YoY. Net income increased from $3.64M to $4.81M, +32.4% YoY, and diluted EPS rose from $0.25 to $0.33 (+32.0% YoY). Over the 4-quarter period, gross and operating margins appear to strengthen versus Q1’25 (gross margin ~71.8% → ~70.1% latest; operating margin ~34.0% → ~31.6%), but the biggest positive step is the sustained move away from the anomalous Q4’25 loss pattern. Cash flow: Operating cash flow was $5.37M, but free cash flow was −$4.45M due to large capital outflow classification (capex shown as −$9.82M). The company still paid dividends of $3.28M and repaid debt (+$4.16M net debt repayment). Balance sheet remains asset-heavy with $689.8M total assets and equity of $242.3M; leverage is moderate for a non-bank with total debt $237.4M. Total shareholder returns: Price is $30.08 with −15.15% 1Y_change, implying weak capital appreciation; dividend yield is modest (~0.75%). With no buyback program indicated, total return momentum appears soft. Revenue and Earnings-based metrics were applied (company is not pre-revenue)."

Revenue Growth

Neutral

YoY revenue growth is +8.8% (Q1’26 $20.07M vs Q1’25 $18.46M). QoQ comparison is distorted by anomalous Q4’25 negative revenue, but latest quarter shows normalization to positive growth.

Profitability

Neutral

YoY net income up +32.4% (Q1’26 $4.81M vs Q1’25 $3.64M). Margins normalized versus Q4’25 (net margin +24.0% vs -8.9%), though operating margin is slightly lower vs Q1’25 (~31.6% vs ~34.0%).

Cash Flow Quality

Neutral

Operating cash flow was positive ($5.37M) but free cash flow was negative (−$4.45M) driven by large capex outflow classification. Dividends of $3.28M were paid, but cash return on capex remains a concern.

Leverage & Balance Sheet

Positive

Total assets grew modestly (Q1’26 $689.8M vs Q1’25 $641.8M). Equity increased (Q1’26 $242.3M vs Q1’25 $232.1M). Total debt is $237.4M and net debt rises YoY (shown net debt $237.4M vs $211.6M), indicating somewhat higher leverage.

Shareholder Returns

Caution

1Y price change is −15.15% (weak capital appreciation). Dividend yield is ~0.75%, supporting some income but not enough to offset negative price momentum; buybacks are not indicated.

Analyst Sentiment & Valuation

Fair

No price target provided. Valuation multiples shown are elevated (P/E ~22.8; price-to-sales ~21.9), while 1Y momentum is negative, suggesting mixed-to-weak sentiment.

Disclaimer:This analysis is AI-generated for informational purposes only. Accuracy is not guaranteed and this does not constitute financial advice.

Fundamentals Overview

Loading fundamentals overview...

Management sounds confident on growth and financing: operating revenue +9.7% to $31.4m, improved efficiency ratio to 41.6% from 42.4%, and expects ~5% 2008 customer growth (2% organic + 3% from West Manheim). However, the Q&A highlights operational/regulatory friction points that management only partially de-risks. The major earnings drag in 2007 was conservation from a drought watch (-1.4% per-capita), and while management expects a rebound, the market was already slowing residential construction (2.3% customer growth vs 3.3% 5-year average). More importantly, analyst pressure centered on the Susquehanna River Basin Commission, where management acknowledged a difficult, due-diligence driven process tied to the Chesapeake Bay Initiative. They explicitly stated they’re not on the next meeting docket (tomorrow), with the next meeting in June—creating timing risk for the Gettysburg out-of-basin transfer that underpins Adams County growth. Depreciation concerns were tempered: 2008–09 should be lower than 2007 after the software-driven “blip.”

AI IconGrowth Catalysts

  • Customer growth within existing service territory to 58,890 (+2.3% vs 2006)
  • Pursuit of service-area expansion tied to West Manheim Municipal Authority acquisition (approved by the PUC)
  • Planned 2008 growth in Southern/Western areas via Adams County expansion (initially ~2,500 total customers from Adams County + West Manheim)
  • Urban re-emergence in the City of York (nearly 14,000 city customers; growth expected to increase revenue with no increase in fixed costs)

Business Development

  • Public Utility Commission approval for expanded service area including West Manheim acquisition
  • Agreement with Gettysburg Municipal Authority to purchase water for resale to its customers (requires out-of-basin transfer approvals)
  • Planned closing in 2008 on West Manheim Municipal Authority

AI IconFinancial Highlights

  • Q4 2007 operating revenues: +$443k (+6.0%) YoY
  • Q4 2007 net income: +$43k (+2.6%) YoY
  • Q4 2007 EPS: unchanged at $0.15/share (diluted due to follow-on stock offering in Dec 2006)
  • Full-year 2007 operating revenues: +9.7% to $31.4m
  • Full-year 2007 earnings: +5.3% to $6.4m
  • Full-year 2007 EPS: down $0.01 vs 2006 (mostly dilution)
  • Dividend declared: 47.5 cents/share (+4.6% YoY; 11th consecutive annual increase)
  • 2007 efficiency ratio improved to 41.6% from 42.4% in 2006
  • Full-year 2007 O&M, admin & general expenses: $1,545,000 (+9.8% YoY)

AI IconCapital Funding

  • 2008 capital expenditures financed primarily via internally generated funds, customers’ advances, short-term borrowings, and debt/equity offerings
  • Projected additional long-term debt in 2008: ~$18m
  • May add to ~$12m of refinancing anticipated in 2008; total debt requirement projected: ~$30m
  • Rate cap expected to make this debt tax-exempt
  • Anticipated fourth-quarter 2008 equity offering: ~$13m
  • Plan to expand dividend reinvestment plan into a direct stock purchase plan (filed with PUC; expected implementation by end of year)
  • Dec 31, 2007 leverage: 51.2% debt / 48.8% equity; expectation equity ratio will be >50% by end of 2008

AI IconStrategy & Ops

  • Improving efficiency ratio through expense discipline: efficiency ratio improved to 41.6% from 42.4% despite higher O&M/admin costs
  • Accounting/depreciation driver discussed: in 2007 started depreciating new computer systems with short life and changed depreciation method (current-year additions depreciated in current year vs starting next year)
  • 2008 expectation for efficiency: company believes 2008 ratio will continue to improve
  • M&A/expansion operations: closed first Adams County property and interconnected; anticipated 2008 close on West Manheim

AI IconMarket Outlook

  • 2008 customer growth expectation: ~5% total (about 2% organic + 3% from West Manheim acquisition)
  • Major rate case filing timing: end of April or end of May 2008
  • Potential impact date: if approved/settled, rates could take effect by Q4 2008
  • Susquehanna River Basin Commission regulatory timeline: next commission meeting June (no confirmation of outcome timing beyond that)

AI IconRisks & Headwinds

  • Per capita consumption decline: -1.4% in 2007 attributed to conservation from a Pennsylvania drought watch (Aug 2007–Jan 2008); expectation is rebound once lifted (frustrating given 19m gallons/day daily consumption with 42m gallons/day capacity)
  • Customer growth below historical pace: +2.3% in 2007 vs 5-year average +3.3%, attributed to sudden slowdown in residential construction in Q3/Q4
  • Higher operating costs: O&M/admin & general expenses up 9.8% driven by salaries/wages, depreciation, pension costs, electrical/chemical costs
  • Rate case outcome uncertainty: value unknown at filing; timing could affect earnings/rate recovery
  • Depreciation outlook: question indicated potential double-digit increases; management stated 2008–2009 should be lower than 2007 (i.e., no double-digit acceleration expected), but method changes continue
  • Regulatory hurdle delaying out-of-basin transfer: Susquehanna River Basin Commission delays tied to Chesapeake Bay Initiative due diligence; Adams County expansion/ Gettysburg transfer could be impacted
  • Susquehanna River Basin Commission docket risk: not on docket for the next meeting (tomorrow); next meeting in June

Sentiment: MIXED

Note: This summary was synthesized by AI from the YORW Q4 2007 earnings transcript. Financial data is complex; please verify all metrics against official SEC filings before making investment decisions.

📋 Official Regulatory 10-K / 10-Q SEC Filings

Direct authenticated documentation links to audited SEC database reports for YORW.

SEC EDGAR Live Feed
Loading financial data and tables...
📁

SEC Filings (YORW)

© 2026 Stock Market Info — The York Water Company (YORW) Financial Profile