Abbott Laboratories

Abbott Laboratories (ABT) Market Cap

Abbott Laboratories has a market capitalization of $158.63B.

Price: $91.07

0.29 (0.32%)

Market Cap: 158.63B

NYSE · time unavailable

CEO: Robert Ford

Sector: Healthcare

Industry: Medical - Devices

IPO Date: 1980-03-17

Website: https://www.abbott.com

Abbott Laboratories (ABT) - Company Information

Market Cap: 158.63B|Sector: Healthcare

Company Profile

Abbott Laboratories, together with its subsidiaries, discovers, develops, manufactures, and sells health care products worldwide. It operates in four segments: Established Pharmaceutical Products, Diagnostic Products, Nutritional Products, and Medical Devices. The Established Pharmaceutical Products segment provides generic pharmaceuticals for the treatment of pancreatic exocrine insufficiency, irritable bowel syndrome or biliary spasm, intrahepatic cholestasis or depressive symptoms, gynecological disorder, hormone replacement therapy, dyslipidemia, hypertension, hypothyroidism, Ménière's disease and vestibular vertigo, pain, fever, inflammation, and migraine, as well as provides anti-infective clarithromycin, influenza vaccine, and products to regulate physiological rhythm of the colon. The Diagnostic Products segment offers laboratory systems in the areas of immunoassay, clinical chemistry, hematology, and transfusion; molecular diagnostics systems that automate the extraction, purification, and preparation of DNA and RNA from patient samples, as well as detect and measure infectious agents; point of care systems; cartridges for testing blood; rapid diagnostics lateral flow testing products; molecular point-of-care testing for HIV, SARS-CoV-2, influenza A and B, RSV, and strep A; cardiometabolic test systems; drug and alcohol test, and remote patient monitoring and consumer self-test systems; and informatics and automation solutions for use in laboratories. The Nutritional Products segment provides pediatric and adult nutritional products. The Medical Devices segment offers rhythm management, electrophysiology, heart failure, vascular, and structural heart devices for the treatment of cardiovascular diseases; and diabetes care products, as well as neuromodulation devices for the management of chronic pain and movement disorders. Abbott Laboratories was founded in 1888 and is based in North Chicago, Illinois.

Analyst Sentiment

87%
Strong Buy

From 28 Active Polls

1Y Forecast: $127.46

▲ +40.0% Potential Upside

Consensus Target Metrics

Low Bound

$92

Median

$125

High Bound

$152

Average

$127

Price & Moving Averages

Loading chart...

🎯 Wall Street Analyst Intelligence Report

1-Year structural target targets, chart projections, and sentiment maps.

Average 1Y Target
$127.46
▲ +39.96% Upside
Low Target
$92.00
1% Risk
Median Target
$125.00
37% Mid
High Target
$152.00
67% Max
Consensus
Buy
31 / 41 Buys

Consensus Trend Projection

Trailing closures vs. 12-month metrics map.

Analyst Vote Distribution

Aggregate institutional coverage sentiment weights.

📊 Historical Valuation Multiples

Real-time Trailing Twelve Month (TTM) momentum side-by-side with discrete quarterly metrics.

Fiscal QuarterTTMQ1 2026Q4 2025Q3 2025Q2 2025Q1 2025Q4 2024Q3 2024Q2 2024
Period EndingTrailing 12MMar 31, 2026Dec 31, 2025Sep 30, 2025Jun 30, 2025Mar 31, 2025Dec 31, 2024Sep 30, 2024Jun 30, 2024
Market Cap ($M)158,627179,360218,882234,261236,720231,769195,872197,745178,957
Enterprise Value ($M)185,871206,604225,427239,691243,206238,479203,531205,166186,724
Price to Earnings Ratio (P/E)25.3541.6330.8135.6233.2743.735.3130.0334.36
Price/Earnings-to-Growth Ratio (PEG)38.9217.494.391.6612.088.29
Price to Sales Ratio (P/S)3.5116.0719.1020.6121.2522.3817.8518.5917.25
Price to Book Ratio (P/B)3.063.454.204.604.684.754.114.974.55
Price to Free Cash Flow Ratio (P/FCF)21.50195.8183.35102.25153.22248.4191.1992.02125.41
Enterprise Value to Sales (EV/Sales)18.5119.6721.0821.8323.0218.5519.2917.99
Enterprise Value to EBITDA (EV/EBITDA)17.20112.1679.8877.5279.7989.3868.0970.5872.37
Debt to Equity Ratio2.520.650.290.250.270.270.320.380.38

ABT Growth Runway Model

Standard long term linear growth fade

Multi-Stage Discounted Cash Flow Sandbox

Market Price$91.07
Intrinsic Value$53.61
Market Alignment
Overvalued by 41.1%relative to calculated intrinsic value
9.00%
Exp: 1%1%
i

Growth runway slowdown

This value provides a time window for the growth rate to decline beyond Stage 1 toward the terminal rate. Longer windows are most useful for companies with high growth starting conditions or strong competitive advantages. This option stretches out the growth rate slowdown across 5, 10, or 15-year steps. A high-growth starting condition (exceeding a 25% initial growth rate) automatically applies a curve decay to simulate realistic, rapid market saturation.
i

Terminal growth rate

With long-term inflation between 3-5%, revenue must grow by that baseline to maintain flat real-world market share. This value sets the permanent terminal growth rate to factor into the valuation beyond the growth slowdown runway toward maturity.

3-Stage Financial Runway Horizon

🧠 Perpetuity Horizon Engine (Stage 3: Post-2035)

Terminal FCF Base$10.30B
Perpetuity TV Value$193.87B
Discounted TV (PV)$81.89B
TV Weighting %57.9%
⚠️
Financial Model Disclaimer & Risk Disclosure: This interactive scenario simulator is an educational sandbox provided strictly for informational and analytical research purposes. Core historical financial statements and consensus estimates are sourced directly via Financial Modeling Prep (FMP). All downstream outputs are entirely deterministic, hypothetical projections generated by combining automated mathematical formulas (including linear interpolation and Gaussian bell-curve decay models) with user-selected variables and third-party financial data inputs. Users assume all liability for trading decisions executed based on these sandbox calculations.

📘 Full Research Report

ℹ️

AI-Generated Research: This report is for informational purposes only.

📘 ABBOTT LABORATORIES (ABT) — Investment Overview

🧩 Business Model Overview

Abbott operates a diversified healthcare platform spanning Nutrition, Diagnostics, and Medical Devices, with Established Pharmaceuticals as a smaller legacy component. The model is driven by supplying products that clinicians and healthcare systems use on a recurring basis:

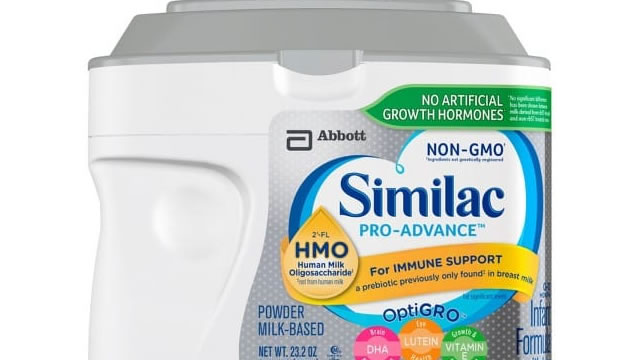
  • Nutrition: manufactures and sells branded and contract infant/adult nutrition products through distributors, retailers, and healthcare channels. Demand is tied to patient populations and routine consumption.
  • Diagnostics: provides laboratory and point-of-care testing that generates clinically actionable results used to guide treatment decisions. These solutions embed into ordering workflows, test menus, and lab/clinic operational processes.
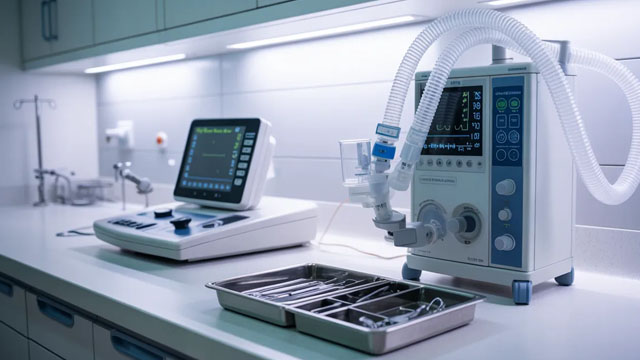
  • Medical Devices: supplies diagnostic and therapeutic technologies where procedural protocols, training, and device integration create practical stickiness for hospitals and clinicians.
  • Pharmaceuticals: contributes additional branded therapies where manufacturing standards and regulatory compliance sustain supply continuity.

Across segments, Abbott’s value chain is anchored in regulatory-approved manufacturing, clinical evidence generation, and distribution into institutional buyers—factors that collectively raise the cost of switching.

💰 Revenue Streams & Monetisation Model

  • Nutrition (largely repeat consumption): Monetization is primarily through branded product volumes and channel distribution. Margin dynamics hinge on input costs, manufacturing scale, and compliance-driven quality systems.
  • Diagnostics (test-driven and workflow-driven): Revenue is generated by test volumes, instrument utilization, reagents, and consumables. Margin drivers typically include test mix, assay portfolio depth, and the installed base’s impact on repeat ordering.
  • Medical Devices (procedure-driven + installed-base effects): Monetization ties to device placements, procedure volumes, and recurring consumables/service components where applicable. Operating leverage often benefits from supply chain discipline and product standardization.
  • Pharmaceuticals (product lifecycle durability): Monetization depends on branded demand durability and regulatory/coverage stability; margins are influenced by manufacturing economics and competitive substitution.

Overall, Abbott’s commercial mix tends to blend repeat/patient-driven demand (Nutrition), high-frequency clinical usage (Diagnostics), and protocol-based adoption (Devices), with profit quality supported by scale, manufacturing execution, and portfolio breadth.

🧠 Competitive Advantages & Market Positioning

Abbott’s moat is best described as a combination of high barriers to entry, regulatory-driven switching costs, and integrated clinical ecosystems—rather than pure brand-driven pricing power.

  • Regulatory moats (FDA/quality systems as an entry barrier): Manufacturing approvals, validated processes, and post-market surveillance create sustained compliance requirements that are difficult for new entrants to replicate quickly.
  • Institutional switching costs: In Diagnostics and Devices, adoption involves validation, clinical workflow integration, staff training, and procurement cycles, which can slow replacement even when competitors offer comparable products.
  • Portfolio breadth and ecosystem integration: Abbott’s ability to provide solutions across related clinical touchpoints supports formulary/test-menu inclusion and more efficient contracting with healthcare systems.
  • Scale and manufacturing execution: In regulated products, scale can improve unit costs and consistency, which is a structural advantage during demand fluctuations and compliance tightening.

COMPETITIVE BENCHMARKING

  • Roche Diagnostics and Siemens Healthineers (Diagnostics): These firms compete on assay breadth, instrument performance, and lab workflow integration. Abbott’s differentiation is the combination of diagnostics reach with broader healthcare coverage, supporting cross-institutional contracting and operational embedding.
  • Medtronic and Stryker (Medical Devices): These competitors often lead with therapy-specific innovation and installed-base penetration. Abbott’s approach emphasizes regulatory execution, procedural adoption pathways, and an ecosystem spanning Diagnostics and Devices.
  • Danone and Nestlé Health Science (Nutrition): These rivals compete strongly in infant and adult nutrition. Abbott’s relative positioning relies on regulated manufacturing reliability and product availability, which can be decisive for institutional and caregiver choice where supply continuity and quality compliance matter.

🚀 Multi-Year Growth Drivers

  • Chronic disease prevalence: Growth in diabetes, cardiovascular risk management, and related monitoring/diagnosis supports durable demand for clinical testing and device/procedure ecosystems.
  • Healthcare system shift toward earlier and more frequent testing: Wider adoption of diagnostic workflows increases total addressable test volumes and supports instrument and consumable utilization.
  • Point-of-care and decentralized care: Expanding delivery of testing outside central labs supports market share capture for solutions that integrate into clinic and hospital workflows.
  • Demographic tailwinds in Nutrition: Aging demographics and ongoing demand for nutrition solutions underpin steady consumption and inventory replenishment cycles.
  • Regulatory-validated product lifecycles: Abbott’s platform experience in compliance and quality helps sustain product continuity, supporting multi-year share stability even amid category churn.

Over a 5–10 year horizon, the opportunity set is less about step-function disruption and more about structural healthcare utilization expanding across patient monitoring, diagnostic decision-making, and protocol-based device usage.

⚠ Risk Factors to Monitor

  • Regulatory and quality risk: Manufacturing issues, labeling changes, or compliance findings can impair supply and lead to cost increases and customer churn.
  • Pricing and reimbursement pressure: Tender cycles, payer formularies, and healthcare budget constraints can compress margins, particularly where reimbursement becomes more restrictive.
  • Competitive technology substitution: In Diagnostics and Devices, improvements in competitor platforms can reduce test/device utilization over time if clinical differentiation narrows.
  • Concentration in institutional purchasing: Large health systems can renegotiate contracts, increasing procurement leverage.
  • Supply chain and input cost volatility: Regulated manufacturing inputs and logistics can affect cost of goods sold and delivery reliability.

📊 Valuation & Market View

Equity markets typically value diversified healthcare companies like Abbott using a blend of earnings durability and quality of growth. Common approaches include:

  • EV/EBITDA and EV/EBIT: Used to normalize across capital structure and reflect operating leverage and margin stability in healthcare product businesses.
  • P/E: Applied where earnings visibility is perceived as strong and growth is incremental rather than speculative.
  • Enterprise-quality adjustments: Investors often scrutinize regulatory risk, margin sustainability, and the stability of demand drivers (patient utilization vs. purely cyclical volumes).

The principal valuation drivers are typically sustainable operating margins, conversion of product growth into free cash flow, and confidence in regulatory/compliance execution that protects the installed base and the supply chain.

🔍 Investment Takeaway

Abbott’s long-term investment case rests on a regulatory and operational moat that is reinforced by institutional switching costs in Diagnostics and Devices, repeat consumption dynamics in Nutrition, and the practical embedding of solutions into clinical workflows. The business profile is geared toward durable utilization growth driven by chronic disease management and expanded diagnostic adoption, tempered by ongoing execution risk inherent in highly regulated healthcare manufacturing.


⚠ AI-generated — informational only. Validate using filings before investing.

📰 Market News & Coverage

15 Stories Available

Real-time institutional reporting and market updates for ABT.

gurufocus.com2026-06-06

New Abbott data show many people with diabetes may not recognize symptoms of diabetic ketoacidosis

New Abbott data show many people with diabetes may not recognize symptoms of diabetic ketoacidosis PR Newswire A

prnewswire.com2026-06-06

New Abbott data show many people with diabetes may not recognize symptoms of diabetic ketoacidosis

Diabetic ketoacidosis (DKA) can develop quickly and is not always easy to detect early Ketone monitoring is not yet routine in diabetes care, which may contribute to missed warning signs of DKA and delays in intervention Nearly 60% of pediatric hospitalizations for Type 1 diabetes in the U.S. are associated with DKA1 ABBOTT PARK, Ill., June 6, 2026 /PRNewswire/ -- Abbott (NYSE: ABT), the global healthcare leader, announced new data revealing diabetic ketoacidosis (DKA) remains an important, yet often undetected health concern for people living with both Type 1 and Type 2 diabetes.

reuters.com2026-06-04

Abbott Labs must face lawsuit over PediaSure children's growth claims

Abbott Laboratories must defend against a proposed class-action lawsuit claiming it misled consumers into believing its PediaSure Grow & Gain nutrition ​drinks were "clinically proven" to help children grow taller, a federal judge ‌ruled on Thursday.

zacks.com2026-06-04

Abbott Addresses a Major Diabetes Care Gap With Tech Innovation

ABT wins the CE Mark for Libre Duo sensors that track glucose and ketones every minute, aiming to spot DKA risks earlier and reduce routine testing.

gurufocus.com2026-06-02

ABT DCF Analysis: Intrinsic Value $93 vs Price $88

On June 02, 2026, we take a closer look at the DCF analysis for Abbott Laboratories (ABT). The stock has experienced notable price performance, with a year-to-d

fool.com2026-06-02

3 Beaten-Down Stocks to Buy and Hold Forever

Don't wait too long to buy the dip on these stocks.

zacks.com2026-06-01

Abbott's CE Mark Win for Libre Duo Systems May Lift Its Stock

ABT wins CE Mark for Libre Duo systems, the first dual glucose-ketone sensors, enabling real-time monitoring as European rollout begins later this year.

zacks.com2026-05-29

BSX vs. ABT: Which Medical Stock Has More Upside Potential?

Boston Scientific and Abbott both posted solid quarterly growth, but analysts see stronger upside for Boston Scientific despite mounting operational pressures.

zacks.com2026-05-29

Investors Heavily Search Abbott Laboratories (ABT): Here is What You Need to Know

Recently, Zacks.com users have been paying close attention to Abbott (ABT). This makes it worthwhile to examine what the stock has in store.

zacks.com2026-05-28

Is It Worth Investing in Abbott (ABT) Based on Wall Street's Bullish Views?

When deciding whether to buy, sell, or hold a stock, investors often rely on analyst recommendations. Media reports about rating changes by these brokerage-firm-employed (or sell-side) analysts often influence a stock's price, but are they really important?

zacks.com2026-05-27

Abbott (ABT) Stock Falls Amid Market Uptick: What Investors Need to Know

Abbott (ABT) concluded the recent trading session at $85.68, signifying a -1.14% move from its prior day's close.

zacks.com2026-05-27

How Abbott's Diagnostics Unit Is Shaping Up Through the Rest of 2026

ABT's Diagnostics unit witnesses mixed Q1 results as Core Lab growth offsets China weakness and softer respiratory testing demand.

prnewswire.com2026-05-27

Abbott secures CE Mark for world's first dual glucose-ketone sensing technology for people with diabetes

First-of-its-kind biowearables combine continuous glucose and ketone monitoring in a single sensor to support both daily diabetes management and help detect rising ketone levels that can lead to diabetic ketoacidosis, a serious health condition for people with diabetes Integrates with the Libre digital health ecosystem, allowing people to share glucose and ketone data with caregivers and healthcare providers Designed for compatibility with leading automated insulin delivery (AID) systems ABBOTT PARK, Ill., May 27, 2026 /PRNewswire/ -- Abbott (NYSE: ABT), a global healthcare leader, announced today it has secured CE Mark for the world's first dual glucose‑ketone sensing technology for people with diabetes.

prnewswire.com2026-05-27

ACS guideline reaffirms Abbott leadership in noninvasive colorectal cancer screening

Cologuard® and Cologuard Plus® reaffirmed as preferred options for noninvasive colorectal cancer (CRC) screening in updated American Cancer Society guideline Abbott to offer only CRC screening portfolio aligned to new ACS recommendations combining preferred stool-based plus additional blood-based options Recent publications support Cologuard-first strategy, demonstrating better outcomes for patients, providers, health systems, and payers ABBOTT PARK, Ill., May 27, 2026 /PRNewswire/ -- Abbott (NYSE: ABT) today announced that the American Cancer Society (ACS) has released updated colorectal cancer (CRC) screening guidelines that reaffirm Cologuard® and Cologuard Plus® as preferred noninvasive screening options for adults age 45 and older who are at average risk for CRC.

prnewswire.com2026-05-26

Abbott showcases expanding evidence across its cancer diagnostics portfolio at ASCO 2026

Data highlight how screening and diagnostics enable earlier detection, more precise treatment decisions, and improved patient outcomes from risk to remission New MRD data from the PARTNER study demonstrate enhanced sensitivity in early triple-negative breast cancer Early MCED prospective data show low anxiety and minimal psychological burden in real-world use ABBOTT PARK, Ill., May 26, 2026 /PRNewswire/ -- Abbott (NYSE: ABT) will present 11 abstracts featuring new evidence across the cancer care continuum at the American Society of Clinical Oncology (ASCO) Annual Meeting, taking place May 29 – June 2, 2026, in Chicago.

📊 AI Financial Analysis

Powered by StockMarketInfo
Earnings Data: Q Ending 2026-03-31

"ABT reported Q1 2026 revenue of $11.16B and net income of $1.08B (EPS $0.62). On a YoY basis, revenue rose ~7.8% (vs. Q1 2025 $10.36B) and net income rose ~18.0% (vs. $1.33B). QoQ, revenue declined ~2.6% (vs. Q4 2025 $11.46B) while net income fell ~39.4% (vs. $1.78B), indicating earnings volatility despite improving YoY fundamentals. Profitability was softer sequentially: net margin fell to ~9.6% from ~15.5% in Q4 2025, while gross margin eased modestly to ~56.3% from ~57.0%. Over the last four quarters, margins have been prone to swings, but the gross margin level remains relatively resilient around the mid-to-high 50%s. Cash flow quality remains strong in absolute terms for a large pharma: operating cash flow was $1.32B and free cash flow was $0.92B in Q1. Dividends remain a major use of cash (dividends paid $1.10B in the quarter) while buybacks were small (-$0.18B), consistent with shareholder-return discipline. Balance sheet resilience is improving: total assets expanded to $110.4B from $86.7B at Q4 2025, with equity steady around $52B. Total shareholder returns are currently pressured by price momentum: ABT is down ~25.4% over 1 year, reducing the overall return profile despite a low dividend yield (~0.6%)."

Revenue Growth

Positive

YoY revenue growth was +7.8% in Q1 2026 ($11.16B vs. $10.36B in Q1 2025). QoQ revenue declined -2.6% ($11.16B vs. $11.46B in Q4 2025), suggesting near-term softness.

Profitability

Caution

Net margin contracted materially QoQ (to ~9.6% from ~15.5%). While EPS was $0.62, QoQ net income fell ~39.4%, indicating weaker sequential earnings despite relatively stable gross margin (~56% level).

Cash Flow Quality

Neutral

Q1 2026 operating cash flow was $1.32B and free cash flow $0.92B. Dividends were substantial (-$1.10B) and buybacks were modest (-$0.18B), but cash generation remains adequate for ongoing capital returns.

Leverage & Balance Sheet

Positive

Equity stayed stable around ~$52B. Total assets increased sharply QoQ (to $110.4B from $86.7B), while debt remains meaningful but manageable for ABT (total debt ~$34.0B in Q1 2026).

Shareholder Returns

Fair

1-year price change is -25.36% (capital appreciation negative). Dividend yield is low (~0.6%), and buybacks in the quarter were not large enough to offset price weakness.

Analyst Sentiment & Valuation

Fair

With price at $96.81 and consensus target ~$128.71 (high $152 / low $92), the stock has potential upside versus the midpoint, but the wide range and negative 1Y momentum temper conviction.

Disclaimer:This analysis is AI-generated for informational purposes only. Accuracy is not guaranteed and this does not constitute financial advice.

Fundamentals Overview

Loading fundamentals overview...

Q1 2026 ABT delivered adjusted EPS of $1.15, aligned with guidance despite two key drags: earlier-than-planned financing costs tied to the Exact Sciences acquisition and a weaker-than-expected respiratory season that pushed Rapid/Molecular Diagnostics down 10%. Sales grew 3.7% on a comparable basis, with FX helping (+4% YoY). The company revised full-year comparable sales growth to 6.5%–7.5% and lowered the EPS midpoint to $5.48 (down $0.20 vs prior midpoint $5.68) due to Exact Sciences dilution. Operationally, management emphasized comparable reporting transparency and integration completion post-03/23/2026 close. Growth showed strength where management is leaning into catalysts: Electrophysiology (PFA catheter launches), Cancer Diagnostics (+13% with mid-teens Cologuard), and Nutrition as pricing actions begin translating into volume recovery. Outlook confidence is tempered by respiratory uncertainty and competitive mitral intensity, while CGM growth is expected to re-accelerate in Q2.

AI IconGrowth Catalysts

  • Earlier-than-planned approvals/launches: two new PFA catheters (Volt PFA; TactiFlex Duo), with Volt driving +14% U.S. Electrophysiology and TactiFlex Duo helping mid-teens growth in Europe
  • Core Lab Diagnostics recovery path: Core Lab Tests (excluding capital/digital) expected to accelerate in 2H as U.S./Europe/Latin America growth continues (+3% core lab comparable; management cites China/VBP and prior COVID headwinds as part of recovery)
  • Cancer Diagnostics acceleration: +13% comparable with mid-teens Cologuard growth and high-teens international growth
  • Nutrition volume reacceleration beginning post-2025 pricing actions: early data shows volume growth starting to follow pricing, supported by new product launches
  • Diabetes Care CGM continued momentum: CGM sales $2.0B, +7.5% in quarter; management expects return to double-digit growth in Q2 despite tender renewal delay

Business Development

  • Completed acquisition of Exact Sciences on 03/23/2026; integrating Exact Sciences into Diagnostics with business operating standalone under new leader Jake Orville (reports directly to CEO)
  • Pipeline/clinical trial milestones: Catalyst left atrial appendage (LAA) closure device trial—patient enrollment completed
  • Libre clinical evidence: randomized trial in type 2 diabetes on basal insulin shows reductions in HbA1c and more time in healthy glucose range
  • Named commercial/tender driver: CGM growth impacted by delay in renewal process related to an international tender (no vendor named)

AI IconFinancial Highlights

  • Adjusted EPS: $1.15 in Q1 2026, in line with expectations and consistent with guidance (despite earlier-than-planned Exact Sciences acquisition financing costs and weaker-than-expected respiratory season); +6% adjusted EPS vs prior year
  • Sales: +3.7% comparable basis in Q1 2026; foreign exchange favorable +4% YoY on Q1 sales
  • Margin structure: adjusted gross margin 56.3% of sales; adjusted R&D 6.7%; adjusted SG&A 29.3%
  • Full-year sales growth outlook: revised to 6.5% to 7.5% on a comparable basis (includes full-year Exact Sciences in both years)
  • Full-year adjusted EPS guidance midpoint reduced: from prior $5.68 to new $5.48 midpoint, reflecting $0.20 dilution related to Exact Sciences acquisition (consistent with deal assumptions)
  • Second-quarter outlook: adjusted EPS forecast $1.25 to $1.31; exchange expected ~neutral impact on Q2 sales; full-year exchange expected favorable ~1% on reported sales
  • Diagnostics mix impacts: Rapid/Molecular Diagnostics sales declined 10% due to weaker respiratory virus testing season versus last year (explicitly cited as a headwind)

AI IconCapital Funding

    AI IconStrategy & Ops

    • Exact Sciences integration completed operationally with comparable sales reporting aligned; management emphasizes transparency by including acquisition in 'comparable' history starting with the close date
    • Conservative guidance philosophy: management did not 'make up' weaker respiratory season in Q4 absent evidence; assumes no above-average season baked into forecast to avoid late-quarter uncertainty
    • Structural Heart operational re-org: moved left atrial appendage closure device from Structural Heart to Electrophysiology at end of last year; salesforce/clinical teams/manufacturing transitioned beginning Jan 1; management expects this to reduce street-model vs delivery mismatch and improve acceleration
    • Electrophysiology positioning for upcoming product cycle: development initiated for implantable extravascular ICD; balloon-expandable TAVR, AVEIR-based leadless pacing, and mitral replacement (Cephea acquisition) all in pipeline with planned trial starts in 2H

    AI IconMarket Outlook

    • Full-year 2026 comparable sales growth: 6.5% to 7.5%
    • Full-year 2026 adjusted EPS midpoint guidance: $5.48 (range not numerically stated in transcript; dilution drives -$0.20 from prior midpoint $5.68)
    • Second-quarter 2026 adjusted EPS: $1.25 to $1.31
    • CGM: expects return to double-digit growth in Q2 despite prescription weakness being discussed by analyst

    AI IconRisks & Headwinds

    • Respiratory season risk/headwind: Rapid/Molecular Diagnostics -10% in Q1; management cited weaker-than-expected respiratory season and decided not to assume catch-up in Q4
    • Integration/comparable reporting complexity risk: guidance relies on comparable sales methodology; analysts questioned organic deceleration (management emphasized transparency and focus areas, not 'one-time vs sustainable' explicitly quantified)
    • Diagnostics headwinds historically referenced: China and VBP and COVID were called out as major $1B headwind in last year for Core Lab recovery discussion
    • Competitive intensity: mitral space competitive intensity increased after competitor portfolio expansion; management cites need for U.S. execution improvements
    • CGM market modulation risk: analyst raised concern about U.S. prescription weakness and possible saturation; management countered with broader TAM/reimbursement/product catalyst view

    Q&A: Analyst Interest

    • Respiratory season & guidance conservatism: Management explained they forecast Q1 respiratory weakness without assuming a Q4 make-up because proving an above-average flu season requires late-year evidence. Management said they can handle surge via manufacturing/distribution if needed, but avoided baking uncertainty into guidance.
    • CGM saturation concern & 2026 catalysts timing: Management pushed back on weekly U.S. TRx as a sole lens, arguing for a 70–80M global CGM patient TAM. They cited proposed CMS type 2 non-insulin coverage language as a near-term catalyst (not included in guidance) and reiterated dual-analyte, Libre 5, and ketone/lactate monitoring roadmap timelines qualitatively.
    • Structural Heart/LAAC trend drivers vs competitor: Management described moving LAA closure outside Structural Heart into Electrophysiology effective Jan 1, including salesforce/clinical/manufacturing changes, to better serve both segments. They cited a Structural Heart reporting 'disconnection' due to prior sales coverage and noted increased mitral competition; they will comment after their Catalyst readout.

    Sentiment: MIXED

    Note: This summary was synthesized by AI from the ABT Q1 2026 earnings transcript. Financial data is complex; please verify all metrics against official SEC filings before making investment decisions.

    📋 Official Regulatory 10-K / 10-Q SEC Filings

    Direct authenticated documentation links to audited SEC database reports for ABT.

    SEC EDGAR Live Feed
    Loading financial data and tables...
    📁

    SEC Filings (ABT)

    © 2026 Stock Market Info — Abbott Laboratories (ABT) Financial Profile