ADMA Biologics, Inc.

ADMA Biologics, Inc. (ADMA) Market Cap

ADMA Biologics, Inc. has a market capitalization of $1.96B.

Price: $8.46

-0.21 (-2.42%)

Market Cap: 1.96B

NASDAQ · time unavailable

CEO: Adam S. Grossman

Sector: Healthcare

Industry: Biotechnology

IPO Date: 2013-10-17

Website: https://www.admabiologics.com

ADMA Biologics, Inc. (ADMA) - Company Information

Market Cap: 1.96B|Sector: Healthcare

Company Profile

ADMA Biologics, Inc. functions as a biopharmaceutical company specializing in the development, manufacturing, and commercialization of advanced biologic therapies derived from blood plasma. These specialized products are engineered to address immune system disorders and infectious diseases, catering to markets across the United States and internationally. Their current product portfolio includes BIVIGAM and ASCENIV, both intravenous immune globulin (IVIG) treatments prescribed for primary humoral immunodeficiency (PI). Additionally, the company offers Nabi-HB, utilized for immediate treatment following acute exposure to the Hepatitis B virus and other specified exposures. Beyond its existing offerings, ADMA is actively developing a pipeline of new plasma-derived therapeutics. This includes immunoglobulin products specifically targeting the prevention and treatment of S. pneumonia infections. The company also oversees its own facilities for source plasma collection. Product distribution is managed through a comprehensive network involving independent distributors, sales agents, specialty pharmacies, and other alternative healthcare providers. ADMA Biologics, Inc. was founded in 2004 and maintains its corporate headquarters in Ramsey, New Jersey.

Analyst Sentiment

90%
Strong Buy

From 5 Active Polls

1Y Forecast: $18.67

▲ +120.7% Potential Upside

Consensus Target Metrics

Low Bound

$17

Median

$18

High Bound

$21

Average

$19

Price & Moving Averages

Loading chart...

🎯 Wall Street Analyst Intelligence Report

1-Year structural target targets, chart projections, and sentiment maps.

Average 1Y Target
$18.67
▲ +120.69% Upside
Low Target
$17.00
101% Risk
Median Target
$18.00
113% Mid
High Target
$21.00
148% Max
Consensus
Buy
9 / 10 Buys

Consensus Trend Projection

Trailing closures vs. 12-month metrics map.

Analyst Vote Distribution

Aggregate institutional coverage sentiment weights.

📊 Historical Valuation Multiples

Real-time Trailing Twelve Month (TTM) momentum side-by-side with discrete quarterly metrics.

Fiscal QuarterTTMQ1 2026Q4 2025Q3 2025Q2 2025Q1 2025Q4 2024Q3 2024Q2 2024
Period EndingTrailing 12MMar 31, 2026Dec 31, 2025Sep 30, 2025Jun 30, 2025Mar 31, 2025Dec 31, 2024Sep 30, 2024Jun 30, 2024
Market Cap ($M)1,9612,1274,3413,4984,3984,7174,0554,6892,684
Enterprise Value ($M)2,0272,1934,3333,5204,3914,7284,0344,7142,738
Price to Earnings Ratio (P/E)12.2611.8621.7124.4332.5245.099.1233.3220.63
Price/Earnings-to-Growth Ratio (PEG)5.902.445.202.820.67
Price to Sales Ratio (P/S)3.8518.5831.1926.0636.0541.0934.4939.1325.04
Price to Book Ratio (P/B)5.125.459.098.1111.0412.6311.6220.2214.26
Price to Free Cash Flow Ratio (P/FCF)18.1738.18125.61-3253.88234.95-193.5385.44195.6161.60
Enterprise Value to Sales (EV/Sales)19.1631.1426.2236.0041.1834.3239.3325.54
Enterprise Value to EBITDA (EV/EBITDA)9.1535.9266.3968.7399.82126.43102.03111.7365.68
Debt to Equity Ratio0.300.520.170.190.210.220.240.480.75

📘 Full Research Report

ℹ️

AI-Generated Research: This report is for informational purposes only.

📘 ADMA BIOLOGICS INC (ADMA) — Investment Overview

🧩 Business Model Overview

ADMA operates in the plasma-derived therapeutics value chain: it sources human plasma (directly and/or through partner networks), manufactures immune globulin and related biologic products in FDA-regulated facilities, and sells these therapies to distributors, specialty pharmacies, and healthcare providers. Revenue is driven by product availability and commercial execution, while cost structure is shaped by plasma procurement costs, regulatory-compliant manufacturing throughput, and biosafety/quality systems.

The practical “stickiness” in this business comes less from contractual switching and more from clinical standard-of-care, established patient treatment pathways, and the regulatory/quality constraints of biologics—factors that make rapid substitution difficult once a therapy is institutionalized.

💰 Revenue Streams & Monetisation Model

ADMA’s monetisation model is primarily tied to the sale of plasma-derived immunoglobulin therapies, typically recognized on shipment/consumption through commercial distribution channels. The monetisation profile is generally a mix of:

  • Product revenue (transactional, but repeatable): Demand is driven by chronic patient use and healthcare system treatment patterns, creating a recurring utilization component even when accounting is transactional.
  • Manufacturing efficiency & scale effects: Gross margins tend to improve when production utilization rises and fixed costs are spread over greater volumes.
  • Inventory and supply continuity: Revenue visibility is influenced by the ability to maintain consistent manufacturing output and avoid product disruptions.

Key margin drivers are (1) plasma and processing costs, (2) manufacturing yield and capacity utilization, (3) reimbursement dynamics, and (4) product mix across immunoglobulin formulations and patient segments.

🧠 Competitive Advantages & Market Positioning

ADMA competes within the plasma-derived immunoglobulin landscape, where the economics and barriers are shaped by regulatory rigor and scale in plasma sourcing and manufacturing.

  • Regulatory moat (high bar to entry): Biologics manufacturing requires sustained FDA-compliant quality systems, validated processes, and ongoing oversight. Competitors can enter clinically challenging categories, but building an end-to-end, approved manufacturing platform is slow and capital-intensive.
  • Operational moat (cost structure + throughput): Competitive players benefit from manufacturing scale, procurement leverage, and disciplined quality execution—factors that influence unit costs and the ability to maintain supply.
  • Clinical switching friction (soft switching costs): Once patients and treatment protocols are established, switching can require clinical transition steps, prescriber familiarity, and payer/provider alignment. Substitution tends to be managed carefully rather than frequent.
  • Intangible assets (quality track record): In biologics, consistent batch quality and regulatory credibility reduce execution risk versus peers starting from a less mature compliance base.

Competitive benchmarking (primary peers):

  • Grifols: a diversified plasma and immunoglobulin player with extensive platform scale. ADMA competes more on supply/segment focus and execution rather than matching Grifols’ breadth of scale immediately.
  • CSL Behring: large global immunoglobulin franchise with scale and long commercial operating history. ADMA’s positioning emphasizes building capacity and sustaining quality-driven product supply; CSL tends to benefit from broad global distribution and portfolio depth.
  • Octapharma (and similarly Kedrion): major immunoglobulin supplier with strong manufacturing footprint. ADMA competes in biologic categories where approvals, supply continuity, and regulatory performance are decisive, but the largest global peers typically have more diversified manufacturing and plasma operations.

Compared with these rivals, ADMA’s industry focus is more concentrated in plasma-derived therapeutics, where differentiation is primarily operational (manufacturing continuity, quality, and throughput) and regulatory credibility rather than broad platform breadth.

🚀 Multi-Year Growth Drivers

Growth in plasma-derived immunoglobulins is supported by structural demand and platform maturation. Over a 5–10 year horizon, the principal drivers typically include:

  • TAM expansion through patient demand growth: Immune deficiency and related indications supported by long-duration therapy drive utilization growth as diagnosed patient populations expand.
  • Capacity scaling and manufacturing learning curves: Throughput improvements and yield optimization can translate into sustained unit-cost advantages as facilities operate closer to optimal utilization.
  • Product mix and formulation depth: Higher-demand formulations and tailored immunoglobulin options can improve commercial resilience and margin profile.
  • Contracting and distribution channel penetration: Deepening distribution relationships and payer/provider alignment can increase effective market access and reduce volatility in order patterns.

In this sector, the most durable growth is usually tied to the ability to (1) secure reliable plasma supply, (2) convert plasma into consistent, regulator-approved output, and (3) maintain uninterrupted product availability.

⚠ Risk Factors to Monitor

  • Regulatory and quality compliance risk: Biologics are sensitive to batch quality, documentation, and facility controls. Remediation actions, warning letters, or manufacturing disruptions can materially affect supply.
  • Plasma supply and procurement volatility: Plasma availability and procurement costs can fluctuate, impacting both margins and production planning.
  • Capacity and execution risk: The operational path from capacity expansion to stable utilization can be uneven; underutilization can pressure profitability.
  • Reimbursement and payer pressure: Pricing dynamics and formulary decisions can compress margins, particularly when multiple immunoglobulin products compete.
  • Competition from scaled global players: Larger peers can exert competitive pressure through supply continuity, portfolio breadth, and contracting leverage.
  • Capital intensity and working capital needs: Manufacturing readiness, plasma procurement timing, and inventory build/release cycles can require ongoing liquidity management.

📊 Valuation & Market View

Markets typically value plasma-derived biologics producers by focusing on the combination of (1) scale-adjusted profitability, (2) quality and supply continuity risk, and (3) credible path to durable margins. Common valuation frameworks include:

  • EV/Revenue (for platform transitions): Used when investors emphasize commercial scale and product ramp, but discount for margin uncertainty and execution risk.
  • EV/EBITDA (when margins stabilize): Used to reflect operating leverage from manufacturing utilization and better unit economics.
  • DCF-style assessment: Often applied for biologics platforms where cash flows depend on sustained market share, cost discipline, and regulatory stability.

Key valuation sensitivities tend to be: gross margin trajectory driven by plasma and manufacturing efficiency; the ability to sustain consistent product supply; and confidence in long-term reimbursement and contracting outcomes.

🔍 Investment Takeaway

ADMA’s long-term investment case rests on operating and regulatory moats inherent to plasma-derived biologics: sustained FDA-compliant manufacturing, quality credibility, and the ability to scale production to improve unit economics. The competitive environment remains intense versus large, scaled peers (Grifols, CSL Behring, Octapharma), but the structural barriers in biologics and the friction involved in substituting immunoglobulin therapies provide a foundation for durable positioning—if ADMA sustains supply continuity and executes capacity and cost improvements.


⚠ AI-generated — informational only. Validate using filings before investing.

📰 Market News & Coverage

15 Stories Available

Real-time institutional reporting and market updates for ADMA.

newsfilecorp.com2026-08-01

ADMA DEADLINE: ROSEN, THE FIRST FILING FIRM, Encourages ADMA Biologics, Inc. Investors with Losses in Excess of $100K to Secure Counsel Before Important August 10 Deadline in Securities Class Action First Filed by the Firm - ADMA

New York, New York--(Newsfile Corp. - August 1, 2026) - WHY: Rosen Law Firm, a global investor rights law firm, reminds purchasers of securities of ADMA Biologics, Inc. (NASDAQ: ADMA) between August 9, 2024 and March 25, 2026, both dates inclusive (the "Class Period"), of the important August 10, 2026 lead plaintiff deadline in the securities class action first filed by the Firm. SO WHAT: If you purchased ADMA Biologics securities during the Class Period you may be entitled to compensation without payment of any out of pocket fees or costs through a contingency fee arrangement.

gurufocus.com2026-07-31

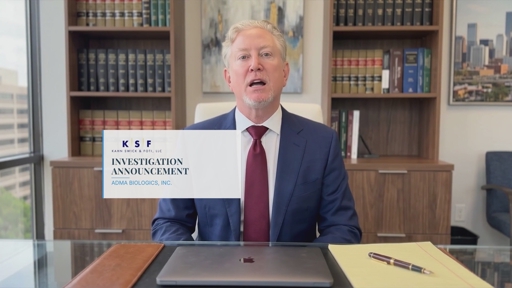
ADMA Biologics, Inc. Notice of August 10, 2026 Application Deadline for Class Action Lawsuit - Contact Lewis Kahn, Esq. at Kahn Swick & Foti, LLC, Before Application Deadline

ADMA Biologics, Inc. Notice of August 10, 2026 Application Deadline for Class Action Lawsuit - Contact Lewis Kahn, Esq. at Kahn Swick and Foti, LL

prnewswire.com2026-07-31

ADMA Biologics, Inc. Notice of August 10, 2026 Application Deadline for Class Action Lawsuit - Contact Lewis Kahn, Esq. at Kahn Swick & Foti, LLC, Before Application Deadline

/PRNewswire/ -- Kahn Swick and Foti, LLC ("KSF") and KSF partner, former Attorney General of Louisiana, Charles C. Foti, Jr., notifies investors in ADMA

zacks.com2026-07-31

Adma Biologics (ADMA) Stock Drops Despite Market Gains: Important Facts to Note

Adma Biologics (ADMA) closed the most recent trading day at $8.46, moving 2.42% from the previous trading session.

globenewswire.com2026-07-31

ADMA DEADLINE: ROSEN, THE FIRST FILING FIRM, Encourages ADMA Biologics, Inc. Investors with Losses in Excess of $100K to Secure Counsel Before Important August 10 Deadline in Securities Class Action First Filed by the Firm – ADMA

NEW YORK, July 31, 2026 (GLOBE NEWSWIRE) -- WHY: Rosen Law Firm, a global investor rights law firm, reminds purchasers of securities of ADMA Biologics, Inc. (NASDAQ: ADMA) between August 9, 2024 and March 25, 2026, both dates inclusive (the “Class Period”), of the important August 10, 2026 lead plaintiff deadline in the securities class action first filed by the Firm.

prnewswire.com2026-07-31

ADMA AUGUST 10, 2026 DEADLINE: ADMA Biologics, Inc. Investors Have Opportunity to Lead Class Action Lawsuit- HBSS

SAN FRANCISCO, July 31, 2026 /PRNewswire/ -- Hagens Berman alerts investors in ADMA Biologics, Inc. (NASDAQ: ADMA) that a securities fraud class action lawsuit has been filed. The lawsuit focuses on alleged misrepresentations concerning the company's financial condition, revenue recognition, inventory distribution, and business practices.

newsfilecorp.com2026-07-31

ADMA Biologics, Inc. Notice of August 10, 2026 Application Deadline for Class Action Lawsuit - Contact Lewis Kahn, Esq. at Kahn Swick & Foti, LLC, Before Application Deadline

New York, New York and New Orleans, Louisiana--(Newsfile Corp. - July 31, 2026) - Kahn Swick & Foti, LLC ("KSF") and KSF partner, former Attorney General of Louisiana, Charles C. Foti, Jr., notifies investors in ADMA Biologics, Inc. ("ADMA" or the "Company") (NASDAQ: ADMA) of a class action securities lawsuit.

globenewswire.com2026-07-31

ADMA Biologics (NASDAQ: ADMA) Investigated for Potential Federal Securities Laws Violations – Lowey Dannenberg, P.C.

NEW YORK, July 31, 2026 (GLOBE NEWSWIRE) -- Lowey Dannenberg P.C. , a top complex litigation law firm, is investigating ADMA Biologics (NASDAQ: ADMA) (“ADMA Biologics” or the “Company”) for potential violations of the federal securities laws.

feeds.newsfilecorp.com2026-07-31

Bronstein, Gewirtz & Grossman LLC Urges ADMA Biologics, Inc. Investors to Act: Class Action Filed Alleging Investor Harm

New York, New York--(Newsfile Corp. - July 31, 2026) - Bronstein, Gewirtz and Grossman, LLC, a nationally recognized investor-rights law

newsfilecorp.com2026-07-31

ADMA INVESTOR DEADLINE APPROACHING: Faruqi & Faruqi, LLP Reminds ADMA Biologics Investors of Securities Class Action Lawsuit Deadline on August 10, 2026

Faruqi & Faruqi, LLP Securities Litigation Partner James (Josh) Wilson Encourages Investors Who Suffered Losses In ADMA Biologics To Contact Him Directly To Discuss Their Options If you purchased or acquired securities in ADMA Biologics between August 9, 2024 and March 25, 2026 and would like to discuss your legal rights, call Faruqi & Faruqi partner Josh Wilson directly at 877-247-4292 or 212-983-9330 (Ext. 1310). [You may also click here for additional information] New York, New York--(Newsfile Corp. - July 31, 2026) - Faruqi & Faruqi, LLP, a leading national securities law firm, is investigating potential claims against ADMA Biologics, Inc. ("ADMA Biologics" or the "Company") (NASDAQ: ADMA) and reminds investors of the August 10, 2026 deadline to seek the role of lead plaintiff in a federal securities class action that has been filed against the Company.

globenewswire.com2026-07-31

The Gross Law Firm Reminds Shareholders of a Lead Plaintiff Deadline of August 10, 2026 in ADMA Biologics, Inc. Lawsuit - ADMA

NEW YORK, July 31, 2026 (GLOBE NEWSWIRE) -- The Gross Law Firm issues the following notice to shareholders of ADMA Biologics, Inc. (NASDAQ: ADMA). Shareholders who purchased shares of ADMA during the class period listed are encouraged to contact the firm regarding possible lead plaintiff appointment.

globenewswire.com2026-07-31

The Gross Law Firm Reminds Shareholders of a Lead Plaintiff Deadline of August 10, 2026 in ADMA Biologics, Inc. Lawsuit - ADMA

NEW YORK, July 31, 2026 (GLOBE NEWSWIRE) -- The Gross Law Firm issues the following notice to shareholders of ADMA Biologics, Inc. (NASDAQ: ADMA).

globenewswire.com2026-07-31

AUGUST 10, 2026 INVESTOR DEADLINE: ADMA Biologics, Inc. (ADMA) Investors with Substantial Losses Have Opportunity to Lead Shareholder Class Action Lawsuit, Robbins Geller Rudman & Dowd LLP Announces

SAN DIEGO, July 31, 2026 (GLOBE NEWSWIRE) -- The law firm of Robbins Geller Rudman & Dowd LLP announces that purchasers or acquirers of ADMA Biologics, Inc. (NASDAQ: ADMA) publicly traded securities between August 9, 2024 and March 25, 2026, both dates inclusive (the “Class Period”), have until Monday, August 10, 2026 to seek appointment as lead plaintiff of the ADMA Biologics class action lawsuit. Captioned Mazzarino v.

globenewswire.com2026-07-31

$ADMA Securities: Suffer Losses on Your ADMA Biologics Investment? BFA Law Reminds Investors of the Securities Fraud Lawsuit to Recover Losses

NEW YORK, July 31, 2026 (GLOBE NEWSWIRE) -- Leading securities law firm  Bleichmar Fonti & Auld LLP announces that a class action lawsuit has been filed against ADMA Biologics, Inc. (NASDAQ:ADMA) and certain of the Company's senior executives for securities fraud after its significant stock drop resulting from potential violations of the federal securities laws. If you invested in ADMA Biologics, you are encouraged to obtain additional information by visiting: https://www.bfalaw.com/cases/adma-biologics-class-action-lawsuit.

prnewswire.com2026-07-31

ADMA Investors Have Opportunity to Lead ADMA Biologics, Inc. Securities Fraud Lawsuit with SBS Law

LOS ANGELES, July 31, 2026 /PRNewswire/ -- Schall, Brown & Schwartz LLP ("SBS"), a national shareholder rights litigation firm, reminds investors of a class action lawsuit against ADMA Biologics, Inc. ("ADMA" or "the Company") (NASDAQ: ADMA) for violations of §§10(b) and 20(a) of the Securities Exchange Act of 1934 and Rule 10b-5 promulgated thereunder by the U.S. Securities and Exchange Commission. Shareholders who purchased shares of ADMA during the class period listed are encouraged to contact the firm regarding possible lead plaintiff appointments.

📊 AI Financial Analysis

Powered by StockMarketInfo
Earnings Data: Q Ending 2026-03-31

"ADMA reported Q1’26 revenue of $114.5M and EPS of $0.19, with net income of $45.3M (net margin 39.6%). On a YoY basis (vs. 2025-03-31), revenue was essentially flat at +0.0% ($114.5M vs. $114.8M) while net income rose +68.4% ($45.3M vs. $26.9M). QoQ (vs. 2025-12-31), revenue declined -17.7% ($114.5M vs. $139.2M) and net income decreased -8.2% ($45.3M vs. $49.4M). Profitability improved markedly versus last year: gross margin expanded to 70.5% from 53.2% YoY, and net margin increased to 39.6% from 23.4%—suggesting a favorable mix/controlling costs despite lower top-line QoQ. Cash generation was strong in Q1’26 with operating cash flow of $58.2M and free cash flow of $55.7M. Balance sheet resilience improved in liquidity: cash and equivalents increased to $138.2M from $87.6M QoQ, while net debt turned positive to about $66.3M (down from net cash in Q4’25). There were no dividends; shareholder returns appear driven primarily by price/market moves and buybacks (Q1’26 buybacks were $0 per the dataset). Total shareholder returns were weak given the stock’s -48.1% 1-year change and below-target valuation sentiment; the stock trades at rich earnings multiples based on the provided ratios."

Revenue Growth

Neutral

Revenue was flat YoY (+0.0% vs 2025-03-31) but fell -17.7% QoQ (vs 2025-12-31), indicating no clear recent acceleration in topline.

Profitability

Good

Profitability expanded strongly YoY: gross margin 70.5% vs 53.2% and net margin 39.6% vs 23.4%; QoQ net income was down (-8.2%) but margins remained elevated versus the prior-year level.

Cash Flow Quality

Positive

Q1’26 delivered strong cash conversion with operating cash flow of $58.2M and free cash flow of $55.7M; no dividends and no buybacks in the quarter (per data).

Leverage & Balance Sheet

Fair

Liquidity improved materially (cash up to $138.2M from $87.6M QoQ). However, leverage is meaningful with long-term debt $199.9M and total debt about $204.4M; net debt was positive at ~$66.3M vs net cash slightly negative previously.

Shareholder Returns

Neutral

Market performance was negative: 1Y change -48.1% (well below the +20% momentum threshold). No dividend support; buybacks were not evident in Q1’26.

Analyst Sentiment & Valuation

Caution

Street consensus target ~$22.5 vs. current price $11.01 suggests upside, but valuation appears expensive on the provided trailing earnings multiples, and recent price action has been weak.

Disclaimer:This analysis is AI-generated for informational purposes only. Accuracy is not guaranteed and this does not constitute financial advice.

Fundamentals Overview

Loading fundamentals overview...

ADMA started Q1 2026 with strong profitability and cash generation despite flat top-line growth. Gross margin surged to 71% (from 53% YoY) and adjusted EBITDA rose 24% to $59.7M, supported by continued ASCENIV momentum (+28% YoY to $97.5M). The main offset was BIVIGAM, down 54% to $15.4M, attributed to industry-wide oversupply and aggressive new-entrant discounting/rebating that shifted distributor ordering patterns rather than harming ASCENIV end-demand. Management described the channel disruption emerging from late February/early March, with early signs of reversion in April (ASCENIV April utilization “record” and aligned with Q1 direct sales run rate). The company raised 2026 revenue guidance to $530M–$560M and EBITDA to $265M–$300M, but withdrew longer-term guidance due to limited visibility. Working capital remains the key swing factor: DSOs were ~107 days, with improvement expected to 90–105 in the back half as McKesson ramps and ordering normalizes.

AI IconGrowth Catalysts

  • ASCENIV end-market demand reached record levels; Q1 ASCENIV revenue grew ~28% YoY with record new patient starts, prescriber adoption, product pull-through, and patient adherence
  • ASCENIV pediatric label expansion approval (commercial opportunity referenced as near-term catalyst)
  • Upcoming SG-001 preclinical data publication/presentation at the International Society of Pneumonia and Pneumococcal Diseases Conference (oral and poster sessions)
  • Yield enhancement manufacturing process supporting increasing ASCENIV demand and future SG-001 hyperimmune plasma value capture
  • Completed monetization of 3 plasma centers during the quarter to enhance liquidity while diversifying plasma sourcing

Business Development

  • McKesson Specialty distribution agreement: management expects it to continue ramping in 2026 and contribute to DSO improvement
  • Florida Cancer Group: described as working exclusively through McKesson Specialty business
  • New third-party plasma supplier added as part of diversified plasma sourcing (3 plasma centers monetized; balanced internal + third-party procurement)

AI IconFinancial Highlights

  • Total revenue $114.5M vs $114.8M prior-year period (flat YoY); revenue decline driven by BIVIGAM down 54% to $15.4M
  • ASCENIV revenue $97.5M (+28% YoY); intermediates/other products declined $3M YoY
  • Gross margin expanded to 71% vs 53% YoY (gross profit $80.8M)
  • Adjusted EBITDA $59.7M (+24% YoY)
  • Adjusted net income $40.7M; GAAP net income $45.3M
  • Operating cash flow ~$58M; additional $5M proceeds from sale of 3 plasma centers
  • DSOs increased to ~107 days in Q1 2026; company targets 90–105 days (improvement expected in back half as ordering patterns normalize and McKesson ramps)
  • Company withdrew longer-term guidance due to limited visibility amid competitive landscape/ordering volatility
  • 2026 full-year guidance (as updated): revenue $530M–$560M; adjusted EBITDA $265M–$300M; adjusted net income $170M–$200M; commentary indicates conservative assumptions reflecting sustained standard IG pressure for remainder of 2026

AI IconCapital Funding

  • Pro forma net leverage below 0.5x (even after revolving credit facility draw and accelerated share repurchase deployment)
  • Retained ~$100M additional borrowing capacity
  • Share repurchases: through March 31, company converted ~3.6% of outstanding share count into treasury stock
  • Cash and cash equivalents ended quarter at $138M

AI IconStrategy & Ops

  • Reduced expenses in a targeted manner to improve profitability without adversely impacting core operations
  • Balanced internal and third-party plasma procurement to support near- and long-term ASCENIV growth objectives
  • Pricing discipline emphasized: management characterized BIVIGAM competition as driven by competitors’ discounting/rebating while stating ADMA’s ASP is predictable and disciplined; no plan for heavy ASCENIV discounting
  • Supply chain/risk framing: distributors required to maintain safety stock plus extra stock for potential disruptions; management cited distributor inventory/pull-through as consistent with industry peers

AI IconMarket Outlook

  • Reversion signals: management observed signs of reversion in Q2, with second-quarter run rate (based on April demand) in line with Q1 direct sales
  • DSO outlook: stabilize and improve toward 90–105 days in back half of 2026
  • Competitive pressure outlook: sustained standard IG competitive pressures assumed through remainder of 2026 (timing uncertain); longer-term guidance withdrawn

AI IconRisks & Headwinds

  • Standard IG market dislocation from oversupply of raw plasma and elevated PDT/IG finished goods inventories plus aggressive discounting/rebating from new entrants
  • Wholesaler/distributor ordering pattern changes created timing variability and disproportionately impacted BIVIGAM (BIVIGAM revenue down 54% YoY)
  • Uncertainty in competitive landscape reduces longer-term visibility (management withdrew longer-term guidance)
  • Pricing erosion risk: management cited competitor ASP erosion of ~15%–20% from launch to second quarter levels reported to CMS
  • Working-capital pressure: DSOs rose to ~107 days from target 90–105 days (expected normalization with ordering patterns and McKesson ramp)

Q&A: Analyst Interest

  • Topic: Timing and duration of standard IG channel dislocation; what to watch for normalization. Management said competitive rebating/discounting intensified toward end-February/beginning-March, with distributors reporting preparation then sudden dislocation. They cited BIVIGAM utilization reverting in late March and April (April best month so far) while ASCENIV hit record April utilization.
  • Topic: 2026 guidance drivers split between ASCENIV and BIVIGAM plus quantification of pricing pressure. Management said guidance assumes sustained standard IG pressure for the remainder of 2026 and conservative posture due to limited visibility. They quantified competitor ASP erosion at ~15%–20% from launch to Q2. BIVIGAM is impacted by ordering patterns; ASCENIV is insulated with accelerating pull-through and yield-enhanced production.
  • Topic: DSO improvement plan and cash-flow implications; role of McKesson and distribution practices. Management noted Q1 DSOs at ~107 days and targeted 90–105 days in the back half. They attributed progress to McKesson Specialty ramp increasing as a distribution-partner mix, ordering normalization, and tailoring back concessions provided earlier in 2026.

Sentiment: MIXED

Note: This summary was synthesized by AI from the ADMA Q1 2026 earnings transcript. Financial data is complex; please verify all metrics against official SEC filings before making investment decisions.

📋 Official Regulatory 10-K / 10-Q SEC Filings

Direct authenticated documentation links to audited SEC database reports for ADMA.

SEC EDGAR Live Feed
Loading financial data and tables...
📁

SEC Filings (ADMA)

© 2026 Stock Market Info — ADMA Biologics, Inc. (ADMA) Financial Profile