BXP, Inc.

BXP, Inc. (BXP) Market Cap

BXP, Inc. has a market capitalization of $11.18B.

Price: $70.12

-1.55 (-2.16%)

Market Cap: 11.18B

NYSE · time unavailable

CEO: Owen David Thomas

Sector: Real Estate

Industry: REIT - Office

IPO Date: 1997-06-18

Website: https://www.bxp.com

BXP, Inc. (BXP) - Company Information

Market Cap: 11.18B|Sector: Real Estate

Company Profile

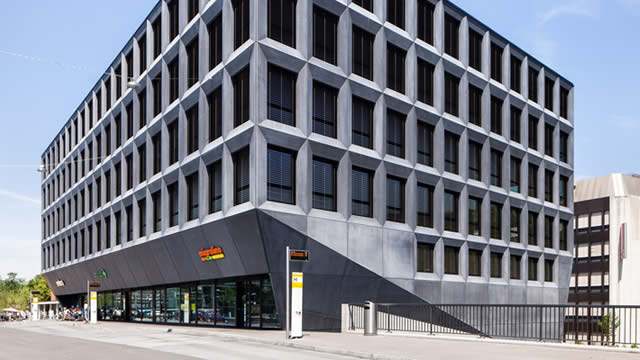
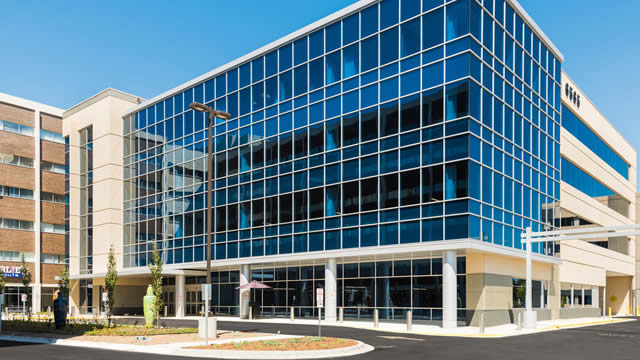
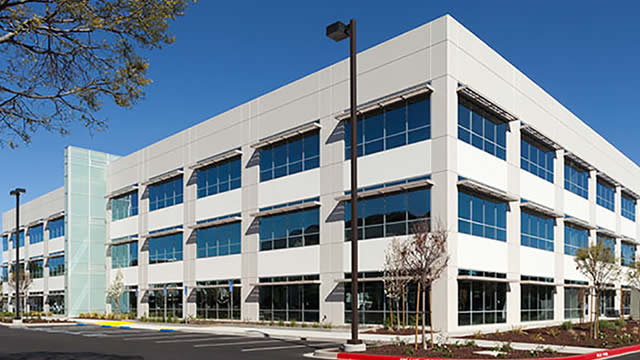
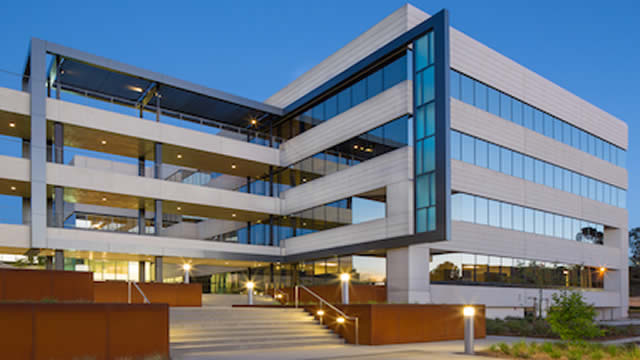
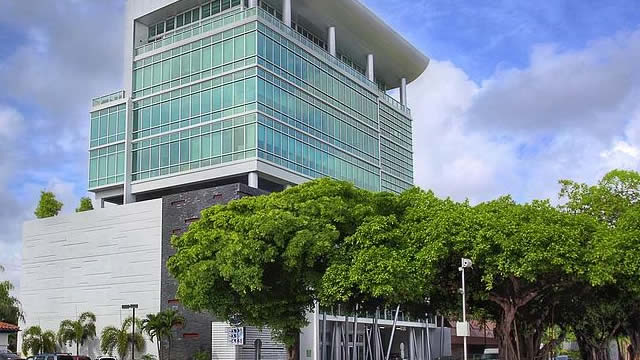
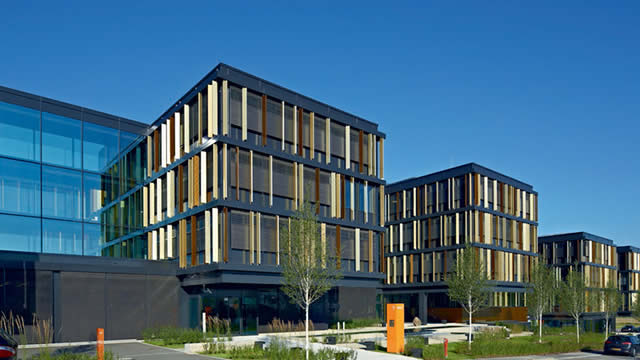
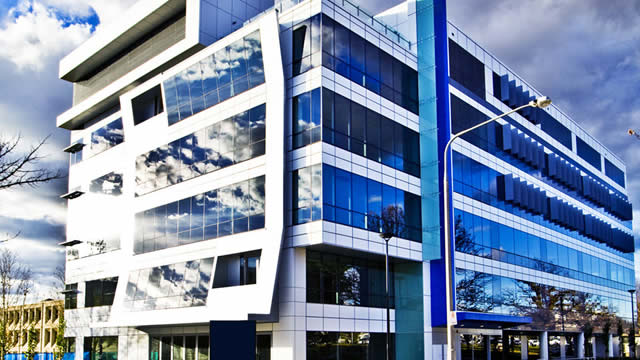
BXP, trading on the NYSE, is the leading publicly listed company engaged in the development and ownership of premier Class A office properties across the United States. Its operations are strategically concentrated in five major urban centers: Boston, Los Angeles, New York, San Francisco, and Washington, D.C. Structured as a Real Estate Investment Trust (REIT), the company operates as a comprehensive real estate entity, involved in the full spectrum of activities from developing and acquiring to managing and operating a diverse collection of primarily Class A office assets. Its current property holdings consist of 196 assets, collectively spanning 51.2 million square feet, which includes six properties actively undergoing construction or significant redevelopment.

Analyst Sentiment

72%
Buy

From 22 Active Polls

1Y Forecast: $70.09

▼ -0.0% Potential Upside

Consensus Target Metrics

Low Bound

$61

Median

$68

High Bound

$86

Average

$70

Price & Moving Averages

Loading chart...

🎯 Wall Street Analyst Intelligence Report

1-Year structural target targets, chart projections, and sentiment maps.

Average 1Y Target
$70.09
▼ -0.04% Upside
Low Target
$61.00
-13% Risk
Median Target
$68.00
-3% Mid
High Target
$86.00
23% Max
Consensus
Buy
25 / 43 Buys

Consensus Trend Projection

Trailing closures vs. 12-month metrics map.

Analyst Vote Distribution

Aggregate institutional coverage sentiment weights.

📊 Historical Valuation Multiples

Real-time Trailing Twelve Month (TTM) momentum side-by-side with discrete quarterly metrics.

Fiscal QuarterTTMQ2 2026Q1 2026Q4 2025Q3 2025Q2 2025Q1 2025Q4 2024Q3 2024
Period EndingTrailing 12MJun 30, 2026Mar 31, 2026Dec 31, 2025Sep 30, 2025Jun 30, 2025Mar 31, 2025Dec 31, 2024Sep 30, 2024
Market Cap ($M)11,18310,5548,23710,74911,77110,67410,63011,70912,691
Enterprise Value ($M)26,98826,35923,69526,62928,25827,56726,66727,77928,248
Price to Earnings Ratio (P/E)37.5038.5520.2710.75-24.1430.1243.07-12.8237.95
Price/Earnings-to-Growth Ratio (PEG)14.2816.76-68.6680.3855.6636.91
Price to Sales Ratio (P/S)3.1811.789.4412.2513.5112.2912.2913.6414.77
Price to Book Ratio (P/B)2.162.041.602.092.352.032.002.162.20
Price to Free Cash Flow Ratio (P/FCF)24.02-62.4840.2491.8652.82115.1650.2573.15
Enterprise Value to Sales (EV/Sales)29.4327.1730.3632.4231.7430.8232.3532.88
Enterprise Value to EBITDA (EV/EBITDA)14.4753.4858.1839.0999.6354.5056.71170.2657.12
Debt to Equity Ratio8.473.173.103.373.463.303.093.202.95

📘 Full Research Report

ℹ️

AI-Generated Research: This report is for informational purposes only.

📘 BXP INC (BXP) — Investment Overview

🧩 Business Model Overview

BXP is a large, vertically integrated office-focused real estate investment trust (REIT) with an emphasis on owning, operating, and selectively redeveloping Class A properties in high-barrier submarkets. The operating engine is straightforward: lease commercial space to tenants, collect base rent and tenant reimbursements (for operating expenses and taxes), and manage ongoing property operations to preserve net operating income (NOI). A meaningful portion of value creation comes from leasing strategy (tenant retention, credit selection, and renewal terms), capital allocation (capital improvements and redevelopment), and active asset management in markets where location, building quality, and amenity sets are scarce.

Tenant stickiness is driven by lease-backing constraints, buildout costs, and the friction of relocating teams in dense business districts—factors that tend to favor well-located, institutional-grade assets over commodity office space.

💰 Revenue Streams & Monetisation Model

BXP’s monetisation is dominated by recurring cash flows from office tenants:

  • Base rent: primary source of revenue tied to lease terms and renewal/rollover dynamics.
  • Tenant reimbursements: pass-throughs for property operating expenses, utilities, and taxes, supporting NOI resilience.
  • Parking and ancillary income: smaller but steadier revenue lines in many submarkets.
  • Development and redevelopment economics: value crystallises through leasing stabilized space (and, where applicable, sale or joint-venture monetisation of developed exposure).

Margin structure for an office REIT is typically more sensitive to NOI/occupancy and leasing spreads than to revenue volume. Key economic drivers include controllable operating costs, the ability to re-lease space at attractive economics, and the timing/scale of capital expenditures needed to maintain building competitiveness (especially for tenant-driven upgrades such as lobbies, elevators, HVAC, and amenity programming).

🧠 Competitive Advantages & Market Positioning

The primary moat is a combination of location scarcity and switching frictions anchored in a consistently institutional-grade asset base:

  • Switching costs (tenant-specific and logistical): relocating corporate teams involves non-trivial transaction costs (brokerage, fit-out, technology, brand/customer presence) and risk to operational continuity. Premium buildings in central business districts reduce those frictions due to established infrastructure, transit access, and high-quality specifications.
  • Asset quality as an operating advantage: competing with newer, amenity-rich supply requires sustained capex and construction/operations competence. BXP’s scale and in-house operating discipline allow it to execute improvements and maintain competitiveness.
  • Capital allocation capability: selective redevelopment and repositioning can transform aging stock into space that better matches evolving tenant requirements, supporting re-leasing economics over time.

Competitive benchmarking: Office REIT exposure is competed primarily on submarket concentration, building quality, and leasing execution. Key rivals include:

  • Vornado Realty Trust (VNO)
  • SL Green Realty (SLG)
  • Kilroy Realty (KRC) (West Coast office tilt, primarily)

BXP’s differentiation is its focus on premier, dense employment nodes and its track record of operating and redeveloping Class A assets in those markets. Many peers possess valuable portfolios, but BXP’s positioning emphasizes the ability to keep a large share of exposure in high-demand urban locations and to upgrade buildings to remain tenant-preferred as leasing standards evolve.

🚀 Multi-Year Growth Drivers

Growth over a 5–10 year horizon is best framed as stability plus selective upside, driven by redevelopment cycles and long-duration demand for high-quality space in constrained submarkets:

  • Upgrade cycle for “tenant-preferred” offices: tenants increasingly demand superior building systems, amenity ecosystems, and flexible environments. Redevelopment and modernization can support higher renewals and mitigate economic friction on transitions.
  • Constrained supply in prime locations: central business districts tend to face land scarcity and higher replacement costs, favoring established owners with well-located assets.
  • Leasing execution through asset management: maintaining tenant quality and retention reduces downtime and helps preserve NOI through lease rollover events.
  • Strategic redevelopment and reconfiguration: repositioning older floorplates and building amenities improves addressable tenant segments and can expand utilization in specialized use cases.
  • Capital recycling and balance-sheet discipline: the ability to fund improvements through disciplined capital allocation supports resilience across credit cycles and keeps the portfolio competitive.

Net result: the investment thesis relies on the expectation that the gap between prime assets and commoditised office will remain structurally wide, allowing BXP to protect cash flows while selectively capturing improvement in leasing demand and terms.

⚠ Risk Factors to Monitor

  • Secular office demand and occupancy variability: changes in workforce patterns can extend leasing timelines and increase tenant concessions, especially for less differentiated space.
  • Interest-rate and capital-market sensitivity: office REIT valuations and refinancing terms respond to cap rates and credit spreads, affecting development optionality and balance-sheet flexibility.
  • Tenant credit concentration: a portfolio skew toward certain industries or tenant sizes can amplify cash-flow volatility if demand weakens for those user groups.
  • Capital intensity and execution risk: redevelopment and modernization require sustained capex and accurate budgeting; cost overruns or construction delays can impair projected returns.
  • Regulatory and compliance costs: building standards, energy-efficiency rules, and local ordinances can increase operating expenses and capex needs.

📊 Valuation & Market View

The market typically values BXP and peer office REITs through a mix of:

  • NAV/discounted cash-flow frameworks: reflecting the net value of real estate assets and development pipeline after costs, leasing assumptions, and capex needs.
  • FFO and NOI-based multiples: linking valuation to property cash generation rather than accounting earnings.
  • Cap-rate and cost-of-debt sensitivity: changes in perceived risk, financing rates, and liquidity conditions affect asset pricing and refinancing economics.

Drivers that tend to move the needle include leasing spreads, occupancy/renewal outcomes, the pace and success of redevelopment leasing, the stability of operating costs, and the strength of the balance sheet (including refinancing access and maturity structure). In office, valuation dispersion across portfolios often reflects the degree of differentiation and likelihood of sustained cash-flow durability.

🔍 Investment Takeaway

BXP’s investment case rests on durable differentiation in prime urban office assets—supported by location scarcity, tenant switching frictions, and an operating/redevelopment capability that can preserve cash-flow quality through market cycles. The principal value lever is maintaining and upgrading a portfolio that remains tenant-preferred, enabling resilient NOI generation while selectively capturing redevelopment upside. Key monitoring items are office demand durability, financing conditions, and redevelopment execution, all of which determine how quickly leasing economics translate into long-term per-share value creation.


⚠ AI-generated — informational only. Validate using filings before investing.

📰 Market News & Coverage

15 Stories Available

Real-time institutional reporting and market updates for BXP.

defenseworld.net2026-07-30

BXP, Inc. $BXP Shares Sold by Allspring Global Investments Holdings LLC

Allspring Global Investments Holdings LLC decreased its holdings in BXP, Inc. (NYSE: BXP) by 99.6% in the undefined quarter, according to the company in its most recent Form 13F filing with the SEC. The firm owned 7,411 shares of the real estate investment trust's stock after selling 2,061,746 shares during the quarter. Allspring

marketbeat.com2026-07-29

BXP Q2 Earnings Call Highlights

BXP NYSE: BXP reported second-quarter results that exceeded its guidance and consensus expectations, citing stronger leasing, rising occupancy and better-than-expected portfolio net operating income. The office landlord raised the midpoint of its full-year 2026 funds from operations guidance by $0.05 per share to a range of $6.99 to $7.05 per share.

seekingalpha.com2026-07-29

BXP, Inc. (BXP) Q2 2026 Earnings Call Transcript

BXP, Inc. (BXP) Q2 2026 Earnings Call Transcript

zacks.com2026-07-29

BXP Q2 FFO & Revenues Beat Estimates on Occupancy Gains, '26 View Up

BXP tops Q2 FFO estimates as occupancy, leasing and NOI improve and raises its full-year 2026 FFO outlook on stronger-than-expected portfolio performance.

zacks.com2026-07-28

Boston Properties (BXP) Reports Q2 Earnings: What Key Metrics Have to Say

While the top- and bottom-line numbers for Boston Properties (BXP) give a sense of how the business performed in the quarter ended June 2026, it could be worth looking at how some of its key metrics compare to Wall Street estimates and year-ago values.

seekingalpha.com2026-07-28

BXP: Solid Q2, But Long-Term Debt Concerns Limit Upside

BXP remains a "Hold" as near-term fundamentals are solid, but long-term debt concerns persist. Recent leasing momentum, low lease maturities, and strong Boston occupancy support stable FFO guidance of $7.05 for 2024. Balance sheet leverage remains elevated at 7.9x net debt/EBITDA, with $15.4 billion in debt and refinancing headwinds ahead.

zacks.com2026-07-28

Boston Properties (BXP) Q2 FFO and Revenues Surpass Estimates

Boston Properties (BXP) came out with quarterly funds from operations (FFO) of $1.78 per share, beating the Zacks Consensus Estimate of $1.71 per share. This compares to FFO of $1.71 per share a year ago.

businesswire.com2026-07-28

BXP Secures $1.2 Billion Construction Loan for 343 Madison Avenue

BOSTON--(BUSINESS WIRE)--BXP, Inc. (NYSE: BXP), the largest publicly traded developer, owner, and manager of premier workplaces in the United States, announced today that it has closed a $1.2 billion construction loan for the development of 343 Madison Avenue, a planned 46-story, approximately 930,000-square-foot premier workplace tower in Midtown Manhattan with direct access to Grand Central Terminal's Madison Concourse. The financing represents a significant milestone in the capitalization of.

businesswire.com2026-07-28

BXP Announces Second Quarter 2026 Results

BOSTON--(BUSINESS WIRE)--BXP, Inc. (NYSE: BXP), the largest publicly traded developer, owner, and manager of premier workplaces in the United States, reported results today for the second quarter ended June 30, 2026. Second Quarter 2026 Financial Highlights Revenue increased 3.1% to $895.7 million for the quarter ended June 30, 2026, compared to $868.5 million for the quarter ended June 30, 2025. Net income attributable to BXP, Inc. of $68.6 million, or $0.43 per diluted share (EPS), for the qu.

zacks.com2026-07-22

BXP to Post Q2 Earnings: Is the Stock a Portfolio Must-Have?

BXP to report Q2 results on July 28, with AI-driven leasing, strong demand for premium offices and signed deals in focus as revenues are expected to edge higher.

zacks.com2026-07-06

Is BXP Stock Worth Retaining in Your Portfolio for the Long Run?

BXP benefits from solid leasing, asset sales, redevelopment projects and ample liquidity, though office market competition and execution risks persist.

businesswire.com2026-06-29

BXP to Release Second Quarter 2026 Financial Results on July 28, 2026

BOSTON--(BUSINESS WIRE)--BXP, Inc. (NYSE: BXP), the largest publicly traded developer, owner, and manager of premier workplaces in the United States, announced today that it will release financial results for the second quarter 2026 on Tuesday, July 28, 2026, after the close of trading on the NYSE. BXP will host a conference call and webcast on Wednesday, July 29, 2026, at 10:00 A.M. Eastern Time, to discuss the financial results and provide an update on BXP. Participants who would like to join.

zacks.com2026-06-25

BXP Secures 320K Sq.Ft. Lease With Boston Dynamics at Reservoir Place

BXP signs a long-term 320,000-square-foot lease with Boston Dynamics at Reservoir Place. This represents one of Greater Boston's largest innovation office deals this year.

businesswire.com2026-06-24

BXP Executes 320,000 Square Foot Lease with Boston Dynamics at Reservoir Place

BOSTON--(BUSINESS WIRE)--BXP (NYSE: BXP), the largest publicly traded developer, owner, and manager of premier workplaces in the United States, today announced a long-term lease agreement with Boston Dynamics for approximately 320,000 square feet at Reservoir Place, a 530,000 square foot building located at 1601 Trapelo Road in Waltham, Massachusetts. The lease marks one of the largest innovation-driven office transactions in Greater Boston this year and supports Boston Dynamics' plans for a si.

businesswire.com2026-06-17

BXP Declares Regular Quarterly Dividend

BOSTON--(BUSINESS WIRE)--BXP, Inc. (NYSE: BXP), the largest publicly traded developer, owner, and manager of premier workplaces in the United States, announced today that its Board of Directors declared a regular quarterly cash dividend of $0.70 per share of common stock for the period April 1, 2026 to June 30, 2026, payable on July 31, 2026 to shareholders of record as of the close of business on June 30, 2026. BXP, Inc. (NYSE: BXP) is the largest publicly traded developer, owner, and manager.

📊 AI Financial Analysis

Powered by StockMarketInfo
Earnings Data: Q Ending 2026-03-31

"BXP (Q1’26, ended 2026-03-31) reported Revenue of $872.1M and Net Income of $101.6M, with EPS of $0.64. YoY growth was modest: Revenue rose +0.8% (from $865.2M in Q1’25) while Net Income declined -9.1% (from $61.2M in Q1’25 to $101.6M in Q1’26; note the provided quarterly series shows a stronger Q1’25 base for margin context). QoQ, Revenue was roughly flat (-0.6% vs $877.1M in Q4’25), but Net Income fell -59.1% (from $248.5M in Q4’25). Profitability softened sequentially: net margin contracted to 11.6% from 28.3% in Q4’25, with operating margin down to 26.1% from 55.9%. Over the full 4-quarter window, results appear volatile, with a loss in Q3’25 (net margin -14.0%) and a rebound in Q2’25 and Q4’25 before the Q1’26 pullback. Cash generation weakened materially in Q1’26. Operating cash flow was $156.5M and free cash flow turned negative at -$131.8M (capex of -$288.3M), alongside dividends paid of -$124.1M. Balance sheet resilience remains mixed: total assets were $25.1B and equity $5.15B, but leverage is high (total debt ~$15.97B; net debt ~$15.46B). Shareholder returns: the stock is down -7.96% over 1Y with a modest dividend yield (~1.5%); no strong positive momentum signal. Overall, the quarter shows near-flat top-line but margin and cash-flow deterioration QoQ."

Revenue Growth

Neutral

Revenue was +0.8% YoY in Q1’26 ($872.1M vs $865.2M) and -0.6% QoQ ($877.1M in Q4’25 vs $872.1M). Overall trend is steady but not accelerating.

Profitability

Caution

Net margin contracted sharply QoQ to 11.6% from 28.3% in Q4’25; operating margin fell to 26.1% from 55.9%. Over the 4-quarter span, profitability was volatile (loss in Q3’25).

Cash Flow Quality

Neutral

Operating cash flow was $156.5M in Q1’26, but free cash flow was -$131.8M due to higher capex. Dividends remain sizable (-$124.1M), and Q1’26 FCF did not cover them.

Leverage & Balance Sheet

Fair

Balance sheet size is stable (assets $25.1B) with equity around $5.15B, but leverage remains high (total debt ~$15.97B; net debt ~$15.46B). Equity did not show major QoQ deterioration.

Shareholder Returns

Fair

Dividend yield is ~1.5%, but total return is muted by weak price momentum (1Y change -7.96%). No buyback support is evident in the cash flow beyond small repurchases (-$0.9M).

Analyst Sentiment & Valuation

Neutral

With current price $58.05 and consensus target ~$72.1, implied upside is attractive (~+24%). Valuation multiples are not provided for trend, but the price-to-earnings in the latest period is ~20.3x.

Disclaimer:This analysis is AI-generated for informational purposes only. Accuracy is not guaranteed and this does not constitute financial advice.

Fundamentals Overview

Loading fundamentals overview...

BXP delivered a strong Q2 2026 driven primarily by faster-than-expected leasing velocity and occupancy gains. FFO per share of $1.78 beat guidance/consensus by $0.08, and full-year 2026 FFO guidance was raised to $6.99–$7.05 (midpoint +$0.05). Occupancy climbed 100 bps to 88.4% and management gained 170 bps of the expected 2026 occupancy improvement, supported by ~1.8 million sq ft leased in the quarter (29% above the 10-year average). The demand narrative is reinforced by AI-related leasing wins and premier workplace market fundamentals (direct vacancy 8% vs 13.5% broader office; >60% rent premium). On capital strategy, BXP advanced asset sales ahead of schedule and closed a $1.2B construction loan for 343 Madison. Asset-sale timing increases 2026 dilution vs prior expectations (~$0.11), but should reduce leverage toward low-7x and fund developments; buybacks remain conditional. Risks are mainly around incremental demand softness and Urban Edge lab-market sluggishness.

AI IconGrowth Catalysts

  • Leased nearly 1.8 million sq ft in Q2 2026 (29% above 10-year historical average for the quarter) and 3+ million sq ft year-to-date, lifting in-service occupancy
  • AI-driven leasing demand: new/expanding AI, robotics and AI tools clients across San Francisco, New York, Seattle, plus displaced users and supporting financial/legal/pro services tenants
  • Premier Workplaces outperformance vs broader office market: Q2 direct vacancy 8% vs 13.5% broader office; asking rents >60% premium; expected to support additional rent increases
  • Development delivery and lease-up with fully leased or strongly contracted status before/at service (e.g., 290 Binney Street delivered fully leased to AstraZeneca)

Business Development

  • AstraZeneca: 570,000 sq ft lab building at 290 Binney Street (delivered fully leased; economic/efficiency highlights provided)
  • McDermott Will & Emery: 148,000 sq ft lease signed at 343 Madison Avenue (Midtown Manhattan)
  • Starr: expanded by two floors at 343 Madison Avenue
  • Boston Dynamics: 320,000 sq ft long-term lease at Reservoir Place (Robotics and AI center at a redeveloped site)
  • Amazon: Tower 1 at West Main (Bellevue) fully leased to Amazon (referenced as a comp transaction under agreement to sell)
  • Boston area life science client demand/leases mentioned: Quarry (50,000 sq ft lease) and 888 Boylston Street first renewal wave (no named counterparty provided)
  • Rogo: extension and expansion (AI tools for financial institutions; client also announced job expansions)
  • Stripe: 44,000 sq ft expansion in Seattle (low-TI expansion; referenced as vacant-space activity)

AI IconFinancial Highlights

  • FFO per share $1.78 exceeded guidance and consensus midpoint by $0.08; raised full-year 2026 FFO guidance midpoint by $0.05
  • Revenues exceeded expectations by $0.04 per share: +$0.03 rental revenues and +$0.01 service income
  • Portfolio NOI drive: occupancy climbed by 100 bps to 88.4% in Q2; raised average occupancy guidance +65 bps to 88.9%; now expects end-2026 closer to ~90% occupied
  • Operational expense tailwinds: +$0.04 per share outperformance from lower operating expenses; roughly half from lower repairs & maintenance expected to be deferred to later 2026 and embedded in back-half guidance
  • Lower utilities in Northeast from lighter energy consumption after building fine-tuning
  • Real estate tax impact: lower real estate tax due to real estate tax abatements received; continued aggressive appeals cited
  • Full-year 2026 guidance raised to $6.99–$7.05 FFO per share (midpoint +$0.05); same-property share of NOI growth assumption raised +30 bps to 1.8%–2.6%
  • Development portfolio NOI guidance increased by $0.03 per share based on faster lease-up and lower expenses
  • Asset sale dilution and timing effects: foregone NOI from sales reduced FFO by ~$0.02 per share vs prior assumptions; guidance also reflects lower net interest expense from deploying sales proceeds; fee income assumption +$0.01 per share

AI IconCapital Funding

  • 343 Madison Avenue financing: closed a $1.2 billion (60% loan-to-cost) 5-year construction loan; floating at SOFR +250 bps, stepping down to 225 bps at project milestones; interest capitalized until completion in 2029
  • Unsecured bond refinancing: $1.0 billion bond GAAP interest rate 3.5% expires October; management evaluating to optimize debt capital structure; credit spreads described as near all-time tights and issuance today would likely price around ~6%
  • Asset sales capital: raised $370 million total net sale proceeds year-to-date and >$1.2 billion since investor conference; $1.9 billion net sale proceeds objective by 2028; as of now up to ~$1.7 billion net proceeds possible by year-end, with ~six assets under contract (~$240 million total net proceeds, ~$180 million scheduled to close in 2026); 2026 dispositions include Washington, D.C. office buildings closing this quarter and additional marketing including 7 Times Square
  • Buyback optionality: management indicated potential stock buybacks contingent on achieving leverage and using excess sale proceeds, but no buyback dollar amount disclosed in the transcript

AI IconStrategy & Ops

  • Leasing acceleration vs plan: occupancy reached 88.4% as of June 30, gaining 170 bps of the 200 bps expected for 2026
  • Vacant/near-term expiry focus: Q2 leasing volume 1.76 million sq ft; covered additional 380,000 sq ft vacant space and renewed/backfilled 600,000 sq ft of 2026–2027 expirations; 800,000 sq ft additional occupancy pickup expected to close 2026 closer to ~90%
  • Portfolio lease-up pacing: start Q3 with ~1.3 million sq ft signed but not occupied; 2026 expected commencement ~1.1 million sq ft; known 2026 expirations down to ~300,000 sq ft
  • San Francisco Mountain View reset rents cited at ~ $45 triple-net; Seattle demand strength supported by low-cost expansions (e.g., Stripe 44k sq ft); Midtown Manhattan up 14% (contextual supply/demand)
  • Beginning capitalizing expenses at Reservoir Place with Boston Dynamics lease; redevelopment/repositioning referenced for supply optimization
  • Development/partnership monetization: sold 45% stake in 290 Binney Street property to a financial partner; stated returns: 8.9% unleveraged cash return and 10.3% GAAP return
  • Worldgate multi-family launch: 359 wood-frame residential units in Herndon, VA; budgeted cost $132 million; secured financial partner for 80% of equity and construction financing; rezoned from office; for-sale component under contract to a homebuilder; BXP reinvests apartment-land proceeds into JV for 20% interest

AI IconMarket Outlook

  • Guidance raised: 2026 FFO per share to $6.99–$7.05 (midpoint +$0.05); increased average occupancy assumption to 88.9% (+65 bps) and end-2026 closer to ~90% occupied
  • Occupancy target framing: management reaffirmed 91% end-2027; “map out” ultimate portfolio floor around ~94%–95% (with marginal availability due to 10-year leases and potential relocations)
  • Leasing/expirations visibility: Q3 start signed but not occupied ~1.3 million sq ft; remaining known 2026 expirations ~300,000 sq ft; 2027 expirations ~1.77 million sq ft

AI IconRisks & Headwinds

  • Urban Edge life science demand softness: management cited lackluster demand around lab space market for Urban Edge; IPO activity and pharma acquisition activity strong, but Series B/C/D moving slower
  • Incremental demand risk: management noted softer spot is incremental demand growth from traditional financial services/professional services/legal compared with stronger technology/AI and defense/cyber
  • Portfolio has remaining vacancy concentrations (Embarcadero Center SF; urban edge Boston suburbs; Santa Monica Colorado Center) that limit ability to exceed ~94%–95% stabilized occupancy
  • Asset sales timing/dilution uncertainty: dilution in 2026 revised higher due to accelerated sales timing (now closer to ~$0.11 vs prior $0.06–$0.09 range); reliance on completing contracted dispositions
  • Macro/interest rate sensitivity: bond refinancing and debt costs depend on market rates; guidance assumes leasing strength while office transaction volumes remain below pre-COVID

Q&A: Analyst Interest

  • Asset sales timing vs 2027 impact/buybacks: Management said dilution in 2026 is now closer to ~$0.11 vs prior $0.06–$0.09 as timing accelerates. They reiterated the leverage goal (low-7x) and stated 2027 isn’t guided, with $1.9B net sales by 2028; 2026 sales imply a lighter 2027.
  • Stabilized occupancy and whether it’s been pulled forward: Management (Doug) said they are still targeting 91% occupancy at end of 2027. With a faster trajectory, they implied they could exceed it, but aren’t ready to change guidance. They cited concentration risks in Embarcadero Center (late 2027/early 2028) and tertiary-market availables (urban edge Boston suburbs, Santa Monica).
  • Transaction market fundamentals and rates: Management described office transaction volumes as recovering—off the COVID lows and up over the last year—yet still below pre-COVID levels. They suggested much buying is from family offices/opportunistic capital seeking discounts to replacement cost, while higher rates can still impact land/residential/office pricing.

Sentiment: POSITIVE

Note: This summary was synthesized by AI from the BXP Q2 2026 earnings transcript. Financial data is complex; please verify all metrics against official SEC filings before making investment decisions.

📋 Official Regulatory 10-K / 10-Q SEC Filings

Direct authenticated documentation links to audited SEC database reports for BXP.

SEC EDGAR Live Feed
Loading financial data and tables...
📁

SEC Filings (BXP)

© 2026 Stock Market Info — BXP, Inc. (BXP) Financial Profile