EastGroup Properties, Inc.

EastGroup Properties, Inc. (EGP) Market Cap

EastGroup Properties, Inc. has a market capitalization of $11.24B.

Price: $209.01

-0.57 (-0.27%)

Market Cap: 11.24B

NYSE · time unavailable

CEO: Marshall A. Loeb

Sector: Real Estate

Industry: REIT - Industrial

IPO Date: 1983-10-21

Website: https://www.eastgroup.net

EastGroup Properties, Inc. (EGP) - Company Information

Market Cap: 11.24B|Sector: Real Estate

Company Profile

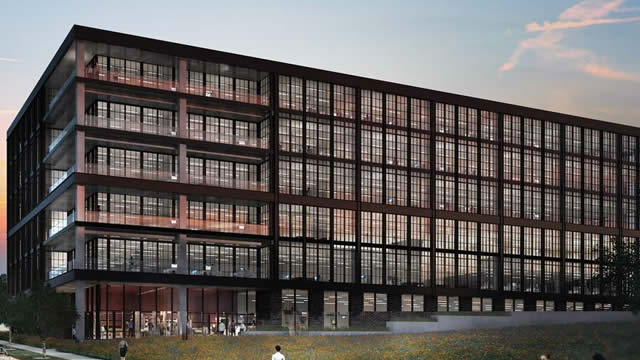
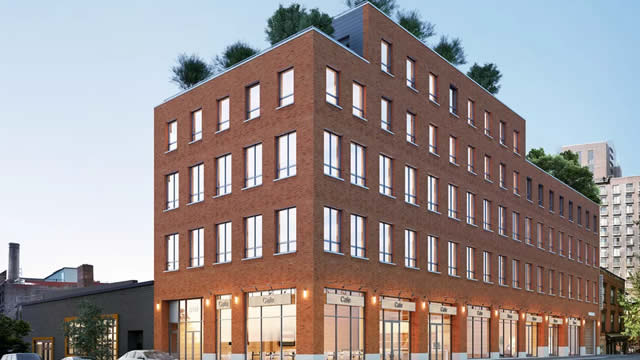
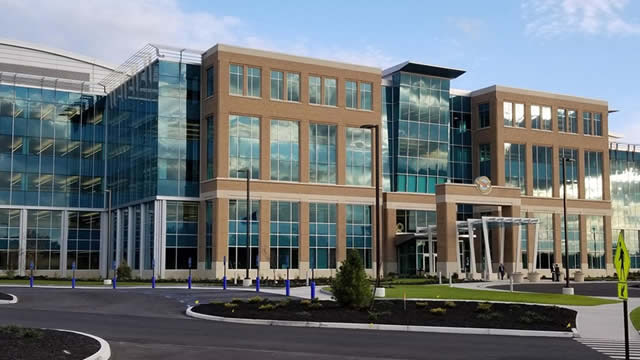
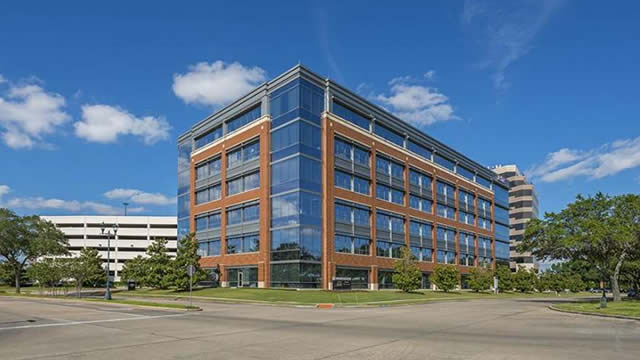
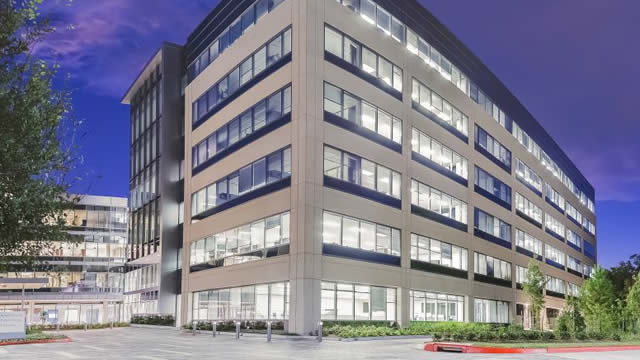
EastGroup Properties, Inc. (NYSE: EGP), a self-administered equity real estate investment trust and an S&P MidCap 400 company, specializes in the development, acquisition, and management of industrial properties. The company concentrates its efforts within major Sunbelt markets across the United States, with a particular focus on Florida, Texas, Arizona, California, and North Carolina. Its central aim is to enhance shareholder value by serving as a leading provider of adaptable, efficient, and high-quality business distribution facilities for location-sensitive clients, generally seeking spaces between 15,000 and 70,000 square feet. EastGroup's growth strategy prioritizes ownership of prime distribution centers, strategically positioned close to key transportation networks in submarkets where supply is limited. The firm's current portfolio encompasses approximately 45.8 million square feet, including properties under development, value-add acquisitions in lease-up, and those currently under construction.

Analyst Sentiment

77%
Strong Buy

From 20 Active Polls

1Y Forecast: $229.36

▲ +9.7% Potential Upside

Consensus Target Metrics

Low Bound

$206

Median

$230

High Bound

$268

Average

$229

Price & Moving Averages

Loading chart...

🎯 Wall Street Analyst Intelligence Report

1-Year structural target targets, chart projections, and sentiment maps.

Average 1Y Target
$229.36
▲ +9.74% Upside
Low Target
$206.00
-1% Risk
Median Target
$230.00
10% Mid
High Target
$268.00
28% Max
Consensus
Hold
16 / 33 Buys

Consensus Trend Projection

Trailing closures vs. 12-month metrics map.

Analyst Vote Distribution

Aggregate institutional coverage sentiment weights.

📊 Historical Valuation Multiples

Real-time Trailing Twelve Month (TTM) momentum side-by-side with discrete quarterly metrics.

Fiscal QuarterTTMQ2 2026Q1 2026Q4 2025Q3 2025Q2 2025Q1 2025Q4 2024Q3 2024
Period EndingTrailing 12MJun 30, 2026Mar 31, 2026Dec 31, 2025Sep 30, 2025Jun 30, 2025Mar 31, 2025Dec 31, 2024Sep 30, 2024
Market Cap ($M)11,23910,8709,8939,4888,9988,7759,1548,0639,129
Enterprise Value ($M)12,87412,50511,53111,23810,51410,23710,6289,59110,755
Price to Earnings Ratio (P/E)36.6035.9126.1435.0733.5834.5338.6334.2941.33
Price/Earnings-to-Growth Ratio (PEG)22.2217.5611.9912.2812.967.3347.8211.84
Price to Sales Ratio (P/S)14.9256.2352.0050.6149.4049.5053.0149.1556.05
Price to Book Ratio (P/B)3.143.042.772.712.562.582.742.453.22
Price to Free Cash Flow Ratio (P/FCF)25.2774.3578.07183.9974.8273.6480.36183.7084.12
Enterprise Value to Sales (EV/Sales)64.6860.6159.9557.7357.7461.5558.4766.03
Enterprise Value to EBITDA (EV/EBITDA)23.0888.7473.4185.7681.6583.0197.37100.1890.29
Debt to Equity Ratio2.930.470.470.500.430.440.450.470.58

📘 Full Research Report

ℹ️

AI-Generated Research: This report is for informational purposes only.

📘 EASTGROUP PROPERTIES REIT INC (EGP) — Investment Overview

🧩 Business Model Overview

EastGroup Properties REIT Inc (“EGP”) operates a real estate operating platform focused on acquiring, developing, and managing income-producing industrial properties. The value chain centers on (1) sourcing land and buildings in supply-constrained submarkets, (2) building or upgrading facilities that fit tenant operational needs, and (3) leasing space under terms that tend to be recurring and durable. Tenant demand is supported by logistics-driven site selection—near major highways, employment centers, and regional distribution nodes—where physical location and facility configuration materially affect operating efficiency.

A key stickiness mechanism is physical immobility: relocating industrial operations typically involves meaningful costs (lease termination, buildout, downtime, customer/operational transitions) and execution risk, which increases tenant retention when facilities remain well-matched to business requirements.

💰 Revenue Streams & Monetisation Model

EGP’s revenue is primarily recurring rental income generated from operating leases. Monetisation is driven by:

  • Base rent and contractual escalations tied to lease terms.
  • Tenant reimbursements and pass-through items common in industrial structures (e.g., taxes, insurance, and certain operating expenses), which can preserve cash margins relative to asset-heavy property management.
  • Ancillary income that is typically smaller and tied to property-level usage and recoveries.

Primary margin drivers are economic occupancy, rent growth (including re-leasing spread and renewal pricing), and cost discipline on property operations—while pass-through mechanisms can reduce downside sensitivity to expense inflation.

🧠 Competitive Advantages & Market Positioning

EGP’s competitive position is best understood as a combination of location-based scarcity and tenant switching friction, supported by a development and acquisition workflow tailored to specific industrial submarkets. The moat is not a software-style barrier; it is operational and geographic.

Moat thesis (hardness: moderate)

  • Switching Costs (tenant-level): Industrial users face high relocation friction. Even when a tenant could theoretically move, timing, buildout, and disruption costs create practical inertia—especially when facilities are suited to operational workflows.
  • Geographic Cost Advantage (market selection): EGP targets growth-oriented Sunbelt/major regional logistics markets where land availability and high-quality infill industrial supply can be constrained. That selection improves the probability of sustaining demand and controlling development yield risk.
  • Operational/Intangible Advantage: A long-running capability in site selection, development execution, leasing, and property-level optimization can compound over time through learnings that reduce miss-costs and improve re-leasing outcomes.

Competitive Benchmarking

  • Prologis: More diversified and global scale logistics operator. Prologis can compete aggressively through scale and capital access, with broader footprints across distribution formats.
  • Duke Realty / successor platforms: Large industrial operators with strong development pipelines in major metros.
  • STAG Industrial: Focused on industrial properties with a different risk/return profile and a broader single-property diversification strategy.

Compared with these national-scale peers, EGP’s positioning emphasizes concentrated market expertise and a focus on industrial submarkets where tenant demand fundamentals and supply dynamics support durable rental performance. The competitive difference is less about “bigger footprint” and more about quality of local execution.

🚀 Multi-Year Growth Drivers

Over a 5–10 year horizon, EGP’s growth outlook typically depends on four structural drivers:

  • Industrial space demand tied to real-economy logistics: Continued distribution network expansion, inventory placement, and regional fulfillment depth increase the need for well-located industrial square footage.
  • Infill and functional design relevance: As tenants modernize operations, facilities that match power, loading, ceiling heights, and layout needs can capture better retention and re-leasing spreads than generic stock.
  • Development/redevelopment monetisation: Turning underutilized sites or delivering new supply in constrained pockets supports a pathway to grow NOI (Net Operating Income) while maintaining disciplined underwriting.
  • Operational leverage through recurring rent economics: When leasing demand remains stable, contractual escalations and pass-through expense structures can help convert occupancy improvements into cash flow.

⚠ Risk Factors to Monitor

  • Interest rate and refinancing risk: REIT performance is sensitive to borrowing costs and credit conditions, especially where leverage and development activity intersect.
  • Leasing/tenant concentration and lease rollover risk: Competitive leasing markets can pressure renewal spreads; concentrated exposure to particular tenant business lines can magnify cyclical effects.
  • Capital intensity and development execution risk: Higher site/build costs, permit delays, or slower lease-up can reduce development yield.
  • Regional economic and demand concentration risk: Concentration in specific metros exposes the portfolio to local economic cycles and employment trends.
  • Regulatory and environmental constraints: Zoning, permitting, and environmental remediation requirements can affect timelines and development economics.
  • Catastrophic weather risk (where applicable): For Sunbelt industrial assets, storm exposure can increase insurance and capex needs.

📊 Valuation & Market View

The market typically values industrial REITs using cash-flow and asset-yield frameworks, rather than earnings-based metrics alone. Key indicators commonly include:

  • AFFO/FFO multiples: Reflects quality of recurring cash generation after recurring capital needs.
  • Cap rate / implied property yield: Driven by interest rates and investors’ required return for industrial real estate risk.
  • NOI growth and same-store performance: The durability of rent growth, occupancy, and re-leasing spreads are central.
  • Balance sheet leverage and cost of debt: Determines downside resilience through cycles.

Valuation typically moves with (1) industrial demand fundamentals, (2) the trajectory of leasing spreads, and (3) the availability and pricing of capital.

🔍 Investment Takeaway

EGP offers a focused industrial REIT thesis grounded in location-driven demand, tenant switching friction, and an execution platform that can translate infill market selection and disciplined development into durable cash flows. The long-term investment case is strongest when industrial occupancy remains stable, rent re-leasing spreads support NOI growth, and leverage/capital deployment remain aligned with credit conditions.


⚠ AI-generated — informational only. Validate using filings before investing.
📰 Market News & Coverage

15 Stories Available

Real-time institutional reporting and market updates for EGP.

zacks.com2026-07-27

PINE vs. EGP: Which Stock Is the Better Value Option?

Investors interested in stocks from the REIT and Equity Trust - Other sector have probably already heard of Alpine Income (PINE) and EastGroup Properties (EGP). But which of these two stocks offers value investors a better bang for their buck right now?

seekingalpha.com2026-07-24

The Only 2 REITs I Would Buy Now For Retirement Income

In theory, REITs should deliver abnormal returns when inflation runs hot. In practice, REITs have barely registered positive returns. While I am not overly bullish on REITs (to say the least), I still see some exceptions that might be worth scooping up.

seekingalpha.com2026-07-23

EastGroup Properties, Inc. (EGP) Q2 2026 Earnings Call Transcript

EastGroup Properties, Inc. (EGP) Q2 2026 Earnings Call Transcript

marketbeat.com2026-07-23

EastGroup Properties Q2 Earnings Call Highlights

EastGroup Properties NYSE: EGP reported a stronger-than-expected second quarter, with executives pointing to record leasing activity, resilient occupancy and rising development demand across its industrial portfolio.

zacks.com2026-07-22

EastGroup Properties (EGP) Q2 FFO and Revenues Lag Estimates

EastGroup Properties (EGP) came out with quarterly funds from operations (FFO) of $2.36 per share, missing the Zacks Consensus Estimate of $2.37 per share. This compares to FFO of $2.21 per share a year ago.

prnewswire.com2026-07-22

EastGroup Properties Announces Second Quarter 2026 Results

Quarter Highlights Net Income Attributable to Common Stockholders of $1.40 Per Diluted Share for Second Quarter 2026 Compared to $1.20 Per Diluted Share for Second Quarter 2025 (Gains on Sales of Real Estate Investments were $5 Million, or $0.10 Per Diluted Share, in Second Quarter 2026; There Were No Sales in Second Quarter 2025) Funds from Operations ("FFO"), Excluding Gain on Involuntary Conversion and Business Interruption Claims, of $2.36 Per Diluted Share for Second Quarter 2026 Compared to $2.21 Per Diluted Share for Second Quarter 2025, an Increase of 6.8% Same Property Net Operating Income for the Same Property Pool, Excluding Income From Lease Terminations, Increased 6.2% on a Straight-Line Basis and 8.3% on a Cash Basis for Second Quarter 2026 Compared to the Same Period in 2025 Operating Portfolio was 96.8% Leased and 95.6% Occupied as of June 30, 2026; Average Month-End Occupancy of Operating Portfolio was 95.6% for Second Quarter 2026 as Compared to 95.9% for Second Quarter 2025 Rental Rates on New and Renewal Leases Increased an Average of 34.1% on a Straight-Line Basis Raised Approximately $160 Million Pursuant to the Company's Continuous Common Equity Offering Program at a Weighted Average Price of $203.15 Transferred Four Development Projects Containing 669,000 Square Feet which are 100% Leased to the Operating Portfolio Started Construction of Two Development Projects Located in Charlotte and Houston Totaling 347,000 Square Feet with Projected Total Costs of Approximately $39 Million Signed 16 Leases on Active Development and First Generation Development Properties From April 1, 2026 through July 21, 2026, Totaling Approximately 1,101,000 Square Feet Subsequent to Quarter-End, Acquired an Operating Property in Phoenix Containing 143,000 Square Feet for Approximately $28 Million and Under Contract to Acquire an Operating Property in Austin Containing Five Multi-Tenant Buildings Totaling 388,000 Square Feet for Approximately $83 Million JACKSON, Miss., July 22, 2026 /PRNewswire/ -- EastGroup Properties, Inc. (NYSE: EGP) (the "Company", "we", "us" or "EastGroup") announced today the results of its operations for the three and six months ended June 30, 2026.

seekingalpha.com2026-07-19

How I Made A Fortune, Lost Most Of It, And Built It Back

Real estate investing success hinges on wide-moat assets, conservative balance sheets, and experienced management, as demonstrated by EGP, EQIX, AMH, and HHH. EastGroup delivered a 40%+ return since the prior recommendation; now fully valued at 30.7x, I would hold rather than add. Equinix benefits from scarcity-driven pricing power and AI demand, with a strong balance sheet and a 10-year dividend growth streak.

zacks.com2026-07-08

CUZ vs. EGP: Which Stock Is the Better Value Option?

Investors interested in stocks from the REIT and Equity Trust - Other sector have probably already heard of Cousins Properties (CUZ) and EastGroup Properties (EGP). But which of these two stocks is more attractive to value investors?

zacks.com2026-06-22

CUZ vs. EGP: Which Stock Should Value Investors Buy Now?

Investors interested in REIT and Equity Trust - Other stocks are likely familiar with Cousins Properties (CUZ) and EastGroup Properties (EGP). But which of these two stocks presents investors with the better value opportunity right now?

prnewswire.com2026-06-11

EastGroup Properties Announces Second Quarter 2026 Earnings Conference Call and Webcast

JACKSON, Miss., June 11, 2026 /PRNewswire/ -- EastGroup Properties, Inc. (NYSE: EGP) (the "Company" or "EastGroup") announced today that it will hold its Second Quarter 2026 Earnings Conference Call and Webcast on Thursday, July 23, 2026, at 10:00 a.m.

seekingalpha.com2026-06-11

Realty Income Vs. EastGroup: A Case Study In Overcoming Cost Of Capital

EastGroup Properties and Realty Income faced similar cost of capital challenges post-2022 but adopted sharply contrasting strategies. O maintained aggressive acquisition targets, pivoting to private funds and new asset classes to sustain volume despite diminished spreads and flat FFO/share growth. EGP exercised discipline, pausing acquisitions when spreads disappeared, focusing on development and organic growth to drive superior FFO/share performance.

zacks.com2026-06-05

HPP vs. EGP: Which Stock Should Value Investors Buy Now?

Investors looking for stocks in the REIT and Equity Trust - Other sector might want to consider either Hudson Pacific Properties (HPP) or EastGroup Properties (EGP). But which of these two stocks offers value investors a better bang for their buck right now?

seekingalpha.com2026-06-03

EastGroup Properties, Inc. (EGP) Presents at Nareit REITweek: 2026 Investor Conference Transcript

EastGroup Properties, Inc. (EGP) Presents at Nareit REITweek: 2026 Investor Conference Transcript

gurufocus.com2026-06-01

A Look at EastGroup Properties Inc (EGP) After 3.5% Decline -- GF Value $192.14 vs Price $194.83

On June 01, 2026, EastGroup Properties Inc (EGP) shares fell 3.5% to $194.83, continuing a downward trend observed over the past week and month. The stock has f

prnewswire.com2026-05-28

EastGroup Properties Announces Recent Business Activity and Presentation at Nareit's REITweek

JACKSON, Miss., May 28, 2026 /PRNewswire/ -- EastGroup Properties, Inc. (NYSE: EGP) (the "Company", "we", "our", "us" or "EastGroup") announced today its recent business activity.

📊 AI Financial Analysis

Powered by StockMarketInfo
Earnings Data: Q Ending 2026-06-30

"Revenue and EPS were sharply lower in 2026-06-30: revenue fell to $39.0M and net income to $1.4K (EPS $0), compared with $190.3M revenue and $94.6M net income in 2026-03-31. On a year-over-year basis, revenue declined from $177.3M in 2025-06-30 to $39.0M (about -78.0%), and net income is not comparable on an economic basis because the quarter reported only $1.4K despite $63.3M in 2025-06-30. Profitability metrics are distorted by the reported quarter mix: the operating income margin jumps to an extremely high level (driven by very large/incorrectly classified line items), and net margin is near zero at 2026-06-30. Over the prior four quarters (2025-06-30 through 2026-03-31), revenue and net income were consistently positive and grew QoQ/seasonally (e.g., Q1 2026 net income of $94.6M vs Q4 2025 $67.8M). Cash flow remains a key positive. Operating cash flow was strong at $159.6M and free cash flow at $175.2M in 2026-06-30, even after large dividends paid ($83.2M). Balance sheet resilience is mixed: total assets were $5.52B, but leverage appears elevated versus prior quarters given a much higher interest burden in this dataset and cash still concentrated. Total shareholder return is supportive: the stock is up 27.08% over 1 year, and dividends show a modest yield (~0.77%)."

Revenue Growth

Neutral

QoQ revenue collapsed from $190.3M (2026-03-31) to $39.0M (2026-06-30), and YoY revenue fell from $177.3M (2025-06-30) to $39.0M (~-78.0%), indicating a major deterioration/possible reporting distortion in the latest quarter.

Profitability

Neutral

Net income fell from $94.6M (2026-03-31) to $1.4K (2026-06-30), and YoY net income is also dramatically lower versus $63.3M (2025-06-30). Margins in 2026-06-30 are not reliable due to extreme/likely classification effects in operating line items.

Cash Flow Quality

Positive

Despite weak reported earnings, operating cash flow was $159.6M and free cash flow $175.2M in 2026-06-30. Dividends paid were substantial (-$83.2M) but covered by free cash flow (dividend paid & capex coverage ratio >1).

Leverage & Balance Sheet

Fair

Total assets were stable at $5.52B vs $5.49B (2026-03-31). However, the latest quarter shows a very large interest expense line item and net debt moved toward net cash/low net debt (-$33.4M net debt), suggesting leverage risk may be changing materially quarter to quarter.

Shareholder Returns

Good

1-year price performance is strong (+27.08%), and dividend yield is modest (~0.77%). Net of buybacks (none reported in the dataset), capital appreciation is doing most of the work.

Analyst Sentiment & Valuation

Caution

Consensus target ($225.3) is above the current price ($200.86), implying upside, but the major earnings volatility in the latest quarter reduces confidence in forward earnings quality.

Disclaimer:This analysis is AI-generated for informational purposes only. Accuracy is not guaranteed and this does not constitute financial advice.

Fundamentals Overview

Loading fundamentals overview...

EGP delivered a strong Q2 and upgraded full-year 2026 outlook. FFO was $2.36/share, $0.02 above the guidance midpoint, supported by higher-than-forecast occupancy and same-property NOI. Operating performance showed robust portfolio quality: quarter-end occupancy 95.6%, same-store occupancy 96.9%, cash same-store NOI up 8.3% in the quarter, and declining tenant concentration (top 10 at 6.6% of rents, -30 bps). Management also highlighted record leasing volume (3.9 million sq ft total; almost 1.1 million sq ft development/first-gen) and increased 2026 development starts to $325 million, with ongoing execution across infill land holdings and development pipeline readiness. A key new driver is data-center adjacency in leasing (20% of Q2 development leasing; ~40% in Q1), alongside Texas diversification. The main risk theme is consumer-driven demand softness translating into tenant credit deterioration, not near-term supply, since supply remains “in check.” Spec development NOI timing likely benefits later-year cash flows.

AI IconGrowth Catalysts

  • Development and first-generation leasing record: 3.9 million sq ft signed total in Q2; almost 1.1 million sq ft for development/first-gen leasing
  • Infill portfolio and prospect activity improving as decision cycles normalize after last year’s longer approval timelines
  • Data center adjacent demand becoming a measurable new SIC-code driver: 20% of Q2 development leasing and ~40% of Q1 development leasing

Business Development

  • Transferred 4 development projects to operating portfolio (Houston, Austin, Los Angeles): 669,000 sq ft, 100% leased
  • Acquired 143,000 sq ft building in Phoenix (Southeast submarket) after quarter end
  • Under contract to acquire 5 buildings in Austin (Northeast submarket) totaling 388,000 sq ft

AI IconFinancial Highlights

  • FFO: $2.36 per share, up $0.02 above guidance midpoint; up 6.8% quarter-over-quarter; year-to-date FFO per share up 7.6%
  • Occupancy: quarter-end 95.6% and quarter-end same-store occupancy 96.9%; average quarterly occupancy down 30 bps vs Q2 2025
  • Re-leasing spreads: 34% GAAP and 19% cash on leases signed in the quarter; year-to-date 35% GAAP and 19% cash
  • Cash same-store NOI: +8.3% for the quarter and +8.8% year-to-date
  • Tenant concentration: top 10 tenants at 6.6% of rents, down 30 bps vs last year
  • Guidance uplift: increased 2026 FFO guidance midpoint by $0.03 to $9.59 per share
  • 2026 same-property cash operating assumption raised by 60 bps to 6.8% and same-property occupancy expected at 96.7% (30 bps ahead of prior guidance)
  • 3Q FFO estimated $2.37 to $2.45 (midpoint $2.41)

AI IconCapital Funding

  • Balance sheet flexibility: ended quarter with no balance drawn on own secured bank credit facility; $675 million available capacity
  • Leverage/coverage: debt to total market capitalization 12.9%; annualized debt-to-EBITDA shown as [3x]; interest and fixed charge coverage 15.1x
  • Equity program: assumed $70 million common stock through common equity offering program in Q1; additional $210 million in forward equity sale agreements available for issuance at over $201 per share
  • Development/acquisition pipeline guidance: increased 2026 development starts to $325 million; acquisition guidance increased to $215 million; gross capital proceeds guidance remains $300 million

AI IconStrategy & Ops

  • Development starts and leasing momentum: year-to-date started $123 million; assumed another $202 million of starts in the second half
  • Explanation for guidance/FoF profile: spec development leasing contribution constrained by tenant delivery and permitting/occupancy timing; NOI impact expected more in 2027
  • Supply/portfolio execution: continued record leasing (3.9 million sq ft) and “on-the-go” development platform with permits and pricing set to pull trigger quickly once leasing thresholds are met
  • Bay Area operating nuance: continued market slowness relative to other regions, with LA big-box showing strength

AI IconMarket Outlook

  • 2026 development starts guidance increased to $325 million (from prior midpoint by $60 million)
  • 2026 acquisition guidance increased to $215 million (from prior midpoint by $55 million); late Q4 acquisition assumed $65 million
  • 2026 FFO guidance midpoint increased by $0.03 to $9.59 per share
  • Q3 2026 FFO range: $2.37 to $2.45; midpoint $2.41
  • 2026 assumed same-property occupancy: 96.7% (30 bps ahead of prior guidance) and average month-end portfolio occupancy 95.7% (20 bps ahead of prior guidance)
  • Spec development leasing guidance mechanics (for NOI timing): remaining $0.01 of speculative development leasing contribution left in 2026 guidance after removing $0.01 from $0.04

AI IconRisks & Headwinds

  • Consumer weakness risk framed as the main derailment: higher interest rates and potentially higher gas prices could weaken demand and eventually tenant credit
  • Tenant credit risk explicitly called out as an “Achilles heel” if demand slows
  • Potential cyclicality in cash re-leasing spreads: management expects cash spreads to normalize as the post-COVID rent reset “air coming out of a balloon” cycle matures (currently “in the 20s, high teens”)
  • Execution/timing risk on spec development: longer permitting and construction lead times (steel/electrical equipment, switchgear/transformers) can add “a couple of months” and shift NOI into later years
  • Regional demand lag risk: Bay Area relative to other markets continues to show slowness

Q&A: Analyst Interest

  • Data center demand quantification: Management quantified data-center adjacency as ~40% of Q1 development leasing and 20% of Q2 development leasing. They described it as a new demand driver (new SIC code) and indicated major markets may be early innings, with pipeline capacity multiples 3–4x versus current planned capacity.
  • Spec development leasing timing vs guidance: Management explained the spec leasing contribution evolution—$0.07 at initiation, reduced to $0.04 in Q1, then signed leases “shore up” $0.02, removed another $0.01, leaving $0.01 remaining. They emphasized delivery/occupancy timelines shift NOI into 2027.
  • Acquisition market risk/reward and pricing: Management described cap-rate dynamics with many bidders for good industrial and cap rates in the 5% to upper-4s range. They flagged that private buyers appear to underwrite large rental-rate growth assumptions due to tight spreads between 10-year yields and cap rates.

Sentiment: MIXED

Note: This summary was synthesized by AI from the EGP Q2 2026 earnings transcript. Financial data is complex; please verify all metrics against official SEC filings before making investment decisions.

📋 Official Regulatory 10-K / 10-Q SEC Filings

Direct authenticated documentation links to audited SEC database reports for EGP.

SEC EDGAR Live Feed
Loading financial data and tables...
📁

SEC Filings (EGP)

© 2026 Stock Market Info — EastGroup Properties, Inc. (EGP) Financial Profile