Century Communities, Inc.

Century Communities, Inc. (CCS) Market Cap

Century Communities, Inc. has a market capitalization of $1.91B.

Price: $67.16

-1.41 (-2.06%)

Market Cap: 1.91B

NYSE · time unavailable

CEO: Robert J. Francescon

Sector: Consumer Cyclical

Industry: Residential Construction

IPO Date: 2014-06-18

Website: https://www.centurycommunities.com

Century Communities, Inc. (CCS) - Company Information

Market Cap: 1.91B|Sector: Consumer Cyclical

Company Profile

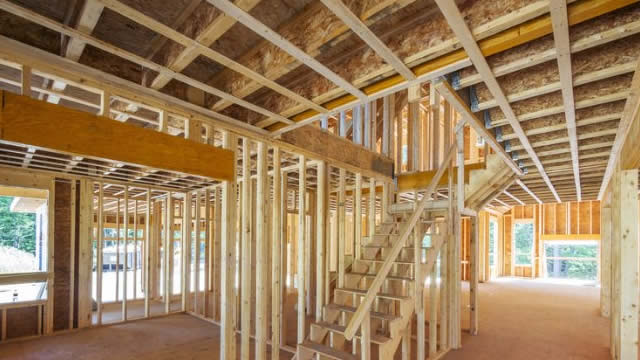
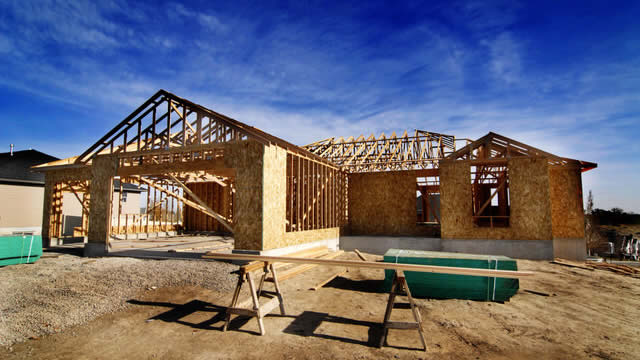
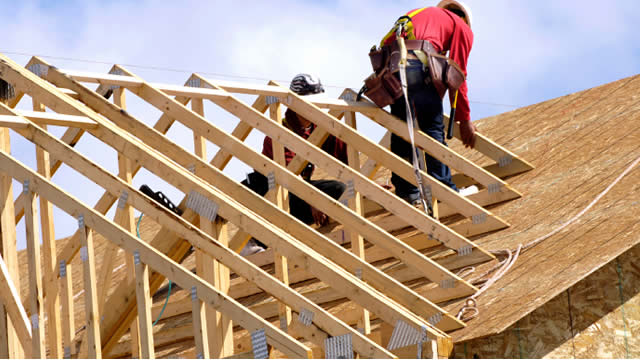
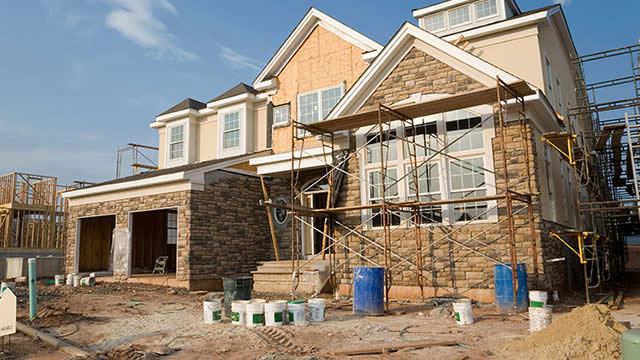
Century Communities, Inc. is a residential housing company that designs, builds, markets, and sells single-family homes, encompassing both attached and detached structures. Beyond construction, the firm also handles land preparation and entitlement, alongside offering key services such as mortgage, title, and insurance to individuals purchasing its homes. The company markets its properties under two main brands: Century Communities and Century Complete. Sales are conducted through a diverse network that includes its own sales teams, dedicated retail studios, online platforms, and independent real estate brokers, reaching customers in 17 states across the United States. Established in 2002, Century Communities, Inc. is based in Greenwood Village, Colorado.

Analyst Sentiment

60%
Buy

From 2 Active Polls

1Y Forecast: $60.67

▼ -9.7% Potential Upside

Consensus Target Metrics

Low Bound

$48

Median

$52

High Bound

$82

Average

$61

Price & Moving Averages

Loading chart...

🎯 Wall Street Analyst Intelligence Report

1-Year structural target targets, chart projections, and sentiment maps.

Average 1Y Target
$60.67
▼ -9.66% Upside
Low Target
$48.00
-29% Risk
Median Target
$52.00
-23% Mid
High Target
$82.00
22% Max
Consensus
Buy
7 / 12 Buys

Consensus Trend Projection

Trailing closures vs. 12-month metrics map.

Analyst Vote Distribution

Aggregate institutional coverage sentiment weights.

📊 Historical Valuation Multiples

Real-time Trailing Twelve Month (TTM) momentum side-by-side with discrete quarterly metrics.

Fiscal QuarterTTMQ2 2026Q1 2026Q4 2025Q3 2025Q2 2025Q1 2025Q4 2024Q3 2024
Period EndingTrailing 12MJun 30, 2026Mar 31, 2026Dec 31, 2025Sep 30, 2025Jun 30, 2025Mar 31, 2025Dec 31, 2024Sep 30, 2024
Market Cap ($M)1,9102,0721,6751,7321,8791,7102,0672,3123,227
Enterprise Value ($M)3,5123,6753,1353,0173,4123,0223,3203,6384,611
Price to Earnings Ratio (P/E)14.6614.3317.0812.0612.5712.2413.115.619.72
Price/Earnings-to-Growth Ratio (PEG)0.820.501.130.471.04
Price to Sales Ratio (P/S)0.492.232.121.421.921.712.291.822.84
Price to Book Ratio (P/B)0.760.810.660.670.730.670.800.881.27
Price to Free Cash Flow Ratio (P/FCF)38.69-39.35-17.818.39-180.35-231.42-51.728.82-42.49
Enterprise Value to Sales (EV/Sales)3.963.972.483.483.023.682.864.06
Enterprise Value to EBITDA (EV/EBITDA)21.55209.7081.0657.0163.3653.7956.3225.6139.69
Debt to Equity Ratio9.830.660.600.560.650.550.520.560.60

📘 Full Research Report

ℹ️

AI-Generated Research: This report is for informational purposes only.

```html

📘 CENTURY COMMUNITIES INC (CCS) — Investment Overview

🧩 Business Model Overview

Century Communities builds and sells homes, converting land and development/construction capabilities into home closings and related revenues. The value chain typically runs from (1) land sourcing and control, to (2) entitlement/permitting and infrastructure planning, to (3) home construction through subcontractor execution and supply-chain coordination, and finally (4) sales and closing to homebuyers.

Profitability is driven by the efficiency of this operating pipeline—how quickly land can be converted into permitted lots, how effectively construction schedules are managed, and how well community-level pricing holds versus material, labor, and financing costs.

💰 Revenue Streams & Monetisation Model

The core monetisation is transactional revenue from home sales, recognized at closings (or over construction periods under applicable accounting guidance). While the business has no “subscription-like” revenue, it can generate recurring elements through customer-related add-ons (e.g., options and upgrades) and community-level economics such as warranty-related costs and change-order handling that influence net margin outcomes.

Primary margin drivers include:

  • Gross margin per home, influenced by pricing, sales incentives, and construction/material costs.
  • Cycle discipline and inventory management, as unsold homes and land carry costs pressure returns during slower markets.
  • Operational leverage, where fixed overhead (land development, homebuilding leadership, administrative costs) spreads across higher closing volumes.

Because homes are largely one-time transactions, the “quality of earnings” hinges on land strategy, pricing power versus input costs, and the mix of communities transitioning into closings.

🧠 Competitive Advantages & Market Positioning

Century Communities’ moat is less about brand and more about operating execution and land-to-closings conversion. In homebuilding, the principal economic advantages tend to be:

  • Low-cost land and development discipline (de facto switching cost for the company, not the buyer): Developers that can acquire and control well-located land with manageable entitlement risk can produce better risk-adjusted returns.
  • Process and labor efficiency: Competitive builders establish repeatable construction processes, trade relationships, and scheduling habits that reduce delays and cost overruns.
  • Community portfolio focus: Concentration in selected geographies supports tighter land management, construction oversight, and sales operations—improving throughput and reducing “execution variance.”

Competitive benchmarking: Key public peers include:

  • D.R. Horton — broader footprint and higher scale across the U.S.
  • Lennar — multi-brand product strategy and vertically integrated elements (notably financing/operating scale).
  • PulteGroup — strong position across major metros with a broader product mix.

Century Communities’ industry focus is typically narrower and more concentrated than these large diversified peers, emphasizing targeted markets and product positioning that align with local demand and pricing dynamics. The competitive contrast is that larger peers can leverage broader scale, while Century Communities seeks advantage through selective market presence and tighter execution to maintain returns across housing cycles.

🚀 Multi-Year Growth Drivers

Over a 5–10 year horizon, the growth opportunity is supported less by “market share capture” and more by durable demand and continued housing undersupply in many regions. The principal drivers are:

  • Demographic and household formation trends creating baseline demand for workforce and move-up housing.
  • Urban/suburban migration and regional population shifts that sustain land development activity in specific growth corridors.
  • Housing stock replacement and remodeling needs that indirectly support new home demand through mobility cycles.
  • Community density and lot economics: land strategies that improve lot utilization and reduce per-lot infrastructure cost can expand profitability even when volumes are flat.

TAM expansion in homebuilding is cyclical, but the long-run addressable “new build” opportunity persists due to underbuilding in many markets, constrained feasible supply, and continuing migration.

⚠ Risk Factors to Monitor

  • Interest-rate and affordability sensitivity: Homebuyer qualification, mortgage costs, and overall affordability can swing volumes and pricing.
  • Input cost volatility: Lumber/materials, labor availability, and subcontractor pricing can compress gross margin.
  • Permitting and land entitlement risk: Delays or cost increases in approvals, infrastructure requirements, and environmental constraints can disrupt schedules.
  • Inventory and land-cycle discipline: Mis-timed land acquisitions or slower absorption of homes can elevate carrying costs and impair returns.
  • Regional concentration risk: Market-specific downturns can have outsized impact if community exposure is concentrated.

📊 Valuation & Market View

Homebuilders are typically valued using EV/EBITDA and price-to-earnings frameworks, but investor focus often extends to balance-sheet quality (notably land inventory strategy) because profitability is inherently cyclical. Drivers that tend to move valuation include:

  • Return on invested capital through the cycle, especially the economics of land-to-closings conversion.
  • Gross margin sustainability relative to input costs and sales incentive levels.
  • Inventory health—mix, pace of starts/closings, and ability to manage unsold homes without margin destruction.
  • Capital allocation discipline and the risk-adjusted yield of land positions.

Given cyclicality, the market often assigns a “quality premium” to builders demonstrating disciplined land sourcing, stable cost execution, and conservative balance-sheet management.

🔍 Investment Takeaway

Century Communities’ long-term investment case rests on its ability to convert controlled land into timely, cost-efficient home closings through disciplined project execution and targeted market focus. The economic durability comes from operational execution and land development advantages that improve risk-adjusted returns, even as housing demand and affordability fluctuate. The key question for ongoing underwriting is whether the company maintains margin resilience and inventory discipline through housing-cycle turns while sustaining returns on capital invested in land and development.


⚠ AI-generated — informational only. Validate using filings before investing.

```

📰 Market News & Coverage

15 Stories Available

Real-time institutional reporting and market updates for CCS.

gurufocus.com2026-07-29

Woodside Energy Second Quarter Report for Period Ended 30 June 2026

Woodside Energy Group (ASX: WDS) (NYSE: WDS):2026 full-year guidancePriorCurrentTotal production volumes3MMboe172-186174-185Gas hub exposure4%~30No changeCapita

zacks.com2026-07-28

Is Century Communities (CCS) Stock Outpacing Its Construction Peers This Year?

Here is how Century Communities (CCS) and Innodata Inc (INOD) have performed compared to their sector so far this year.

zacks.com2026-07-28

Best Income Stocks to Buy for July 28th

NXRT, M and CCS made it to the Zacks Rank #1 (Strong Buy) income stocks list on July 28, 2026.

zacks.com2026-07-28

New Strong Buy Stocks for July 28th

DOO, NXRT, ARW, NTNX and CCS have been added to the Zacks Rank #1 (Strong Buy) List on July 28, 2026.

seekingalpha.com2026-07-22

Century Communities, Inc. (CCS) Q2 2026 Earnings Call Transcript

Century Communities, Inc. (CCS) Q2 2026 Earnings Call Transcript

zacks.com2026-07-22

Century Communities (CCS) Beats Q2 Earnings and Revenue Estimates

Century Communities (CCS) came out with quarterly earnings of $1.3 per share, beating the Zacks Consensus Estimate of $0.63 per share. This compares to earnings of $1.37 per share a year ago.

marketbeat.com2026-07-22

Century Communities Q2 Earnings Call Highlights

Century Communities NYSE: CCS reported stronger second-quarter 2026 results, with management citing improved order activity, higher deliveries, lower incentives and tighter cost controls despite what executives described as macroeconomic headwinds and weak consumer sentiment.

prnewswire.com2026-07-22

Century Communities Reports Second Quarter 2026 Results

- Deliveries of 2,506 Homes Generating $927.2 Million in Total Revenues - - Net New Home Contracts of 2,615 - - Ending Community Count Increased Sequentially to 330, a Company Record - - Net Income of $36.1 Million, or $1.26 Per Diluted Share - - Book Value Per Share of $90.24, a Company Record - GREENWOOD VILLAGE, Colo., July 22, 2026 /PRNewswire/ -- Century Communities, Inc. (NYSE: CCS), one of the nation's largest homebuilders, today announced financial results for its second quarter ended June 30, 2026.

prnewswire.com2026-07-15

Century Complete Expands Triad Presence with New Construction Homes

Online homebuying pioneer now selling new, two-story homes from the mid $200s near Greensboro Loop GREENSBORO, N.C., July 15, 2026 /PRNewswire/ -- Century Communities, Inc. (NYSE: CCS)—a top national homebuilder, industry leader in online home sales, and featured on America's Most Trustworthy Companies by Newsweek—announced that its Century Complete brand is now selling at The Glens at Brightwood Landing, a new home community offering thoughtfully designed floor plans in a convenient location near Greensboro Urban Loop.

seekingalpha.com2026-07-14

Heartland Value Plus Fund Q2 2026 Portfolio Review

Many of our top performers in Technology were long-standing holdings that have recently added Data Centers as a new end market. An example is Littelfuse, an electronics component supplier specializing in power management fuses for electrical products. If the economy were to hit a speedbump, we would expect FirstCash to hold up well due to its business model.

gurufocus.com2026-07-13

Century Complete brings new homes on large homesites to popular Triangle, NC area

Century Complete brings new homes on large homesites to popular Triangle, NC area PR Newswire SANFORD, N.C., Jul

prnewswire.com2026-07-13

Century Complete brings new homes on large homesites to popular Triangle, NC area

Top national homebuilder offering modern 3- and 4-bedrooms homes from the high $200s in Sanford, NC SANFORD, N.C., July 13, 2026 /PRNewswire/ -- Century Communities, Inc. (NYSE: CCS)—a top national homebuilder, industry leader in online home sales, and featured on America's Most Trustworthy Companies by Newsweek—announced that West Pointe, a new community by the Company's Century Complete brand, is bringing new 3- and 4-bedroom floor plans on large homesites to the sought-after Triangle area.

seekingalpha.com2026-07-11

Century Communities: The House Of Short-Term Pain For Long-Term Gain

Century Communities faces revenue and profitability declines due to housing affordability and economic weakness, yet the stock has outperformed the S&P 500. CCS is not cheap relative to peers, but the current valuation is not excessive given the potential for a long-term housing shortage-driven recovery. Management has revised home delivery guidance lower, and backlog, new orders, and average prices have all declined, reflecting ongoing market headwinds.

seekingalpha.com2026-07-10

Buy And Wait On Century Communities

Century Communities remains a buy at deep value, supported by a strong balance sheet and despite sector-wide secular headwinds. CCS faces margin and demand headwinds, with gross margins at historic lows and Q1 deliveries down 12% year-over-year. Despite revenue and delivery declines, CCS maintains robust capital management via buybacks and a 2% dividend, with debt-to-capital stable at 32.2%.

gurufocus.com2026-07-09

JetBlue Launches Largest-Ever Fort Lauderdale Schedule, Reinforcing Long-Term Commitment to South Florida

JetBlue (NASDAQ: JBLU) today continued its significant expansion at Fort Lauderdale-Hollywood International Airport (FLL), with the launch of eight nonstop des

📊 AI Financial Analysis

Powered by StockMarketInfo
Earnings Data: Q Ending 2026-06-30

"CCS reported Q2 2026 revenue of $927.2M and net income of $36.1M (EPS $1.25). YoY, revenue declined (Q2 2026 vs Q2 2025: $927.2M vs $1,000.7M) by -7.4%, while net income increased slightly by +3.7% ($36.1M vs $34.9M). QoQ, revenue rose +17.4% (from $789.7M in Q1 2026), and net income rose +48.1% (from $24.4M). Profitability improved on a QoQ basis: net margin expanded to 3.9% in Q2 2026 from 3.1% in Q1 2026 (though it remained below the stronger Q3/Q4 2025 levels). Operating income increased to $23.2M (2.5% margin) from $33.0M (4.2% margin) QoQ, suggesting that non-operating items materially supported pre-tax and net results in Q2. Cash flow quality weakened: operating cash flow was -$45.2M and free cash flow was -$52.7M due primarily to working-capital drag (change in working capital -$92.0M). On the balance sheet, leverage remained meaningful with net debt of ~$1.03B, but equity was stable at ~$2.57B. Shareholder returns are mixed: price is $62.3 with only +7.5% 1-year change and a modest dividend yield (~0.44%); buybacks occurred (common stock repurchased -$21.6M). Total shareholder return momentum is not strong versus the market."

Revenue Growth

Fair

QoQ revenue improved to $927.2M (+17.4%), but YoY revenue fell to $1,000.7M → $927.2M (-7.4%), indicating a still-soft top line.

Profitability

Neutral

Net income grew YoY (+3.7%) and QoQ (+48.1%); net margin expanded QoQ to 3.9% from 3.1%. However, operating margins were lower than Q1 and remain below peak quarters in 2025.

Cash Flow Quality

Neutral

Operating cash flow was -$45.2M and free cash flow -$52.7M in Q2 2026, driven by working-capital outflow (-$92.0M). This weakens earnings-to-cash conversion in the most recent quarter.

Leverage & Balance Sheet

Neutral

Net debt remains elevated at ~$1.03B, but total equity was stable (~$2.57B) and total assets increased QoQ (to ~$4.69B). Liquidity is strong on a current basis (current ratio ~24.8), though metrics show volatile working capital.

Shareholder Returns

Neutral

Dividend yield is modest (~0.44%). Price momentum is positive but below the >20% threshold (+7.5% 1Y). Buybacks were active in Q2 (-$21.6M), supporting shareholder returns despite softer YoY revenue.

Analyst Sentiment & Valuation

Neutral

Consensus price target is ~$60.67 versus $62.3 current (roughly flat). Valuation appears reasonable relative to earnings (P/E ~14.3), but no strong upside signal from targets.

Disclaimer:This analysis is AI-generated for informational purposes only. Accuracy is not guaranteed and this does not constitute financial advice.

Fundamentals Overview

Loading fundamentals overview...

Century Communities delivered stronger Q2 results with EPS of $1.26 (+11% YoY, +50% sequential) and adjusted gross margin of 20% (+30 bps sequential). The quarter’s momentum was driven by higher absorption and improved order quality: deliveries of 2,506 homes exceeded guidance while incentives fell sharply to an average 1,200 bps (-50 bps QoQ; -100 bps vs Q4). Operational execution supported margins (directs -5% sequential, cycle time 112 days record, finished lot costs flat). Management guided Q3 deliveries of 2,500–2,700 and raised FY2026 deliveries to 9,750–10,500 with revenue $3.5B–$3.8B. The principal risk is whether incentive levels remain sufficient to sustain sales pace without compressing margins, particularly as fuel/land development input requests rise and lumber tailwinds end. Their ARM strategy (now ~35% of mortgage principal volume) is the core mechanism to balance affordability and pricing discipline.

AI IconGrowth Catalysts

  • Deliveries of 2,506 homes vs guidance midpoint outperformance; absorption rate +6% QoQ versus historic average -7% decline
  • Net orders 2,615 (+3% YoY, +10% sequential) led by improved absorption rather than quarter-end community growth
  • Adjusted gross margin 20% (+30 bps sequential) driven by lower incentives and direct construction costs (directs -5% sequential; cycle times 112 days, record)

Business Development

  • ARM product introduction/expansion (increased adoption tied to incentive reduction)
  • Ongoing market investment leading to Texas open community count record (Houston dominant; San Antonio bright spot; Austin picking up; Dallas ramping via VDLs)

AI IconFinancial Highlights

  • EPS $1.26: +11% YoY and +50% sequential
  • Adjusted gross margin 20%: +30 bps sequential; GAAP gross margin 18.1%: +30 bps sequential
  • Incentives on delivered homes averaged 1,200 bps in Q2: -50 bps QoQ; -100 bps vs Q4 2025 levels
  • Expectation for Q3 incentives on closed homes: consistent with first-half 2026 levels
  • SG&A as % of home sales revenues: 14.2% in Q2; full-year guidance midpoint implies ~14% for FY2026 and 13.5% for Q3 (per midpoint assumptions)
  • Tax rate: 26.3% in Q2; FY2026 expected 26% to 27%
  • Gross margin bridge note: first quarter had ~90 bps benefit from warranty accrual/rebate collections excess; second quarter had no impact from those items
  • Net homebuilding debt-to-net capital 31.9%; homebuilding debt-to-capital 34.2% (stable vs prior year quarter)

AI IconCapital Funding

  • Share repurchases: 353,000 shares for $20M in Q2 (38% discount to book value per share $9.24 end of Q2)
  • Year-to-date repurchases through 6 months: 970,000 shares for $60M (~3% of beginning-of-year shares; 32% discount to Q2-end book value)
  • Liquidity: $802M at quarter end; stockholders’ equity $2.6B; quarterly dividend maintained at $0.32/share
  • Net effect: maintained capital return while funding land acquisition/development plan

AI IconStrategy & Ops

  • Incentive management tied to ARM product adoption; ARMs nearly 35% of originated mortgage principal volume in Q2 (from ~30% in Q1; <5% in Q1 2025)
  • Operational cost actions: direct construction costs -5% sequential; cycle times 112 days (record); finished lot costs flat sequential
  • Inventory discipline: ~3 finished specs per community at quarter end; ended with just over 60,000 owned/controlled lots (owned lots -2% QoQ; total lot count +3% QoQ)
  • Land spend flexibility: FY2026 land acquisition/development expense $1.0B to $1.2B with ability to accelerate or reduce based on market conditions

AI IconMarket Outlook

  • Raising guidance: FY2026 deliveries 9,750 to 10,500 homes (midpoint raised vs prior); home sales revenues $3.5B to $3.8B
  • Q3 2026 deliveries expected 2,500 to 2,700 homes
  • Community count: expect 2026 average community count to grow low to mid-single digits YoY
  • Land acquisition and development expense outlook reaffirmed: $1.0B to $1.2B for 2026

AI IconRisks & Headwinds

  • Macro challenges and weak consumer sentiment cited as ongoing headwinds
  • Incentives remain a headwind to margins; third-quarter margin driver expected to be incentives needed to generate acceptable sales pace
  • Potential future pressure from land development requests due to higher oil prices (diesel/asphalt) while management is attempting to mute increases
  • Lumber tailwinds described as ending; expected to be flat to up
  • July traffic impact from recent rate rises considered difficult to discern due to seasonality and early data

Q&A: Analyst Interest

  • Margin drivers & upside levers: Management said the key swing factor is incentives, supported by continued introduction of ARM product. They emphasized they held direct construction cost and finished lot costs, but warned macro-driven variability remains for direct costs; they felt current lot-cost trajectory is stable.
  • Vendor/fuel/commodity pass-through risk: Management confirmed direct construction costs fell 5% sequentially from an initiative rolling through Q2. For future risk, they described land development requests tied to higher oil prices and possible diesel/asphalt cost increases, while pushing back; lumber is flat-to-up with tailwinds largely ended.
  • ARM adoption & competitive/market dynamics: Management indicated ARMs can likely be pushed higher, citing year-over-year growth and moving from ~30% sequentially to 35% in Q2. They also said incentive discounting has moderated versus last year/early 2026; they monitor QMI inventory (~3 per community) and see no unusual supply imbalance.

Sentiment: POSITIVE

Note: This summary was synthesized by AI from the CCS Q2 2026 earnings transcript. Financial data is complex; please verify all metrics against official SEC filings before making investment decisions.

📋 Official Regulatory 10-K / 10-Q SEC Filings

Direct authenticated documentation links to audited SEC database reports for CCS.

SEC EDGAR Live Feed
Loading financial data and tables...
📁

SEC Filings (CCS)

© 2026 Stock Market Info — Century Communities, Inc. (CCS) Financial Profile