Interface, Inc.

Interface, Inc. (TILE) Market Cap

Interface, Inc. has a market capitalization of $1.99B.

Price: $34.26

0.46 (1.36%)

Market Cap: 1.99B

NASDAQ · time unavailable

CEO: Laurel Hurd

Sector: Consumer Cyclical

Industry: Furnishings, Fixtures & Appliances

IPO Date: 1983-04-14

Website: https://www.interface.com

Interface, Inc. (TILE) - Company Information

Market Cap: 1.99B|Sector: Consumer Cyclical

Company Profile

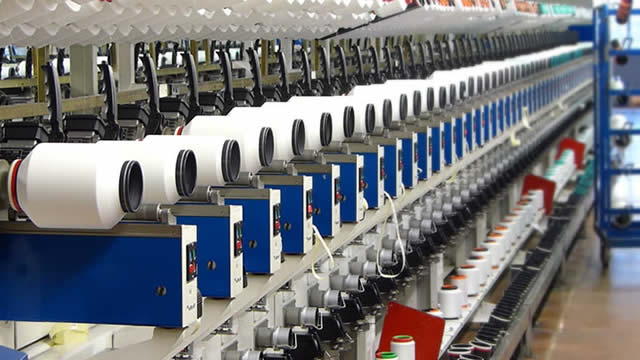
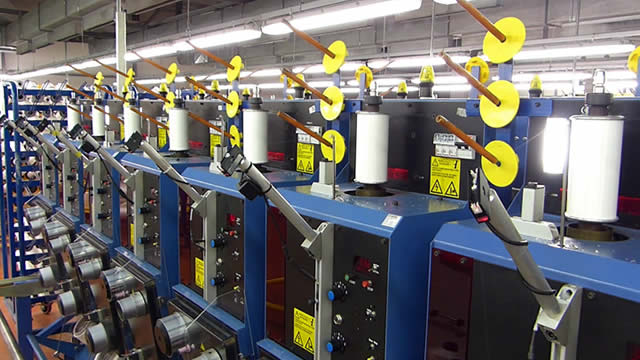
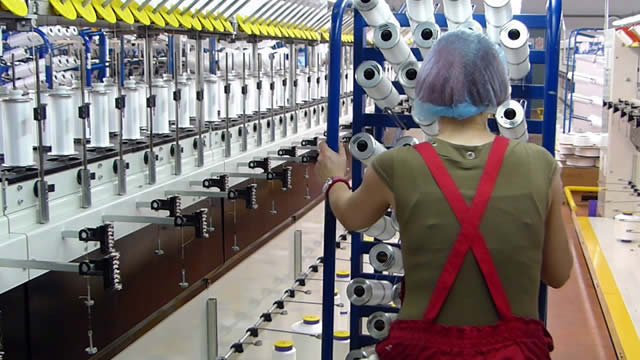
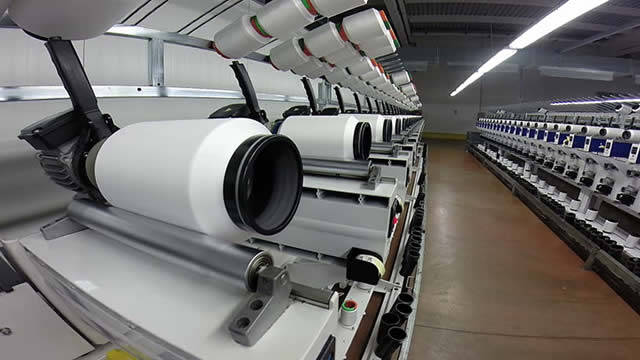
Interface, Inc. designs, produces, and sells modular carpet products in the United States, Canada, Latin America, Europe, Africa, Asia, and Australia. The company offers modular carpets; luxury vinyl tiles; modular resilient flooring products; rubber flooring; and carpet tiles used in commercial interiors, include offices, educational facilities, healthcare facilities, airports, hospitality spaces, retail spaces, and residential interiors. It also provides carpet replacement, installation, and maintenance services; and other products and services, including TacTiles carpet tile installation system and adhesives and products for carpet installation and maintenance, as well as project management services. The company sells its products under the Interface, FLOR, NORAPLAN, and NORAMENT brands through direct sales to end users and indirect sales through independent contractors, installers and distributors. Interface, Inc. was incorporated in 1973 and is headquartered in Atlanta, Georgia.

Analyst Sentiment

89%
Strong Buy

From 3 Active Polls

1Y Forecast: $36.00

▲ +5.1% Potential Upside

Consensus Target Metrics

Low Bound

$36

Median

$36

High Bound

$36

Average

$36

Price & Moving Averages

Loading chart...

🎯 Wall Street Analyst Intelligence Report

1-Year structural target targets, chart projections, and sentiment maps.

Average 1Y Target
$36.00
▲ +5.08% Upside
Low Target
$36.00
5% Risk
Median Target
$36.00
5% Mid
High Target
$36.00
5% Max
Consensus
Buy
8 / 12 Buys

Consensus Trend Projection

Trailing closures vs. 12-month metrics map.

Analyst Vote Distribution

Aggregate institutional coverage sentiment weights.

📊 Historical Valuation Multiples

Real-time Trailing Twelve Month (TTM) momentum side-by-side with discrete quarterly metrics.

Fiscal QuarterTTMQ2 2026Q4 2025Q3 2025Q2 2025Q1 2025Q4 2024Q3 2024Q2 2024
Period EndingTrailing 12MApr 5, 2026Dec 28, 2025Sep 28, 2025Jun 29, 2025Mar 30, 2025Dec 29, 2024Sep 29, 2024Jun 30, 2024
Market Cap ($M)1,9891,4531,6741,6791,2231,1591,4291,106849
Enterprise Value ($M)2,2021,6661,8671,8811,4991,4461,7211,4141,234
Price to Earnings Ratio (P/E)15.7915.5417.059.099.3422.5516.569.689.34
Price/Earnings-to-Growth Ratio (PEG)0.360.48
Price to Sales Ratio (P/S)1.404.394.794.613.263.904.273.212.45
Price to Book Ratio (P/B)3.152.291.392.702.132.262.922.211.88
Price to Free Cash Flow Ratio (P/FCF)16.49452.5958.5325.4153.70271.3858.6615.8670.97
Enterprise Value to Sales (EV/Sales)5.035.345.163.994.865.144.113.56
Enterprise Value to EBITDA (EV/EBITDA)10.6340.2243.1330.0425.0744.9439.3426.6825.54
Debt to Equity Ratio1.030.430.220.630.690.750.800.841.06

📘 Full Research Report

ℹ️

AI-Generated Research: This report is for informational purposes only.

📘 INTERFACE INC (TILE) — Investment Overview

🧩 Business Model Overview

Interface, Inc. manufactures and sells commercial flooring solutions, with a strong emphasis on modular carpet systems (often sold as tile formats) used in offices, education, healthcare, and other contract settings. The value chain is primarily: (1) design and product development, (2) manufacturing of flooring materials, (3) distribution through contract channels and specification/installation ecosystems, and (4) ongoing project-based replacements and tenant-driven refresh cycles.

A key feature of the business model is customer “stickiness” created by specifications and installed systems. Modular formats allow phased replacement (patching tiles rather than full-floor removal), which reinforces repeat buying when customers remain within an approved product portfolio.

💰 Revenue Streams & Monetisation Model

Revenue is predominantly product sales tied to commercial flooring projects and replacement demand. Monetisation is driven by:

  • Project and replacement volumes: demand linked to commercial construction, refurbishments, and workspace reconfiguration.
  • Product mix and pricing: higher-margin assortments typically benefit from differentiation (design breadth, performance attributes, and sustainability credentials).
  • Contract channel leverage: repeat procurement through dealers, specifiers, and installation networks can improve forecastability versus purely spot market buying.

While the revenue base is largely non-recurring (project-based), the installed footprint can support repeat orders over time through replacement and phased updates—an element that tends to be steadier than “one-and-done” commodity flooring.

🧠 Competitive Advantages & Market Positioning

Interface competes in commercial floor covering, where brand and design matter, but procurement is heavily influenced by specification status, performance requirements, and lifecycle cost. The durable moat is best understood as a combination of switching costs, specification-driven customer lock-in, and manufacturing/process cost advantages.

  • Switching costs (specification and installed system): Once a product family is specified and installed, replacement and tenant refresh cycles often follow the approved system. Modular tile formats reduce disruption and disposal costs, encouraging continued use of the same ecosystem.
  • Intangible assets (design, technical performance, sustainability positioning): Commercial customers evaluate lifecycle attributes (cleanability, durability, lifecycle environmental claims, and indoor air considerations). These attributes can create buyer inertia in procurement decisions.
  • Operational and cost discipline: Flooring is a manufacturing business; cost competitiveness, yield, logistics efficiency, and procurement scale can materially influence margins through the cycle.

Competitive benchmarking:

  • Shaw (Shaw Industries) and Mohawk (Mohawk Industries): both are large-scale competitors with broad commercial carpet footprints. Their advantage is scale across manufacturing and distribution. Interface differentiates through modular system focus and specification penetration in selected commercial segments.
  • Tarkett: a significant player in flooring systems, including resilient and carpet categories. Tarkett competes on product breadth; Interface’s positioning leans more heavily into carpet tile systems and system-level specifications.
  • Forbo: known for resilient and specialty flooring; Interface competes via modular carpet systems and differentiated performance/sustainability product platforms.

Overall, Interface’s competitive strength is less about network effects and more about specification-driven switching costs plus manufacturing execution that supports competitiveness in pricing and mix through construction and renovation cycles.

🚀 Multi-Year Growth Drivers

Over a 5–10 year horizon, growth prospects for Interface are supported by structural demand for commercial flooring replacement and the shift toward lower environmental impact materials.

  • Commercial renovation and workspace reconfiguration: Tenant turnover and changes in workplace layouts drive flooring refresh cycles, where modular systems can be replaced in sections.
  • Lifecycle and sustainability procurement standards: Large occupiers increasingly require documented environmental attributes and lifecycle considerations, which can expand addressable demand for suppliers with credible product programs.
  • Specifier and dealer ecosystem deepening: Improving penetration with architects, designers, and contract dealers increases the share of projects where Interface products are included in initial specifications.
  • Operational improvement as a compounding lever: Margin improvement from yield, cost controls, and mix management can compound earnings power even when volume growth is moderate.

⚠ Risk Factors to Monitor

  • Cyclical end-market exposure: Commercial construction activity and discretionary renovation budgets can tighten during economic slowdowns, pressuring volume and pricing.
  • Raw materials and energy input volatility: Flooring manufacturing depends on inputs that can move with commodity and energy cycles; an inability to pass through costs can compress margins.
  • Competitive pricing and capacity actions: Large peers with manufacturing scale can increase promotional activity to defend share, pressuring industry economics.
  • Technology and product substitution: Shifts toward alternative flooring types or new installation methodologies could alter specification preferences.
  • Execution risk in operating improvements: Restructuring, footprint changes, or supply chain reconfiguration can deliver benefits but carry transition costs and integration risk.

📊 Valuation & Market View

Equity valuation for commercial industrial manufacturing and building-products names typically reflects: (1) expectation of through-cycle margins, (2) normalized demand tied to building and refurbishment cycles, and (3) confidence in operational execution. Markets often use EV/EBITDA as a primary reference for earnings power, with P/S gaining importance when investors expect structural margin improvement or mix shift.

Key valuation drivers generally include gross margin stability, operating leverage, inventory and working capital discipline, and evidence that product differentiation sustains pricing power versus commoditized flooring.

🔍 Investment Takeaway

Interface’s long-term investment case rests on specification-driven switching costs embedded in modular flooring installed systems, supported by differentiated product attributes that matter in commercial procurement. While end-markets remain cyclical and pricing competition is real, the company’s competitive position is anchored in customer inertia, channel relationships, and operational execution that can improve resilience and earnings power through renovation-led demand.


⚠ AI-generated — informational only. Validate using filings before investing.

📰 Market News & Coverage

15 Stories Available

Real-time institutional reporting and market updates for TILE.

defenseworld.net2026-07-25

Fifth Third Bancorp Increases Stake in Interface, Inc. $TILE

Fifth Third Bancorp grew its holdings in shares of Interface, Inc. (NASDAQ: TILE) by 27,312.6% in the first quarter, according to the company in its most recent 13F filing with the Securities and Exchange Commission (SEC). The firm owned 47,972 shares of the textile maker's stock after acquiring an additional 47,797 shares during

zacks.com2026-07-07

5 Stocks With Recent Price Strength to Tap Market Rally

APPS, AOUT, FLXS, ASX and TILE surge on strong momentum, with sharp price gains and rising earnings estimates signaling potential for continued upside.

zacks.com2026-07-02

5 High-Efficiency Stocks With Strong Profit Potential to Buy Now

Efficiency-focused screening highlights five stocks with above-industry operating and turnover metrics that may offer strong profit potential.

globenewswire.com2026-07-02

Allegro MicroSystems Unveils Industry's First Safety PMIC to Integrate a Wheel-Speed Sensor Interface for Electromechanical Braking

Pairing sensing leadership with a complete ASIL-D safety PMIC architecture, the single-chip A81415 redefines brake-by-wire design while eliminating up to nine components. Pairing sensing leadership with a complete ASIL-D safety PMIC architecture, the single-chip A81415 redefines brake-by-wire design while eliminating up to nine components.

businesswire.com2026-07-01

Mativ Announces Appointment of Seasoned Finance Executive to its Board of Directors

ALPHARETTA, Ga.--(BUSINESS WIRE)--Mativ Holdings, Inc. (NYSE: MATV) announced today the appointment of Bruce Hausmann to its Board of Directors, effective July 1, 2026. In his role on the Mativ Board of Directors, Hausmann will serve on the Company's Audit Committee. Hausmann is currently the Vice President and Chief Financial Officer of Interface, Inc. (NASDAQ: TILE), a global manufacturer of flooring solutions, a role he has held since April 2017. At Interface, Hausmann leads the company's gl.

zacks.com2026-07-01

Here's Why Momentum in Interface (TILE) Should Keep going

If you are looking for stocks that are well positioned to maintain their recent uptrend, Interface (TILE) could be a great choice. It is one of the several stocks that passed through our "Recent Price Strength" screen.

zacks.com2026-06-26

Interface, Inc. (TILE) Hit a 52 Week High, Can the Run Continue?

Interface (TILE) is at a 52-week high, but can investors hope for more gains in the future? We take a look at the company's fundamentals for clues.

zacks.com2026-06-26

4 Stocks With Strong Interest Coverage Ratios to Buy for H2 2026

CASY, DELL, TILE and CLS stand out for strong interest coverage ratios, solid EPS growth prospects and big one-year stock gains.

zacks.com2026-06-19

Interface (TILE) Moves 5.3% Higher: Will This Strength Last?

Interface (TILE) saw its shares surge in the last session with trading volume being higher than average. The latest trend in earnings estimate revisions may not translate into further price increase in the near term.

globenewswire.com2026-06-18

Wearable Devices Founder to Present “How Brain-Computer Interface is Removing the Friction from AR and AI Interaction” at AWE USA 2026

Guy Wagner, Founder and Chief Scientific Officer of Wearable Devices, will present the session on June 18, 2026, from 1:40 PM to 2:05 p.m. PT in Promenade Room 104B as part of the XR Enablement track at AWE USA 2026 YOKNEAM ILLIT, ISRAEL, June 18, 2026 (GLOBE NEWSWIRE) -- Wearable Devices Ltd.

zacks.com2026-06-17

Interface (TILE) Is Up 5.74% in One Week: What You Should Know

Does Interface (TILE) have what it takes to be a top stock pick for momentum investors? Let's find out.

businesswire.com2026-06-17

Fifth Third Launches AI-Powered Interface in Mobile App

CINCINNATI--(BUSINESS WIRE)--Fifth Third (NYSE: FITB) today announced the launch of an AI‑powered experience within its award‑winning mobile app, making it easier for customers to find what they need and complete everyday financial tasks with fewer steps. The new capability helps customers navigate Fifth Third's mobile app more intuitively. Rather than scrolling through menus, customers can simply type what they need—such as “replace card,” “find ATM,” “transfer funds,” or “closest branch”—and.

businesswire.com2026-06-16

Interface Releases 2025 Impact Report

ATLANTA--(BUSINESS WIRE)--Interface releases its 2025 Impact Report, outlining the company's progress across environmental, social, and governance (ESG) initiatives.

globenewswire.com2026-06-15

Wearable Devices to Unveil GenAI-Powered Intent-Based Interface Platform and Next-Gen Mudra Pro Flagship at AWE 2026

YOKNEAM ILLIT, ISRAEL, June 15, 2026 (GLOBE NEWSWIRE) -- Wearable Devices Ltd. (Nasdaq: WLDS, WLDSW) (Wearable Devices or the Company), a pioneer in artificial intelligence (“AI”)-powered touchless sensing wearables, today announced its comprehensive lineup for the Augmented World Expo 2026 (AWE 2026). The premier industry conference is set to take place June 15 to 18, 2026, in Long Beach, California, At Booth 648 on the expo floor and in meeting room Hall 201A.

fool.com2026-06-14

Interface's General Counsel Sold Company Stock Worth $1.3 Million. Here's a Deeper Look at the Transaction.

General Counsel David Foshee sold 44,393 shares on May 18, 2026, generating proceeds of approximately $1.29 million at around $29 per share. The transaction reduced direct holdings by 20.23%, with 175,014 shares remaining post-sale.

📊 AI Financial Analysis

Powered by StockMarketInfo
Earnings Data: Q Ending 2026-04-05

"TILE reported Q1 2026 results with Revenue of $331.0M and Net Income of $23.6M (net margin 7.1%). On a QoQ basis, Revenue declined to $331.0M from $349.4M in Q4 2025 (-5.3%) while Net Income fell to $23.6M from $24.4M (-3.2%). YoY, Revenue grew from $297.4M in Q1 2025 to $331.0M (+11.3%), and Net Income rose from $13.0M to $23.6M (+81.5%). Profitability is mixed: gross margin was steady/slightly down QoQ (38.5% in Q1 2026 vs 38.6% in Q4 2025; 37.3% in Q1 2025), but operating and net margins were modestly lower QoQ (net margin 7.1% vs 7.0%; operating margin 9.8% vs 10.1%). Cash flow was positive but softer: operating cash flow was $13.5M and free cash flow was $3.2M, with ongoing repurchases (common stock repurchased -$12.0M) and small dividends (-$0.14M). Balance sheet resilience remains solid with Total Assets of $1.21B and equity at $1.21B; net debt was $213.2M, moderately higher than Q4 but still manageable. Total shareholder returns are supported by strong momentum (price up 51.1% over 1 year)."

Revenue Growth

Positive

YoY Revenue increased +11.3% ($331.0M vs $297.4M). QoQ Revenue declined -5.3% ($331.0M vs $349.4M), indicating a short-term pullback despite annual growth.

Profitability

Positive

Net Income YoY surged +81.5% ($23.6M vs $13.0M), with net margin at 7.1% in Q1 2026 vs 4.4% in Q1 2025. QoQ net margin edged down slightly (7.1% vs 6.98%), suggesting margin expansion on a yearly basis but some normalization sequentially.

Cash Flow Quality

Fair

Operating cash flow was $13.5M and free cash flow $3.2M in Q1 2026, down sharply QoQ (OCF $49.3M in Q4 2025). Cash remains positive, but conversion from earnings to FCF weakened sequentially.

Leverage & Balance Sheet

Good

Equity was stable at ~$1.21B, with Total Assets at $1.21B. Net debt was $213.2M; while higher than Q4 2025 ($193.2M), leverage appears manageable given positive interest coverage (12.1x) and strong liquidity ratios (current ratio 2.43).

Shareholder Returns

Good

Price momentum is strong: +51.1% 1-year change, which materially boosts total return potential. Capital return also shows up in repurchases (-$12.0M in Q1 2026); dividends are immaterial (-$0.14M).

Analyst Sentiment & Valuation

Neutral

Consensus price target is $36 (high/low/median all $36) versus current price ~$28.2, implying upside of ~27.7%. Valuation metrics in the provided ratios indicate elevated earnings/FCF multiples, consistent with market expectations.

Disclaimer:This analysis is AI-generated for informational purposes only. Accuracy is not guaranteed and this does not constitute financial advice.

Fundamentals Overview

Loading fundamentals overview...

Interface started 2026 strongly, delivering net sales of $331M (+11.3% reported; +6.8% currency-neutral) and adjusted EPS of $0.41 (+64%) ahead of expectations. Profitability improved meaningfully: adjusted gross margin was 38.3% (+55 bps) from pricing/mix and manufacturing efficiencies, while adjusted SG&A as a percent of sales improved 78 bps to 28.4%. Growth drivers were tightly linked to One Interface execution (combined selling teams) and operational productivity (global supply chain and new robotics in Europe/Australia). Commercial momentum spans corporate office (billings +16%), health care (billings +11%, nora rubber +16%), and education (billings +1% timing). Management raised FY2026 guidance, maintaining an underlying 3%–5% growth framing and citing healthy backlog (+18% YTD). Key near-term risk is Middle East-related input cost inflation (expected low single-digit) and tariff volatility (~15%–20% of COGS), though management reiterated mitigation actions and no tariff refund assumption.

AI IconGrowth Catalysts

  • Noravant rubber flooring launched in late February; initial product noravant timber targeted to patient rooms in health care; expected to begin contributing in Q4 2026 and build over time
  • Carpet tile: two new middle-market collections—Crafted Connections (global) and Open forums (warmer tones expanding Open Air palette); carpet tile billings up double digits in the quarter
  • Nora: expanded norament kivo color range with more vibrant accents and classic tones; K-12 education remains one of the fastest-growing segments for nora
  • One Interface commercial execution: combined selling teams driving broad-based billings growth across corporate office, health care, and education
  • Robotic solutions went live in Europe and Australia, supporting manufacturing/supply chain efficiency and customer service

Business Development

  • No named external partners/customers/vendors disclosed in the transcript

AI IconFinancial Highlights

  • Net sales: $331 million (+11.3% reported, +6.8% currency-neutral) vs expectations; described as ahead of expectations
  • Adjusted EPS: $0.41 (+64% vs $0.25 prior year) and adjusted earnings per diluted share growth ahead of expectations
  • Adjusted gross profit margin: 38.3%, +55 bps driven by favorable pricing/product mix and manufacturing efficiencies
  • Adjusted SG&A: $94.0 million; as % of net sales 28.4%, -78 bps improvement (management cited SG&A leverage and efficiencies)
  • Adjusted operating income: $32.7 million (+28.6% vs $25.5 million); adjusted net income: $23.9 million vs $14.6 million
  • Capital allocation: repurchased $12 million of common stock in Q1
  • Middle East situation: expects low single-digit increase in global input costs; management stated plans to offset via incremental pricing and productivity actions reflected in guidance

AI IconCapital Funding

  • Cash from operating activities: $13.5 million
  • Capex: $10.3 million
  • Share repurchases: $12.0 million in Q1
  • No debt levels or cash runway figures explicitly disclosed in the transcript

AI IconStrategy & Ops

  • One Interface next phase: aligned EMEA commercial organization under a single leader to standardize execution and build on U.S. learning
  • Automation: robotic solutions went live in Europe and Australia; management highlighted efficiency gains, reduced waste, improved customer service, and positioning for growth
  • Global supply chain: supply chain organization working “globally as one” and delivering manufacturing efficiency improvements
  • Product strategy across price points: expanded accessible price points while maintaining premium design leadership to support margin structure and incremental growth

AI IconMarket Outlook

  • Q2 FY2026 guidance: net sales $385M–$395M; adjusted gross margin ~39.9%; adjusted SG&A ~$100M; adjusted interest/other ~$4M; adjusted effective tax rate ~28%; fully diluted weighted avg shares ~59M
  • Full-year FY2026 guidance: net sales $1.45B–$1.48B; adjusted gross margin ~38.8%–39.0%; adjusted SG&A 26.2%–26.4% of net sales; adjusted interest/other $14M–$16M; adjusted effective tax rate ~26%; capex ~ $60M
  • Underlying business growth rate framed as ~3%–5% for the rest of the year (order/backlog support cited); extra-week impact described as “baked in” and difficult to quantify

AI IconRisks & Headwinds

  • Middle East developments: approximately ~1% of net sales exposure; management expects a low single-digit increase in input costs, offset via pricing/productivity; ongoing monitoring required
  • Tariffs: management stated ~15%–20% of COGS subject to tariffs; rates “bouncing around”; no tariff refund assumed in guidance; refund eligibility depends on importer-of-record mechanics
  • Education seasonality: Q1 education billings only +1% due to timing; analysts asked about growth cadence into Q2/early Q3
  • Macro environment in EAAA: currency-neutral net sales +4% described as despite continued challenging macro

Q&A: Analyst Interest

  • Carpet tile double-digit growth durability: Management tied the outperformance to expanded addressable market via accessible price points, disciplined maintenance of margin structure, and continued design leadership at the premium end. They also emphasized corporate office strength (corporate billings +16%) plus return-to-work/flight-to-quality and renovation activity supporting demand.
  • 53-week extra week quantification and underlying growth: Management said the extra week impact was baked into guidance and makes Q1 YoY comps “noise,” but trends remain healthy. They cited underlying growth around 3%–5% supported by orders +8% YoY and backlog +18% YoY, improving confidence in delivering guidance for the rest of the year.
  • Tariffs and tax-rate drivers (Q1 low tax, full-year ~26%): Management explained Q1’s lower tax rate was a discrete stock-based compensation vesting deduction occurring in Q1. On tariffs, management stated tariffs are blended into COGS; no refund assumed in guidance, with ~15%–20% of COGS subject to tariff rate volatility and importer-of-record paying tariffs.

Sentiment: POSITIVE

Note: This summary was synthesized by AI from the TILE Q1 2026 earnings transcript. Financial data is complex; please verify all metrics against official SEC filings before making investment decisions.

📋 Official Regulatory 10-K / 10-Q SEC Filings

Direct authenticated documentation links to audited SEC database reports for TILE.

SEC EDGAR Live Feed
Loading financial data and tables...
📁

SEC Filings (TILE)

© 2026 Stock Market Info — Interface, Inc. (TILE) Financial Profile