Crane Company

Crane Company (CR) Market Cap

Crane Company has a market capitalization of $10.91B.

Price: $188.86

0.50 (0.27%)

Market Cap: 10.91B

NYSE · time unavailable

CEO: Max H. Mitchell

Sector: Industrials

Industry: Industrial - Machinery

IPO Date: 2023-03-29

Website: https://www.craneco.com

Crane Company (CR) - Company Information

Market Cap: 10.91B|Sector: Industrials

Company Profile

Crane Company, together with its subsidiaries, manufactures and sells engineered industrial products in the Americas, Europe, the Middle East, Asia, and Australia. The company has four business segments: Aerospace & Electronics, Process Flow Technologies, Payment & Merchandising Technologies, and Engineered Materials. The Aerospace & Electronics segment supplies critical components and systems, including original equipment and aftermarket parts, primarily for the commercial aerospace, and the military aerospace, defense, and space markets. This segment also offers pressure sensors for aircraft engine control, aircraft braking systems for fighter jets, power conversion solutions for spacecraft, and lubrication systems. The Process Flow Technologies segment provides engineered fluid handling equipment for mission critical applications. It offers process valves and related products, commercial valves, and pumps and systems. The Payment & Merchandising Technologies segment provides electronic equipment and associated software leveraging extensive, and proprietary core capabilities, including payment verification and authentication, as well as automation solutions, field service solutions, remote diagnostics, and productivity enhancing software solutions. The Engineered Materials segment manufactures fiberglass-reinforced plastic panels and coils, primarily for use in the manufacturing of recreational vehicles and in commercial and industrial buildings applications. It provides products and solutions to customers across end markets, including aerospace, defense, chemical and pharmaceutical, water and wastewater, payment automation, non-residential and municipal construction, energy, and banknote design and production, as well as for a range of general industrial and consumer applications. The company was formerly known as Crane Holdings, Co. Crane Company was founded in 1855 and is based in Stamford, Connecticut.

Analyst Sentiment

81%
Strong Buy

From 9 Active Polls

1Y Forecast: $226.50

▲ +19.9% Potential Upside

Consensus Target Metrics

Low Bound

$215

Median

$227

High Bound

$238

Average

$227

Price & Moving Averages

Loading chart...

🎯 Wall Street Analyst Intelligence Report

1-Year structural target targets, chart projections, and sentiment maps.

Average 1Y Target
$226.50
▲ +19.93% Upside
Low Target
$215.00
14% Risk
Median Target
$226.50
20% Mid
High Target
$238.00
26% Max
Consensus
Buy
21 / 28 Buys

Consensus Trend Projection

Trailing closures vs. 12-month metrics map.

Analyst Vote Distribution

Aggregate institutional coverage sentiment weights.

📊 Historical Valuation Multiples

Real-time Trailing Twelve Month (TTM) momentum side-by-side with discrete quarterly metrics.

Fiscal QuarterTTMQ1 2026Q4 2025Q3 2025Q2 2025Q1 2025Q4 2024Q3 2024Q2 2024
Period EndingTrailing 12MMar 31, 2026Dec 31, 2025Sep 30, 2025Jun 30, 2025Mar 31, 2025Dec 31, 2024Sep 30, 2024Jun 30, 2024
Market Cap ($M)10,9069,86710,62310,60610,9008,7938,6659,0548,181
Enterprise Value ($M)11,76510,72610,11010,23210,6288,6178,6789,1418,342
Price to Earnings Ratio (P/E)33.3736.7632.5129.0131.5420.5226.7429.2828.57
Price/Earnings-to-Growth Ratio (PEG)1.8513.958.978.272.267.92
Price to Sales Ratio (P/S)4.4614.1718.2818.0018.8815.7715.9315.1615.48
Price to Book Ratio (P/B)5.194.705.155.395.785.005.295.755.55
Price to Free Cash Flow Ratio (P/FCF)41.69-68.5753.1790.81122.61-145.5743.78124.53149.84
Enterprise Value to Sales (EV/Sales)15.4017.4017.3718.4115.4515.9515.3115.78
Enterprise Value to EBITDA (EV/EBITDA)23.2283.6782.2676.5987.1178.6387.0476.4979.67
Debt to Equity Ratio1.700.580.590.010.030.150.190.220.26

CR Growth Runway Model

Standard long term linear growth fade

Multi-Stage Discounted Cash Flow Sandbox

Market Price$188.86
Intrinsic Value$86.21
Market Alignment
Overvalued by 54.4%relative to calculated intrinsic value
9.00%
Exp: 3%3%
i

Growth runway slowdown

This value provides a time window for the growth rate to decline beyond Stage 1 toward the terminal rate. Longer windows are most useful for companies with high growth starting conditions or strong competitive advantages. This option stretches out the growth rate slowdown across 5, 10, or 15-year steps. A high-growth starting condition (exceeding a 25% initial growth rate) automatically applies a curve decay to simulate realistic, rapid market saturation.
i

Terminal growth rate

With long-term inflation between 3-5%, revenue must grow by that baseline to maintain flat real-world market share. This value sets the permanent terminal growth rate to factor into the valuation beyond the growth slowdown runway toward maturity.

3-Stage Financial Runway Horizon

🧠 Perpetuity Horizon Engine (Stage 3: Post-2035)

Terminal FCF Base$0.36B
Perpetuity TV Value$6.78B
Discounted TV (PV)$2.87B
TV Weighting %59.7%
⚠️
Financial Model Disclaimer & Risk Disclosure: This interactive scenario simulator is an educational sandbox provided strictly for informational and analytical research purposes. Core historical financial statements and consensus estimates are sourced directly via Financial Modeling Prep (FMP). All downstream outputs are entirely deterministic, hypothetical projections generated by combining automated mathematical formulas (including linear interpolation and Gaussian bell-curve decay models) with user-selected variables and third-party financial data inputs. Users assume all liability for trading decisions executed based on these sandbox calculations.

📘 Full Research Report

ℹ️

AI-Generated Research: This report is for informational purposes only.

📘 CRANE (CR) — Investment Overview

🧩 Business Model Overview

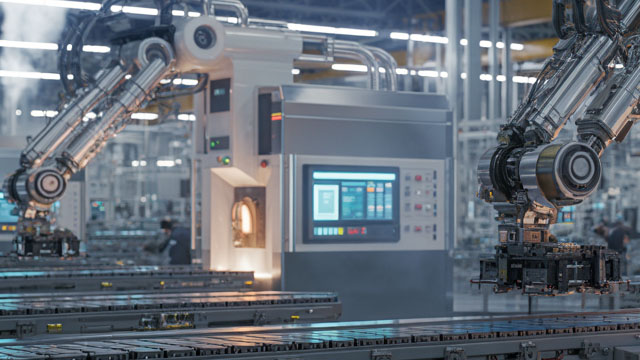
Crane designs and manufactures engineered industrial components used to control, measure, and move critical fluids and materials across demanding end markets. The company’s value chain typically runs from (1) engineering and application support (specifying performance requirements and materials), to (2) precision manufacturing and systems integration for customer-qualified hardware, to (3) a long-run installed-base serving model via replacement parts and aftermarket support. This structure links Crane’s performance to the pace of industrial maintenance cycles and capital spending on process infrastructure, while also benefiting from customers’ preference to standardize on qualified components once systems are in place.

💰 Revenue Streams & Monetisation Model

Revenue is generated through a blend of project/unit sales and aftermarket demand. Crane products are often specified for technical performance, regulatory compliance, and reliability, which supports a sustained aftermarket footprint as fleets and plants require inspection, maintenance, and component replacement. Monetisation is supported by:

  • Engineered-to-spec product sales: Higher technical content and customization opportunities, supporting solid gross margin potential when capacity and mix are favorable.
  • Aftermarket and recurring replacement demand: Replacement of valves, flow components, and related hardware creates a more resilient demand stream than pure greenfield spending.
  • Service and application support (where applicable): Strengthens customer relationships and extends the lifetime value of each installed system.

Margin drivers typically include product mix (higher-value engineered components), manufacturing efficiency, price discipline, and aftermarket share. Working capital management also matters because order timing and customer lead times can affect cash conversion in industrial supply chains.

🧠 Competitive Advantages & Market Positioning

Crane’s moat is best characterized as high switching costs and installed-base stickiness, reinforced by engineering qualification barriers and manufacturing process know-how. Customers often cannot substitute alternatives easily because valve/flow solutions must match stringent performance specs, materials compatibility, pressure/temperature ratings, and safety requirements. Once a plant or system is qualified, Crane components can become part of standardized maintenance processes.

Moat mechanisms:

  • Switching costs (qualification + downtime risk): Re-qualification, potential downtime, and engineering validation make switching from incumbent suppliers costly.
  • Intangible asset: product and application expertise: Deep domain knowledge and engineered execution increase the probability of winning specifications and sustaining aftermarket share.
  • Process reliability and quality history: In critical fluid applications, performance credibility supports preference in bids and repeat orders.

Competitive benchmarking:

  • Emerson (automation and flow control / process solutions): Emerson competes broadly across industrial automation and control, typically leveraging system-level integration.
  • Flowserve (industrial pumps, valves, and flow control): Strong presence in process industries where reliability and service coverage matter.
  • Parker Hannifin (motion and control technologies): Broad portfolio across industrial hydraulics and controls, competing for specification mindshare.

Compared with these larger, more system-diversified rivals, Crane’s positioning tends to emphasize engineered components and specialized process hardware where technical performance, qualification, and installed-base servicing create durable relationships in specific fluid-handling applications.

🚀 Multi-Year Growth Drivers

Over a 5–10 year horizon, Crane’s growth outlook is supported by structural demand themes that extend beyond any single commodity or end-market cycle:

  • Industrial maintenance and modernization: Aging plants require recurring component replacement, refurbishment, and efficiency upgrades—supporting aftermarket and retrofit demand.
  • Process safety and regulatory adherence: Higher safety and compliance expectations increase the value of qualified suppliers and reduce the likelihood of rapid substitution.
  • Complexity of engineered specifications: Growth in chemical processing complexity, energy transition-related industrial activity, and stricter operating constraints supports demand for high-performance components.
  • Serviceable installed base expansion: Each successfully installed system expands the potential replacement and parts pipeline for years.
  • Geographic and customer relationship depth: Industrial customers often centralize purchasing with proven suppliers across multiple sites, supporting repeatability of orders.

⚠ Risk Factors to Monitor

  • Industrial cycle sensitivity: Capital spending slowdowns can pressure order intake, especially for OEM and new build projects.
  • Supply chain and input cost volatility: Metals, precision components, and logistics can influence margins if pricing or sourcing flexibility lags cost changes.
  • Competitive substitution risk: While switching costs are meaningful, aggressive pricing or improved offerings from established competitors can pressure margin and share in certain specs.
  • Execution and capacity constraints: Engineered products require reliable throughput and quality; execution issues can lead to customer attrition or delayed shipments.
  • Regulatory or standard changes: Updates to safety/performance standards may require redesigns or qualification work that affects near-term economics.

📊 Valuation & Market View

The market generally values industrial engineered manufacturers through metrics that reflect both earnings power and cyclicality risk, commonly including EV/EBITDA and earnings multiples (and, for investors focused on durability, price-to-cash-flow). Key valuation drivers include:

  • Margin quality: Evidence of stable gross margin and disciplined operating expenses across cycles.
  • Aftermarket contribution: Higher share of replacement/recurring demand tends to support a valuation premium.
  • Order-to-revenue conversion and backlog quality: Backlog composition and conversion timing inform confidence in future cash generation.
  • Working capital discipline: Sustained cash conversion can reduce perceived cyclicality.

Investors typically adjust expectations based on industrial capex trends, backlog visibility, and management’s ability to protect margins through mix and operational efficiency.

🔍 Investment Takeaway

Crane’s long-term investment case rests on a durable switching-cost model driven by installed-base qualification, engineering expertise, and reliability requirements in critical fluid-handling applications. This creates structural customer stickiness that can dampen end-market volatility relative to purely project-driven industrial peers. With a mix of engineered product demand and replacement/aftermarket visibility, Crane is positioned to compound value through cycles if it sustains manufacturing discipline, product mix quality, and customer qualification momentum.


⚠ AI-generated — informational only. Validate using filings before investing.

📰 Market News & Coverage

15 Stories Available

Real-time institutional reporting and market updates for CR.

zacks.com2026-05-27

Implied Volatility Surging for Crane Company Stock Options

Investors need to pay close attention to CR stock based on the movements in the options market lately.

gurufocus.com2026-05-16

ImmunityBio Signs Exclusive U.S. Agreement with Japan BCG Laboratory for the Tokyo Strain of BCG to Enhance BCG Supply in the United States

ImmunityBio, Inc. ([url="]NASDAQ: IBRX[/url]), a commercial-stage immunotherapy company, today announced an exclusive U.S. Development and Supply Agreement wit

gurufocus.com2026-05-15

Crane Co (CR) Stock Down 4.1% -- Now Undervalued? GF Score: 86/100

On May 15, 2026, Crane Co (CR) shares fell 4.1% to a current price of $172.19. This decline comes in the context of a 52-week range that saw a high of $214.31 a

marketbeat.com2026-05-09

Crane NXT Q1 Earnings Call Highlights

Crane NXT NYSE: CXT reported first-quarter 2026 sales growth and reaffirmed its earnings outlook while updating its full-year guidance to include the recently completed acquisition of Antares Vision.

globenewswire.com2026-05-06

Crane NXT Reports First Quarter 2026 Results

Completes Acquisition of Antares Vision, a Global Leader in Inspection, Detection, and Track & Trace Technologies Delivers Organic Sales Growth of 6%; Maintains Full Year EPS Guidance of $4.10 to $4.40 WALTHAM, Mass., May 06, 2026 (GLOBE NEWSWIRE) -- Crane NXT, Co. (NYSE: CXT) ("Crane NXT" or the "Company"), a global leader in authentication and traceability technologies, today announced its financial results for the first quarter ended March 31, 2026.

gurufocus.com2026-05-01

Crane Co (CR) Stock Down 3.1% -- Now Undervalued? GF Score: 87/100

On May 01, 2026, Crane Co (CR) shares fell 3.1% to $172.24. This decline comes amid a 52-week trading range of $159.58 to $214.31, indicating some volatility in

seekingalpha.com2026-04-28

Crane Company (CR) Q1 2026 Earnings Call Transcript

Crane Company (CR) Q1 2026 Earnings Call Transcript

businesswire.com2026-04-27

Crane Company Reports First Quarter 2026 Results and Raises Full Year EPS Guidance

STAMFORD, Conn.--(BUSINESS WIRE)--Crane Company ("Crane," NYSE:CR) today announced its financial results for the first quarter of 2026 and raised its full year adjusted EPS outlook. Alex Alcala, Crane's President and Chief Executive Officer, stated: "We delivered a very strong start to 2026, generating 15% adjusted EPS growth in the first quarter. Results exceeded our expectations with the majority of our outperformance driven by outstanding execution and momentum across our recent acquisitions.

businesswire.com2026-04-27

Crane Company Announces Completion of CEO Succession

STAMFORD, Conn.--(BUSINESS WIRE)--Crane Company (NYSE: CR) today announced the completion of its previously disclosed CEO succession plan, effective April 27, 2026. Mr. Alex Alcala has assumed the role of President and Chief Executive Officer, succeeding Mr. Max Mitchell, who has transitioned to the role of Executive Chairman, as planned. Mr. Alcala brings thirteen years of experience within Crane and deep knowledge of the Company's markets, operations, and strategic priorities. During his tenu.

defenseworld.net2026-04-27

Crane (NYSE:CR) versus EnWave (OTCMKTS:NWVCF) Financial Contrast

Crane (NYSE: CR - Get Free Report) and EnWave (OTCMKTS:NWVCF - Get Free Report) are both industrials companies, but which is the superior business? We will contrast the two companies based on the strength of their valuation, analyst recommendations, risk, profitability, earnings, institutional ownership and dividends. Analyst Ratings This is a summary of current ratings and

defenseworld.net2026-04-23

State of Alaska Department of Revenue Has $902,000 Position in Crane $CR

State of Alaska Department of Revenue lowered its stake in shares of Crane (NYSE: CR) by 54.5% during the fourth quarter, according to its most recent Form 13F filing with the Securities and Exchange Commission (SEC). The institutional investor owned 4,892 shares of the conglomerate's stock after selling 5,869 shares during the quarter.

seekingalpha.com2026-04-20

Crane Company Is Too Lofty For My Liking, Even As Earnings Near

Crane Company remains rated a soft "Sell" due to high absolute valuation despite strong operational momentum and acquisition-driven growth. CR's 2026 guidance projects revenue of $2.845–$2.875 billion and adjusted EPS of $6.55–$6.75, with core sales expected to grow mid-single digits. Aerospace & Advanced Technologies outperforms with 14.7% revenue growth and backlog expansion, while Process Flow Technologies faces organic headwinds.

globenewswire.com2026-04-09

Crane NXT Announces Dates for First Quarter 2026 Earnings Release and Earnings Call

WALTHAM, Mass., April 09, 2026 (GLOBE NEWSWIRE) -- Crane NXT, Co. (NYSE: CXT), a premier industrial technology company, today announced its schedule for the company's first quarter 2026 results.

businesswire.com2026-04-07

Crane Company Announces Date for First Quarter 2026 Earnings Release and Teleconference

STAMFORD, Conn.--(BUSINESS WIRE)--Crane Company (NYSE: CR) announces the following schedule and teleconference information for its first quarter 2026 earnings release: Earnings Release: April 27, 2026 after close of market by public distribution and the Crane Company website at www.craneco.com. Teleconference: April 28, 2026 at 10:00 AM (Eastern) hosted by Alex Alcala, Executive Vice President & COO (Incoming President & CEO), and Richard A. Maue, Executive Vice President & CFO. The.

globenewswire.com2026-04-01

Crane NXT Completes Acquisition of Antares Vision

Adds Market-Leading Capabilities in Detection, Inspection, and Traceability Technologies Expands Crane NXT's Portfolio into the ~$3 Billion Life Sciences and Food & Beverage Sectors WALTHAM, Mass., April 01, 2026 (GLOBE NEWSWIRE) -- Crane NXT, Co. (NYSE: CXT) (“Crane NXT” or the “Company”), a global leader in authentication and traceability technologies, today announced the successful completion of the acquisition of Antares Vision S.p.A.

📊 AI Financial Analysis

Powered by StockMarketInfo
Earnings Data: Q Ending 2026-03-31

"CR delivered Q1’26 revenue of $696.4M and net income of $67.1M (EPS $1.14). YoY, revenue rose from $577.2M in Q2’25 to $696.4M in Q1’26 (+20.6%), while net income increased from $80.3M (Q2’25) to $67.1M (Q1’26) (-16.4%). QoQ, revenue jumped from $581.0M in Q4’25 to $696.4M (+19.8%), but net income declined from $81.7M (+) to $67.1M (-17.9%). Profitability softened across the last four quarters: net margin compressed to 9.6% in Q1’26 from 14.1% in Q4’25 and ~15–16% in Q2–Q3’25, indicating margin pressure despite higher top-line momentum. Operating income fell to $100.1M and operating margin moved down to 14.4% from 17.5% in Q4’25. Cash flow quality deteriorated sharply: operating cash flow was -$133.2M and free cash flow -$143.9M in Q1’26, versus positive operating cash flow in Q4’25 (+$209.6M) and Q3’25 (+$130.2M). The quarter also involved a large cash outflow tied to acquisitions (-$1.355B), contributing to a net cash decline of -$1.37B. Balance sheet leverage appears elevated with net debt rising to $842.8M from net cash previously. Total shareholder returns look supportive: shares were up 36.19% over 1Y, and CR pays a small dividend (~0.15% yield). Analyst consensus price target ($222.25) remains above the current price ($192.81)."

Revenue Growth

Good

Revenue accelerated QoQ (+19.8% from $581.0M in Q4’25 to $696.4M in Q1’26) and was up vs the prior-year comparable period in the provided set (from $577.2M in Q2’25 to $696.4M, +20.6%).

Profitability

Caution

Margins contracted materially: net margin fell to 9.6% in Q1’26 from 14.1% in Q4’25 (and ~15–16% in Q2–Q3’25). Net income declined QoQ (-17.9%) despite revenue growth.

Cash Flow Quality

Neutral

Operating cash flow turned negative to -$133.2M and free cash flow to -$143.9M in Q1’26, after +$209.6M in Q4’25. Large acquisition-related cash outflow drove the deterioration.

Leverage & Balance Sheet

Fair

Assets rose but liquidity declined: cash fell to $355.4M from $1.73B (Q4’25). Net debt increased to $842.8M (from net cash in prior quarters), indicating reduced balance-sheet cushion.

Shareholder Returns

Good

Strong momentum: 1Y price change +36.19%. Dividend yield is modest (~0.15%), with no buyback effect provided in cash flow (repurchases shown as zero).

Analyst Sentiment & Valuation

Fair

Consensus target ($222.25) implies upside vs $192.81 current price, but valuation appears rich on earnings/FCF measures (high trailing P/E; negative P/FCF in Q1 due to negative FCF).

Disclaimer:This analysis is AI-generated for informational purposes only. Accuracy is not guaranteed and this does not constitute financial advice.

Fundamentals Overview

Loading fundamentals overview...

Crane opened 2026 with strong execution and clear upward revisions. Q1 adjusted EPS was $1.65 (+15% YoY) on 25% total sales growth and 4% core growth, with acquisitions contributing 18% of sales. Management explicitly tied the beat to faster-than-planned integration and PSI/cost actions plus early value-pricing and commercial excellence read-through, particularly across Druck, Panametrics, Reuter-Stokes, and OPTECH. The company raised full-year adjusted EPS by $0.10 to $6.65–$6.85 and now expects acquisition accretion of at least 15 cents for the year—about double the January expectation—with improved earnings balance (Q2 similar to Q1; ~49%/51% split). Margin detail was mixed at the segment level, but PFT adjusted operating margin was ~50 bps above prior year. Key headwinds remain in commercial aftermarket and Middle East-related timing/freight impacts, yet management highlighted military aftermarket spares and specific programs (F-16 brake control upgrades) as offsets.

AI IconGrowth Catalysts

  • Aerospace & Advanced Technologies: strong aerospace/defense demand with rising RFP/RFQ activity; commercial OE up 20% and military OE up 10% in Q1
  • Defense orders: strong PAC-3 program orders; incremental LTAMDS orders with additional contract negotiations
  • Process Flow Technologies (PFT): improved adjusted margins (+50 bps) supported by power generation strength, pharma project momentum tied to U.S. capacity expansion, LNG strength, and cryogenics capacity needs
  • PFT Middle East exposure limited (~5% of segment sales), with shipments continuing but project timing/freight disruptions expected to affect balance of 2026

Business Development

  • Recent acquisitions driving upside: Druck, Panametrics, Reuter-Stokes, OPTECH (OPTECH Danielote referenced)
  • M&A pipeline: multiple processes underway in both segments; described sweet spot around ~$500M value with bolt-ons smaller and selective larger deals

AI IconFinancial Highlights

  • Adjusted EPS of $1.65 up 15% year over year
  • Total sales up 25% with 4% core sales growth; acquisitions contributed 18% of Q1 sales (modestly above expectations)
  • Adjusted full-year outlook raised by $0.10 to $6.65–$6.85
  • Acquisition accretion outlook: full-year accretion now expected at least double January communication (~15 cents EPS)
  • Aerospace & Advanced Technologies adjusted segment margin: 24.6% vs 26.2% last year (primarily impact of Druck acquisition); described as nearly 200 bps better than expected
  • Process Flow Technologies adjusted operating margin: 22.1% vs prior year inclusive of acquisition dilution; ~50 bps above prior year
  • Tax rate guidance: ~23% for 2026
  • Corporate expense: Q1 $24M slightly below expectations; full-year forecast $80M–$85M
  • Middle East conflict impact: PFT conflict impact nominal in Q1; expects projects moving right and freight/other inflationary headwinds through 2026 balance

AI IconCapital Funding

  • Pro forma net leverage at end of quarter: 1.4x
  • Management stated substantial available M&A capacity; no specific buyback or new debt amounts disclosed in the provided transcript

AI IconStrategy & Ops

  • CBS machine integration: integration/deployment of Druck, Panametrics, Reuter-Stokes, OPTECH progressing ahead of plan with early benefits arriving faster than January guidance
  • PSI (Process/strategy initiative) cost actions: eliminating the overall PSI layer and executing product line simplification/restructuring faster than planned
  • PFT portfolio repositioned around pharmaceuticals, wastewater, cryogenics, chemicals, and nuclear power; pricing and cost actions used tactically to manage near-term variability
  • Quarterly earnings cadence: Q2 expected similar to Q1; full-year earnings split more balanced at ~49%/51% between first and second half due to acquisition performance

AI IconMarket Outlook

  • Full-year adjusted EPS guidance raised to $6.65–$6.85 (+$0.10)
  • AAT full-year core sales growth expected at high end of 7%–9% range
  • AAT aftermarket guidance: commercial aftermarket could decline full-year; management confidence of offset vs revised outlook via military spares strength
  • PFT full-year core operating leverage expected at 30%–35%
  • AAT defense: PAC-3 replenishment signals and missile/radar demand; potential ordering benefits dependent on timing/lead times

AI IconRisks & Headwinds

  • Commercial aftermarket risk: geopolitical dynamics, elevated oil prices, and long-haul Middle East travel disruption could pressure commercial aftermarket as year progresses
  • PFT Middle East project timing: only ~5% of PFT segment sales directly exposed; expect projects to move to the right and freight/other inflationary headwinds through 2026
  • PFT chemicals remains sluggish at trough levels; Gulf momentum expected only after several quarters as higher oil prices typically drive demand with a lag
  • Acquisitions execution risk remains, though management emphasized integration/deployment progressing ahead of plan

Q&A: Analyst Interest

  • PSI/PSI-related margin and ROIC timing: Management attributed upside to stronger execution, faster elimination of PSI layer plus within-business restructuring, and early value pricing/commercial excellence. They raised expectations from ~200 bps margin improvement to at least 300 bps and confirmed confidence in overdelivering versus the five-year ROIC plan.
  • Commercial aftermarket guidance mechanics and offsets: Management explained they lowered the commercial aftermarket outlook due to Middle East/travel and conflict-related headwinds, but emphasized the magnitude is small versus initial January assumptions. Offsets come from military aftermarket spares (+28% Q1) and additional second-quarter through-balance benefits from the F-16 brake control upgrade program.
  • PFT order momentum and “inflection” debate: Management linked PFT sequential order strength to power generation (Americas), pharmaceuticals, cryogenics, and wastewater. They said energy-price-insulated demand supports durability, while chemicals remains sluggish and not yet an inflection until Gulf momentum appears after a lag, potentially aided by MRO activity pickup.

Sentiment: POSITIVE

Note: This summary was synthesized by AI from the CR Q1 2026 earnings transcript. Financial data is complex; please verify all metrics against official SEC filings before making investment decisions.

📋 Official Regulatory 10-K / 10-Q SEC Filings

Direct authenticated documentation links to audited SEC database reports for CR.

SEC EDGAR Live Feed
Loading financial data and tables...
📁

SEC Filings (CR)

© 2026 Stock Market Info — Crane Company (CR) Financial Profile