CRH plc

CRH plc (CRH) Market Cap

CRH plc has a market capitalization of .

No quote data available.

CEO: Jim Mintern

Sector: Basic Materials

Industry: Construction Materials

IPO Date: 1989-07-13

Website: https://www.crh.com

CRH plc (CRH) - Company Information

Market Cap: -|Sector: Basic Materials

Company Profile

CRH plc, together with its subsidiaries, provides building materials solutions in Ireland, the United States, the United Kingdom, rest of Europe, and internationally. It operates through three segments: Americas Materials Solutions, Americas Building Solutions, and International Solutions. The company offers building materials for the construction and maintenance of public infrastructure, and commercial and residential buildings, as well as construction and renovation of public infrastructure, critical networks, commercial and residential buildings, and outdoor living spaces; paving and construction services; and produces and sells aggregates, cement, ready mixed concrete and mortars, and asphalt. It also manufactures, supplies, and delivers value-added solutions for the built environment in communities in North America; and provides building and infrastructure solutions for complex critical utility infrastructure, such as water, energy, transportation, and telecommunications projects, and outdoor living solutions for private and public spaces. In addition, the company produces and supplies precast and pre-stressed concrete products comprising floor and wall elements, beams and vaults, pipes, and manholes; and concrete and polymer-based products, such as underground vaults, drainage systems, enclosures, and modular precast structures for applications in water, energy, telecommunications, and railroad markets. Further, it provides crushed stone, sand, and gravel; a range of engineered steel and polymer-based anchoring, fixing, and connecting solutions for various new-build construction applications; concrete masonry, hardscape, and related products, including pavers, blocks and curbs, retaining walls and slabs; and fencing and railing systems, composite decking, lawn and garden products and packaged concrete mixes. CRH plc was founded in 1936 and is based in Dublin, Ireland.

Analyst Sentiment

84%
Strong Buy

From 23 Active Polls

1Y Forecast: $135.60

▲ +0.0% Potential Upside

Consensus Target Metrics

Low Bound

$120

Median

$139

High Bound

$147

Average

$136

Price & Moving Averages

Loading chart...

🎯 Wall Street Analyst Intelligence Report

1-Year structural target targets, chart projections, and sentiment maps.

Average 1Y Target
$135.60
▲ +29.07% Upside
Low Target
$120.00
14% Risk
Median Target
$139.00
32% Mid
High Target
$147.00
40% Max

Consensus Trend Projection

Trailing closures vs. 12-month metrics map.

Analyst Vote Distribution

Aggregate institutional coverage sentiment weights.

Sentiment volume allocation data unavailable.

Historical valuation matrix unavailable.

📘 Full Research Report

ℹ️

AI-Generated Research: This report is for informational purposes only.

📘 CRH PUBLIC LIMITED PLC (CRH) — Investment Overview

🧩 Business Model Overview

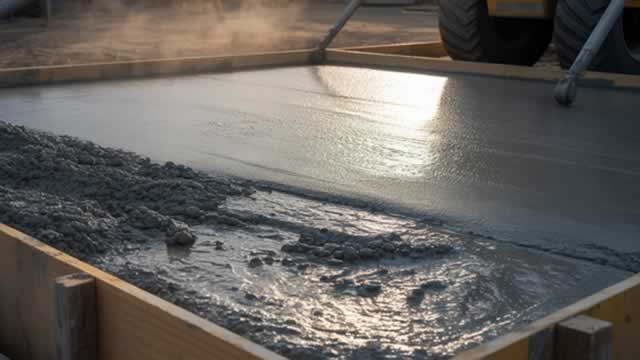
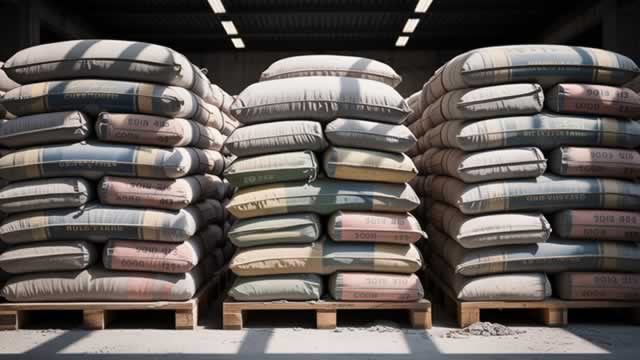
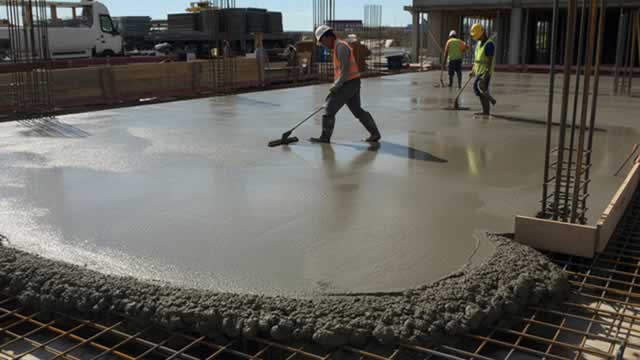
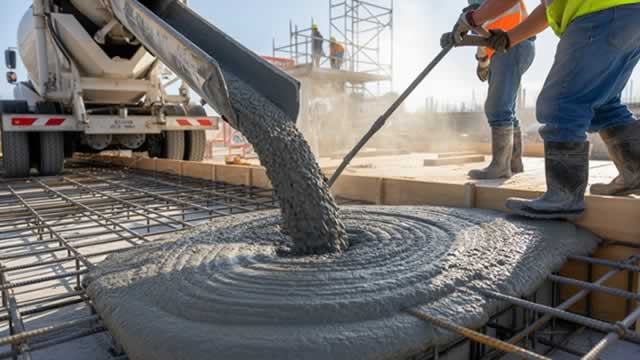
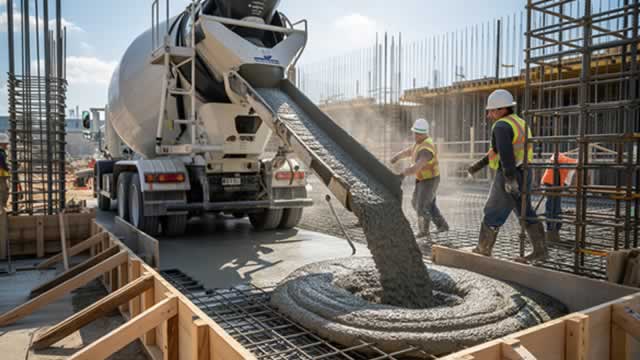
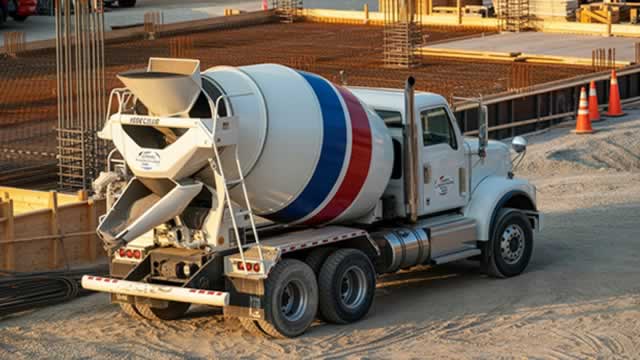
CRH produces and distributes construction materials used across the build cycle: aggregates (crushed stone, sand, gravel), cement and cementitious products, asphalt, and ready-mixed concrete, with related construction materials services. The business typically sources inputs from long-lived, permitted local assets (e.g., quarries and cement operations), then converts them into products at regional plants, and finally delivers them to contractors and infrastructure customers through extensive logistics networks.

The “how it works” is location-driven: transportation costs and delivery reliability matter because many building materials are heavy, bulky, and time-sensitive. CRH’s value creation is therefore concentrated in operating near end-markets while controlling the cost base and maintaining supply continuity through integrated upstream assets (resources and plants) and downstream distribution.

💰 Revenue Streams & Monetisation Model

CRH monetises primarily through a largely transactional model tied to construction activity, with pricing and volume acting as the main levers:
  • Aggregates and asphalt: predominantly transactional sales, with margins influenced by regional pricing, plant/route utilization, and energy and haul costs.
  • Ready-mixed concrete and cementitious products: transactional sales supported by distribution coverage and mix optimization; competitiveness depends on delivery radius, customer service levels, and procurement efficiency.
  • Services and related products: contributions from materials-handling, logistics, and construction-adjacent activities that typically benefit from longer customer relationships than commodity-only supply.
Margin drivers are structural rather than purely “pricing power”:
  • Geographic cost advantage: shorter haul distances and proximity to demand reduce variable costs.
  • Operational scale: higher utilization and asset productivity lower unit costs.
  • Input and energy management: energy-intensive processes (notably cement) and asphalt binder costs can compress or expand margins depending on procurement and timing.
  • Mix and product specialization: products with better technical performance and localized specifications can support more stable margins versus lowest-cost commodity supply.

🧠 Competitive Advantages & Market Positioning

Primary moat: Geographic cost advantage reinforced by logistics infrastructure and permitting-led scarcity. Competitors can replicate branded marketing more easily than they can replicate local supply chains for heavy materials. CRH’s assets—quarries, cement plants, concrete/asphalt plants, terminals, and distribution footprints—create a practical barrier through delivery radius economics, long permitting timelines, and the fixed nature of capacity once established.

Why the moat holds:
  • Switching costs (practical): contractors and infrastructure operators qualify suppliers on reliability, delivery schedules, compliance, and historic performance. Switching often involves downtime and specification re-approvals, raising friction beyond simple unit price comparisons.
  • Logistical infrastructure: heavy-material delivery costs create localized markets. Firms with denser local networks and nearby production have a structural cost edge.
  • Local permitted resources: access to high-quality aggregates and the ability to expand or replace reserves are constrained by regulation and community approval processes.
  • Scale in procurement and operations: large purchasing volumes and operational know-how support cost discipline, even when pricing cycles tighten.
Competitive benchmarking (primary peers):
  • Heidelberg Materials: Strong European cement and construction materials exposure with a heavy footprint in materials manufacturing; CRH typically blends scale in Europe with a substantial U.S. presence and a broader regional distribution network.
  • LafargeHolcim (through legacy and ongoing group structure): Broad construction materials reach with cement and aggregates exposure; CRH’s differentiation often comes from local market density and the ability to convert upstream resources into downstream delivery coverage across regions.
  • Cemex: Significant cement and ready-mix footprint with geographic diversification; CRH’s emphasis remains on regional logistics and localized supply chain strength, particularly across aggregates and asphalt segments.
Industry focus contrast: While peers compete across broadly similar end-markets, CRH’s positioning tends to emphasize diversified construction materials across multiple regions with an operational focus on local cost and logistics effectiveness—where proximity and permitted capacity are more decisive than purely global manufacturing scale.

🚀 Multi-Year Growth Drivers

Over a 5–10 year horizon, CRH’s growth outlook is best framed as a mix of cyclical end-market resilience and structural capacity and efficiency improvements:
  • Infrastructure and construction spending: Multi-year capital programs in transport, energy grid modernization, and housing support long-duration demand for aggregates, asphalt, and cementitious materials.
  • Grid and energy transition buildout: While the energy transition spans multiple industries, it increases demand for foundations, civil works, and associated construction materials, benefiting heavy-material suppliers with local footprints.
  • Replacement and maintenance cycles: Repair and rehabilitation of roads, bridges, and buildings provide demand continuity beyond new-build cycles.
  • Margin expansion through operational excellence: Asset utilization, quality, plant optimization, and logistics routing improve unit economics through the cycle.
  • Portfolio and capacity optimization: Redeploying capital toward higher-return assets, rationalizing underperforming capacity, and selective expansion in constrained local markets can support compounding performance.
  • Potential demand uplift from low-carbon cementitious solutions: Technical and regulatory pressure increasingly rewards suppliers that can meet customer specifications for lower embodied carbon mixes, though the pace and economics vary by region.

⚠ Risk Factors to Monitor

  • Construction cycle volatility: demand and pricing for heavy materials move with economic conditions; excess capacity can pressure margins.
  • Energy and input cost exposure: cement and asphalt operations can face margin swings from energy, electricity, fuel, and binder-related costs.
  • Permitting, environmental regulation, and carbon policy: compliance costs and limits on expanding quarries and plants can constrain growth and raise capex needs.
  • Capital intensity and execution risk: maintaining and upgrading plants, logistics assets, and environmental controls requires steady investment; execution quality influences long-term returns.
  • Competitive intensity and regional overbuild: where local demand is insufficient for existing capacity, pricing discipline may deteriorate.

📊 Valuation & Market View

CRH is typically valued using enterprise-value frameworks appropriate for cyclical, asset-intensive industrials. Market participants generally emphasize:
  • Cash generation and earnings quality: free cash flow conversion across the cycle and disciplined working capital management.
  • EV/EBITDA and net leverage: build-material businesses often trade with consideration for cycle normalization and balance-sheet strength.
  • Operational indicators: utilization, pricing versus input inflation, and regional margin durability.
  • Capex and growth reinvestment returns: sustaining and expanding permitted, near-market capacity affects long-run earnings power.
Key drivers that move valuation multiples are usually the perceived stability of margins through cycles, the sustainability of cash flows after maintenance and environmental capex, and the ability to execute portfolio optimization without eroding competitive positioning.

🔍 Investment Takeaway

CRH’s long-term investment case rests on a durable geographic moat: proximity to construction demand enabled by permitted upstream resources, dense manufacturing footprints, and logistics-led delivery economics. Although end-market activity remains cyclical and energy/input costs can pressure margins, CRH’s localized supply chain advantages, practical customer switching friction, and scale-driven cost discipline provide a structurally defensible position versus regional commodity suppliers.

⚠ AI-generated — informational only. Validate using filings before investing.

📊 AI Financial Analysis

Powered by StockMarketInfo
Earnings Data: Q Ending 2026-03-31

"Q1 2026 Revenue was $7.37B and Net Income was -$0.18B (EPS -$0.27). QoQ, revenue fell from $11.07B in Q4 2025 to $7.37B (-33.4%) and net income deteriorated from +$2.61B to -$0.18B. YoY, revenue rose from $6.76B in Q1 2025 to $7.37B (+9.1%), but net income swung from -$0.10B to -$0.18B (down -78.2%). Profitability contracted sharply in the quarter: gross margin was 27.7% vs 27.2% YoY (slightly up), yet operating income turned negative (-$38M) and net margin was -2.4% versus -1.5% YoY. Cash flow weakened materially. Operating cash flow was -$0.62B and free cash flow was -$1.22B, versus positive OCF and FCF in Q4 2025 (OCF +$2.92B; FCF +$2.09B). Working capital was a drag (change in working capital -$1.02B), and the quarter also saw higher cash usage driven by operations. Balance sheet resilience remains mixed but adequate: total assets were $58.2B and equity was $23.1B, while net debt increased to $16.6B from $15.6B in Q4. Shareholder returns look strong on the market side: the stock is up 37.7% over 1 year, supporting total return even though this quarter shows no dividends paid and buybacks of -$0.33B."

Revenue Growth

Positive

YoY revenue increased +9.1% (Q1 2026 $7.37B vs Q1 2025 $6.76B), but QoQ declined -33.4% (vs Q4 2025 $11.07B). Trajectory is up versus last year but down versus last quarter.

Profitability

Neutral

Margins and earnings contracted sharply: operating income was -$38M (negative vs +$3.69B in Q4) and net income was -$0.18B (worse than -$0.10B YoY). Net margin -2.4% vs -1.5% YoY.

Cash Flow Quality

Neutral

Weak quarter: operating cash flow -$0.62B and free cash flow -$1.22B. This contrasts with Q4 2025 (OCF +$2.92B; FCF +$2.09B). Working capital was a major drag (change in working capital -$1.02B).

Leverage & Balance Sheet

Neutral

Not a bank, but financial resilience is supported by sizable equity ($23.1B). Total assets were steady (~$58.2B). Net debt rose to $16.6B from $15.6B QoQ, so leverage is slightly less favorable.

Shareholder Returns

Good

Strong price momentum: +37.7% 1-year change. In-quarter capital returns included buybacks (-$0.33B), but dividends paid were $0 in Q1, so income yield contribution is limited.

Analyst Sentiment & Valuation

Fair

Price target consensus is $135.6 vs current price $117.05 (implied upside ~15.9%). High 1Y momentum supports sentiment, but the quarter’s earnings/cash drawdown tempers confidence.

Disclaimer:This analysis is AI-generated for informational purposes only. Accuracy is not guaranteed and this does not constitute financial advice.

Fundamentals Overview

Loading fundamentals overview...

CRH delivered a strong Q1 2026 start, with revenues of $7.4B (+9% y/y) and adjusted EBITDA of $586M (+18% y/y). Profitability expanded materially: overall margin +70 bps, while International Solutions added +130 bps despite earlier-year weather impacts. The quarter’s momentum is tied to early-season transportation and reindustrialization projects, plus resilient demand in water-linked infrastructure. Management reaffirmed full-year guidance with adjusted EBITDA of $8.1B–$8.5B and diluted EPS of $5.60–$6.05, explicitly assuming normal seasonality and no major geopolitical/macro dislocations. Key underwriting drivers include: continuing IIJA and state funding rollout, strong backlogs, and pricing discipline backed by market-by-market strategies. Portfolio activity is substantial: $1.9B divestments and ~$900M of acquisitions, including a ~$700M Axius Water deal expected in Q2, reinforcing the water transmission/water quality growth thesis. Risks center on cost inflation (including energy volatility) and weather, both addressed via hedging, winter-fill procurement advantages, and proactive pricing.

AI IconGrowth Catalysts

  • Early-season project activity driving higher volumes in aggregates and cementitious materials
  • Transportation megatrend supported by IIJA rollout and additional state DOT budgets
  • Water infrastructure focus on water transmission and water quality (fastest-growing U.S. water segments)
  • Reindustrialization demand from large manufacturing and data center construction (chip plant in Boise; data center in Michigan)

Business Development

  • Agreement to acquire Axius Water for approximately $700 million (water quality and nutrient removal solutions)
  • Divestment announced for Construction Accessories (noncore; previously announced; proceeds included in $1.9B total)
  • Agreed divestment of Lawn & Garden business (manufacturer/supplier of mulch, soil and decorative stone) for $1.1 billion
  • MoistureShield divestment closed in early April (manufacturer of composite decking)
  • Portfolio M&A includes 8 value-accretive acquisitions completed year-to-date (excluding Axius)

AI IconFinancial Highlights

  • Q1 revenues: $7.4B, +9% y/y
  • Q1 adjusted EBITDA: $586M, +18% y/y
  • Q1 margin expansion: +70 bps (overall), driven by operational improvements and cost discipline
  • Americas Materials Solutions: revenues +21% y/y; aggregate volumes +14%; aggregate mix-adjusted pricing +5%; cement volumes +10% with pricing -1%
  • International Solutions: revenues +5% y/y; adjusted EBITDA +32% y/y; margin expansion +130 bps
  • Building & Infrastructure Solutions: revenues +4% y/y (data center and utility demand); Outdoor Living Solutions revenues -3% y/y due to delayed season from adverse weather
  • 2026 guidance reaffirmed: adjusted EBITDA $8.1B–$8.5B; net income $3.9B–$4.1B; diluted EPS $5.60–$6.05

AI IconCapital Funding

  • Divestments agreed year-to-date: 3 noncore businesses for total consideration of $1.9B
  • Acquisitions announced/investing: approximately $900M in 9 value-accretive acquisitions
  • Share buybacks: ~$400M returned so far in 2026; commencing additional quarterly tranche of $300M to complete no later than July 28
  • Board dividend: $0.39 per share (+5% vs prior year)
  • Balance sheet/capacity: approximately $40B financial capacity over next 5 years to invest

AI IconStrategy & Ops

  • Connected portfolio approach emphasized across aggregates, cementitious, roads, and water to increase share-of-wallet and reduce capital intensity
  • Winter-fill program described for Roads: off-season storage of about half annual liquid requirement; ability to lock procurement pricing and ensure supply during a limited paving season (now to Thanksgiving)
  • Energy and input cost management described as market-by-market with proactive midyear, targeted price increases
  • Portfolio optimization described as continuous capital recycling to shift exposure toward higher-growth, connected platforms (water emphasized)

AI IconMarket Outlook

  • Transportation demand: IIJA rollout with ~50% of highway funds yet to be deployed; 2026 state-level DOT budgets up 6% y/y; 2026 expected to be a record year for transportation infrastructure investment
  • Guidance assumptions: normal seasonal weather patterns for remainder of 2026 and no further major geopolitical/macro dislocations
  • Management tracking: backlogs “nicely up year-on-year” supporting demand visibility into the season

AI IconRisks & Headwinds

  • Energy cost volatility (energy ~5% of total annual revenues), mitigated via rolling 9-month hedging coverage
  • Inflation in non-energy costs: mid-single-digit inflation expected across labor, raw materials, maintenance, and subcontractors
  • Adverse weather impact: Outdoor Living Solutions delayed start; International Europe weather impact in January/February (recovered in March/April)
  • Residential new-build remains subdued due to affordability challenges (not a demand issue; underbuild and demographics cited)

Q&A: Analyst Interest

  • Guidance build for aggs/cement volumes and pricing: Management highlighted low single-digit volume improvement for aggregates and cement, with mid-single-digit pricing; Q1 aggregates showed +14% volume and +5% mix-adjusted pricing, while cement volumes were +10% with full-year low single-digit volume and pricing expectations.
  • Energy spike mitigation and hedging effectiveness: Management quantified energy as ~5% of total annual revenues and stated mature hedging covers on a rolling 9-month basis, providing visibility. Commercial teams protect margins via market-by-market cost recovery, and have begun targeted midyear price increases if uncertainty persists.
  • IIJA reauthorization timing and funding risk: Management cited ~50% of IIJA funds yet to be deployed and state proactive measures supporting demand. They expect bipartisan progress and anticipated passage in the second half of 2026; if continuing resolution occurs, record 2026 levels into 2027 still provide customer surety.

Sentiment: POSITIVE

Note: This summary was synthesized by AI from the CRH Q1 2026 earnings transcript. Financial data is complex; please verify all metrics against official SEC filings before making investment decisions.

Loading financial data and tables...
© 2026 Stock Market Info — CRH plc (CRH) Financial Profile