Carlisle Companies Incorporated

Carlisle Companies Incorporated (CSL) Market Cap

Carlisle Companies Incorporated has a market capitalization of $14B.

Price: $345.98

3.39 (0.99%)

Market Cap: 14.00B

NYSE · time unavailable

CEO: D. Christian Koch

Sector: Industrials

Industry: Construction

IPO Date: 2012-05-03

Website: https://www.carlisle.com

Carlisle Companies Incorporated (CSL) - Company Information

Market Cap: 14.00B|Sector: Industrials

Company Profile

Carlisle Companies Incorporated operates as a diversified manufacturer of engineered products in the United States, Europe, Asia, Canada, Mexico, the Middle East, Africa, and internationally. It operates through three segments: Carlisle Construction Materials, Carlisle Interconnect Technologies, and Carlisle Fluid Technologies. The Carlisle Construction Materials segment produces building envelopes for commercial, industrial, and residential buildings, including single-ply roofing products, rigid foam insulations, spray polyurethane foam, architectural metal products, heating, ventilation and air conditioning hardware and sealants, waterproofing products, and air and vapor barrier systems. The Carlisle Interconnect Technologies segment produces wires and cables, including optical fiber for the commercial aerospace, military and defense electronics, medical device, industrial, and test and measurement markets. It also offers sensors, connectors, contacts, cable assemblies, complex harnesses, racks, trays, and installation kits, as well as engineering and certification services. The Carlisle Fluid Technologies segment produces engineered liquid products, powder products, sealants and adhesives finishing equipment, and integrated system solutions for spraying, pumping, mixing, metering, and curing of coatings used in the automotive manufacture, general industrial, protective coating, wood, and specialty and automotive refinishing markets. The company sells its products under the Carlisle, Binks, DeVilbiss, Ransburg, BGK, MS Powder, Thermax, Tri-Star, LHi Technology, Providien, SynTec, Weatherbond, Hunter Panels, Resitrix, Hertalan, Insulfoam, and Versico brands. Carlisle Companies Incorporated was founded in 1917 and is headquartered in Scottsdale, Arizona.

Analyst Sentiment

72%
Strong Buy

From 9 Active Polls

1Y Forecast: $408.75

▲ +18.1% Potential Upside

Consensus Target Metrics

Low Bound

$360

Median

$425

High Bound

$425

Average

$409

Price & Moving Averages

Loading chart...

🎯 Wall Street Analyst Intelligence Report

1-Year structural target targets, chart projections, and sentiment maps.

Average 1Y Target
$408.75
▲ +18.14% Upside
Low Target
$360.00
4% Risk
Median Target
$425.00
23% Mid
High Target
$425.00
23% Max
Consensus
Buy
16 / 26 Buys

Consensus Trend Projection

Trailing closures vs. 12-month metrics map.

Analyst Vote Distribution

Aggregate institutional coverage sentiment weights.

📊 Historical Valuation Multiples

Real-time Trailing Twelve Month (TTM) momentum side-by-side with discrete quarterly metrics.

Fiscal QuarterTTMQ1 2026Q4 2025Q3 2025Q2 2025Q1 2025Q4 2024Q3 2024Q2 2024
Period EndingTrailing 12MMar 31, 2026Dec 31, 2025Sep 30, 2025Jun 30, 2025Mar 31, 2025Dec 31, 2024Sep 30, 2024Jun 30, 2024
Market Cap ($M)14,00013,61213,27413,98116,28015,08417,15120,64418,807
Enterprise Value ($M)16,11315,72415,04415,75518,10316,75418,38921,40319,361
Price to Earnings Ratio (P/E)19.4726.6526.0516.3215.9126.3226.3421.136.60
Price/Earnings-to-Growth Ratio (PEG)0.490.20
Price to Sales Ratio (P/S)2.8112.9411.7710.3811.2313.7715.2715.4812.96
Price to Book Ratio (P/B)8.548.237.397.027.686.966.967.476.26
Price to Free Cash Flow Ratio (P/FCF)15.14-186.4638.3535.5463.03-554.5651.3570.34118.66
Enterprise Value to Sales (EV/Sales)14.9513.3411.7012.4915.2916.3816.0513.35
Enterprise Value to EBITDA (EV/EBITDA)13.2668.8160.1545.1646.7570.5269.3155.6444.56
Debt to Equity Ratio1.741.741.601.450.890.870.810.830.76

CSL Growth Runway Model

Standard long term linear growth fade

Multi-Stage Discounted Cash Flow Sandbox

Market Price$345.98
Intrinsic Value$369.88
Market Alignment
Undervalued by 6.9%relative to calculated intrinsic value
9.00%
Exp: 0%0%
i

Growth runway slowdown

This value provides a time window for the growth rate to decline beyond Stage 1 toward the terminal rate. Longer windows are most useful for companies with high growth starting conditions or strong competitive advantages. This option stretches out the growth rate slowdown across 5, 10, or 15-year steps. A high-growth starting condition (exceeding a 25% initial growth rate) automatically applies a curve decay to simulate realistic, rapid market saturation.
i

Terminal growth rate

With long-term inflation between 3-5%, revenue must grow by that baseline to maintain flat real-world market share. This value sets the permanent terminal growth rate to factor into the valuation beyond the growth slowdown runway toward maturity.

3-Stage Financial Runway Horizon

🧠 Perpetuity Horizon Engine (Stage 3: Post-2035)

Terminal FCF Base$1.21B
Perpetuity TV Value$22.76B
Discounted TV (PV)$9.62B
TV Weighting %57.6%
⚠️
Financial Model Disclaimer & Risk Disclosure: This interactive scenario simulator is an educational sandbox provided strictly for informational and analytical research purposes. Core historical financial statements and consensus estimates are sourced directly via Financial Modeling Prep (FMP). All downstream outputs are entirely deterministic, hypothetical projections generated by combining automated mathematical formulas (including linear interpolation and Gaussian bell-curve decay models) with user-selected variables and third-party financial data inputs. Users assume all liability for trading decisions executed based on these sandbox calculations.

📘 Full Research Report

ℹ️

AI-Generated Research: This report is for informational purposes only.

```html

📘 CARLISLE COMPANIES INC (CSL) — Investment Overview

🧩 Business Model Overview

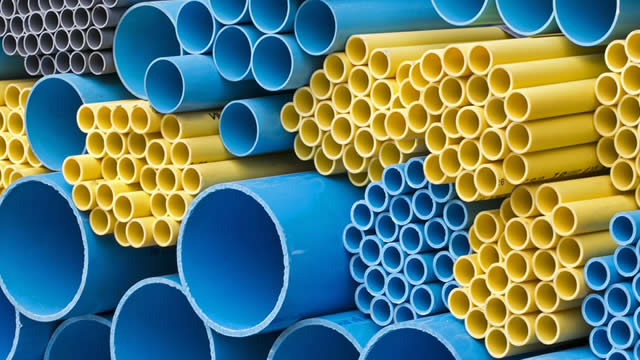
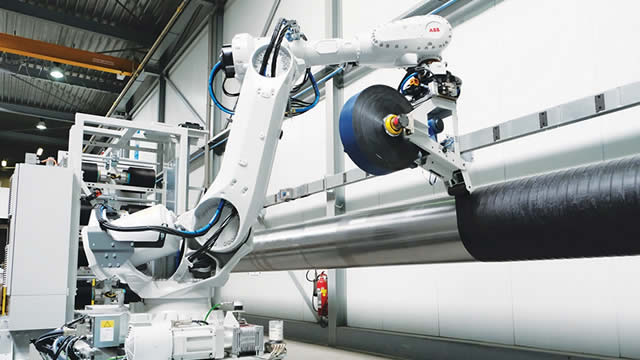
Carlisle Companies is an industrial manufacturer focused on engineered building-envelope and performance materials, with major exposure to non-residential roofing and related specialty applications, and additional engineered products used in industrial and infrastructure end markets. The business model centers on producing specification-grade systems (membranes, insulation, and specialty components) that are designed into construction projects and then supported through distribution channels and contractor/installer networks.

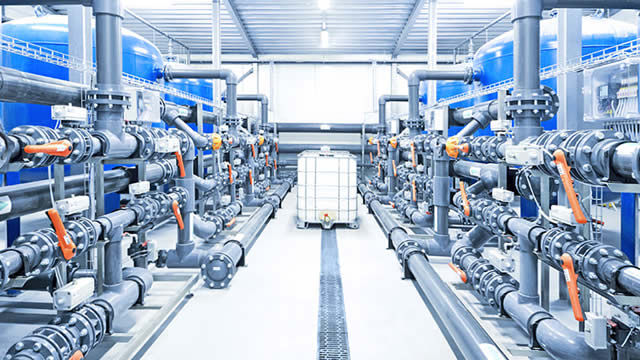
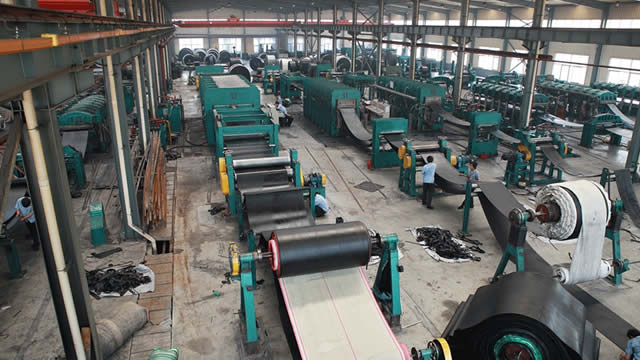
Value creation comes from (1) product engineering that enables performance in harsh environments (weathering, adhesion, heat resistance, chemical exposure), (2) approvals and compatibility with building codes and installation practices, and (3) supply continuity and manufacturing execution that keeps lead times and quality consistent for contractors and distributors.

💰 Revenue Streams & Monetisation Model

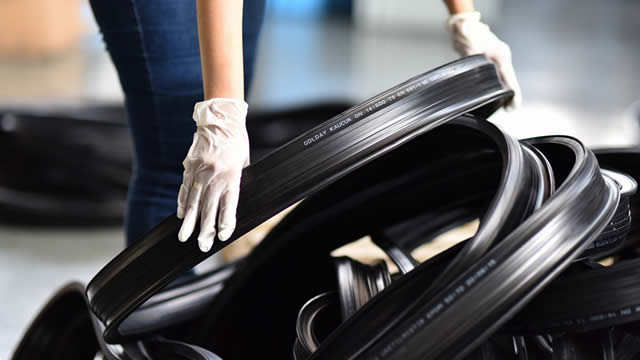
Revenue is primarily generated through the sale of manufactured building and specialty materials to roofing contractors, distributors, and other intermediaries tied to construction and replacement cycles. Monetisation is largely transactional (project/product sales), but durability and specification behavior create a quasi-recurring dynamic via:

  • Replacement/repair cycles: re-roofing and building envelope refurbishment drive repeat demand over time.
  • Specification-led stickiness: products that are engineered into roof designs and installation details tend to preserve share through subsequent bidding and maintenance cycles.
  • System economics: margin improves when the mix shifts toward higher-value systems/components and when manufacturing absorption is stable.

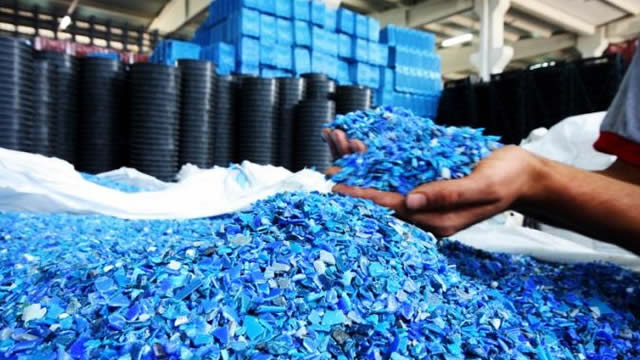
Primary margin drivers include input cost discipline (resins, polymers, reinforcing materials, energy), manufacturing throughput and scrap reduction, product mix (systems vs. commodities), and the ability to sustain price/mix during inflationary periods without losing specification positions.

🧠 Competitive Advantages & Market Positioning

Carlisle’s durability advantage is anchored in hard-to-replicate specification and approval-driven switching costs, supported by performance-proven formulations and installation know-how. While the end market is competitive, contractors, distributors, and specifiers tend to favor systems with documented performance, established compatibility, and consistent quality—reducing the willingness to switch suppliers midstream.

  • Switching Costs (Specification & Installation Compatibility): Roof systems are designed as engineered assemblies. Switching suppliers can require re-validation of details, training, and warranty/installation alignment.
  • Intangible Assets (Performance Track Record): Field performance and product engineering reduce perceived technical risk for specifiers and installers.
  • Operational Cost Advantage (Manufacturing Execution): Scale in key processing steps and disciplined cost management support resilience across construction cycles.

Competitive benchmarking: The competitive set spans large roofing and building-material suppliers such as GAF, Sika, and Johns Manville. These competitors vary by strength—some lean more heavily toward roofing systems and distribution reach, while others emphasize chemical/applications expertise and broader construction-admixture or specialty portfolios. Carlisle’s positioning is comparatively focused on performance membranes and engineered specialty materials where specification behavior and installation compatibility are central to demand capture.

🚀 Multi-Year Growth Drivers

Over a 5–10 year horizon, growth is supported by structural demand in building envelope efficiency, replacement activity, and engineered applications tied to infrastructure and industrial needs:

  • Roofing replacement and refurbishment: Non-residential roof systems experience recurring replacement due to aging assets, weather exposure, and lifecycle compliance requirements.
  • Energy-efficiency and sustainability standards: Building codes and sustainability targets support higher performance insulation and envelope solutions.
  • Commercial and industrial construction activity: Engineered building components benefit from discretionary infrastructure spending and long-lived commercial assets.
  • Infrastructure and environmental containment applications: Engineered products used in industrial and infrastructure settings benefit from ongoing needs for durable containment and long service life.
  • Share capture through product differentiation: Performance-led systems can win specifications when contractors seek reduced technical risk and predictable installation outcomes.

⚠ Risk Factors to Monitor

  • Construction cyclicality: Roofing and building-related demand is linked to new construction and refurbishment volumes, which can soften in downturns.
  • Input cost volatility: Resins, polymers, energy, and reinforcing materials can fluctuate, pressuring margins if pricing lags costs.
  • Regulatory and code changes: Building code updates, warranty requirements, and certification frameworks can alter system economics and qualification timelines.
  • Competitive pricing pressure: Larger peers with broader distribution or chemical portfolios can trade price for share during weaker demand periods.
  • Execution and capacity risks: Manufacturing quality, lead times, and capacity utilization materially affect margins in an industrial model.

📊 Valuation & Market View

The market typically values Carlisle as an industrial specialty manufacturer using EV/EBITDA and earnings multiples that reflect expected cycle normalization. Valuation sensitivity is driven by:

  • Durability of margins (mix, pricing power vs. input costs)
  • Organic growth trajectory (replacement intensity and specification wins)
  • Quality of earnings (cash conversion, working-capital discipline)
  • Resilience across cycles (ability to maintain throughput and manage overhead)

When investors perceive strengthening specification momentum and margin stability, multiples tend to expand; when construction demand weakens or input costs pressure gross margin, valuation typically compresses.

🔍 Investment Takeaway

Carlisle’s investment case rests on specification-driven switching costs, an engineered product portfolio with a strong performance track record, and disciplined manufacturing execution that can support margin resilience through construction cycles. The long-term thesis favors a company positioned to benefit from recurring building envelope refurbishment and efficiency-driven system upgrades, while limiting customer churn through technical compatibility and qualification dynamics.


⚠ AI-generated — informational only. Validate using filings before investing.

```

📰 Market News & Coverage

15 Stories Available

Real-time institutional reporting and market updates for CSL.

reuters.com2026-05-27

Australia says CSL unit Seqirus to discontinue Benpen injections from November

Australia's drug regulator ​said on Wednesday ‌it was notified by ​biopharmaceutical ​giant CSL's unit Seqirus ⁠that ​it will be ​discontinuing all strengths of their ​Benpen injection ​products progressively due ‌to ⁠commercial reasons.

fool.com2026-05-25

2 Building Materials Stocks That Are Quietly Becoming Some of the Market's Best Opportunities

Armstrong World Industries reported record sales in the first quarter. Carlisle Companies is just one year away from becoming a Dividend King.

seekingalpha.com2026-05-21

Future Dividend Kings - Part 1

The first list of 8 companies that could reach Dividend King status in coming years. These companies provide investors a wide range of starting dividend yields and growth histories. It's possible one or more of these companies do not attain Dividend King status.

gurufocus.com2026-05-15

Is Carlisle Companies Inc (CSL) a Bargain After 4.9% Drop? GF Value Says Undervalued

On May 15, 2026, Carlisle Companies Inc (CSL) shares fell 4.9%, closing at $332.49. The stock has experienced a 52-week high of $435.92 and a low of $293.43, re

247wallst.com2026-05-15

Don't Look Now, but 4 Blue-Chip Giants Could Be the Newest Dividend Kings

Companies that have raised dividends for shareholders for 50 years or more are the kinds of investments passive income investors need to own.

zacks.com2026-05-12

Implied Volatility Surging for Carlisle Companies Stock Options

Investors need to pay close attention to CSL stock based on the movements in the options market lately.

zacks.com2026-05-01

Carlisle (CSL) Recently Broke Out Above the 20-Day Moving Average

After reaching an important support level, Carlisle (CSL) could be a good stock pick from a technical perspective. CSL surpassed resistance at the 20-day moving average, suggesting a short-term bullish trend.

zacks.com2026-05-01

Carlisle (CSL) Just Reclaimed the 50-Day Moving Average

Carlisle (CSL) is looking like an interesting pick from a technical perspective, as the company reached a key level of support. Recently, CSL broke out above the 50-day moving average, suggesting a short-term bullish trend.

zacks.com2026-05-01

Carlisle (CSL) Recently Broke Out Above the 200-Day Moving Average

After reaching an important support level, Carlisle (CSL) could be a good stock pick from a technical perspective. CSL surpassed resistance at the 200-day moving average, suggesting a long-term bullish trend.

businesswire.com2026-04-30

Carlisle Companies Announces Fourth Employee Stock Option Grant Since 2009

SCOTTSDALE, Ariz.--(BUSINESS WIRE)--Carlisle Companies Incorporated (NYSE: CSL) today announced the issuance of an employee stock option grant to eligible employees as part of the company's ongoing commitment to broad‑based employee ownership and long‑term value creation. “Carlisle has a long track record of providing employee equity grants to recognize contributions, strengthen engagement, and reinforce shared accountability,” said Chris Koch, Chair, President and Chief Executive Officer. “Thi.

businesswire.com2026-04-28

Carlisle Companies Declares Regular Quarterly Dividend

SCOTTSDALE, Ariz.--(BUSINESS WIRE)--The Board of Directors of Carlisle Companies Incorporated (NYSE:CSL) has declared a dividend of $1.10 per share, payable on June 1, 2026, to shareholders of record at the close of business on May 18, 2026. About Carlisle Companies Incorporated Carlisle Companies Incorporated is a leading supplier of innovative building envelope products and solutions for more energy efficient buildings. Through its building products businesses – Carlisle Construction Material.

zacks.com2026-04-24

Carlisle Q1 Earnings Beat Estimates, Organic Revenues Decline Y/Y

CSL beats Q1 earnings estimates but misses on revenues as sales decline and key segments face weak demand despite modest margin gains.

seekingalpha.com2026-04-24

Carlisle Companies: Resilient In Challenging Sector Backdrop

Carlisle Companies Incorporated still faces a challenging macroeconomic backdrop. CSL's Q1 sales performance reflects macroeconomic weakness but also a transitory headwind from harsh winter weather. Positively, CSL's margins remain resilient, and the company sees a better sales outlook ahead. CSL's earnings also have been resilient.

seekingalpha.com2026-04-23

Carlisle Companies Incorporated (CSL) Q1 2026 Earnings Call Transcript

Carlisle Companies Incorporated (CSL) Q1 2026 Earnings Call Transcript

zacks.com2026-04-23

Compared to Estimates, Carlisle (CSL) Q1 Earnings: A Look at Key Metrics

Although the revenue and EPS for Carlisle (CSL) give a sense of how its business performed in the quarter ended March 2026, it might be worth considering how some key metrics compare with Wall Street estimates and the year-ago numbers.

📊 AI Financial Analysis

Powered by StockMarketInfo
Earnings Data: Q Ending 2026-03-31

"Q1 2026 results: Revenue of $1.052B and Net Income of $127.7M, translating to EPS of $3.12. YoY, Revenue rose about -3.9% (from $1.096B in Q1 2025) while Net Income declined about -10.8% (from $143.3M). QoQ, Revenue fell about -6.7% (vs. $1.128B in Q4 2025) and Net Income was roughly flat at +0.2% (vs. $127.4M). Profitability was pressured versus last year: net margin slipped to 12.1% (vs. 13.1% in Q1 2025) and operating margin to 17.1% (vs. 16.8%, slightly up), but the YoY bottom-line decline indicates higher below-operating costs/interest expense and/or tax effects. Over the 4-quarter span, gross margin trended down from the high end in Q2–Q3 2025 (near mid-to-high 30s) to 34.5% in Q1 2026. Cash flow quality weakened sharply in Q1 2026: operating cash flow was -$44.7M (vs. +$384.2M in Q4 2025) and free cash flow was -$73M, primarily reflecting working-capital outflows. Balance sheet resilience remains solid for a large pharma: total assets were $5.99B with equity at $1.65B, and interest coverage stayed healthy (~6.4x). Shareholder returns: CSL paid dividends (~$45.7M in the quarter) and continued meaningful buybacks ($250M). With only +3.9% 1y price change shown, total shareholder return is likely modest; the quarter did not indicate a strong momentum tailwind."

Revenue Growth

Caution

Q1 2026 Revenue was $1.052B, down ~6.7% QoQ (vs. $1.128B in Q4 2025) and down ~3.9% YoY (vs. $1.096B in Q1 2025).

Profitability

Fair

Net margin declined to 12.1% from 13.1% YoY, with Net Income down ~10.8% YoY. QoQ Net Income was essentially flat (+0.2%), suggesting less operating leverage than usual.

Cash Flow Quality

Neutral

Operating cash flow turned negative to -$44.7M in Q1 2026 (vs. +$384.2M in Q4 2025), driving free cash flow to -$73M. Working capital was a key drag (change in WC -$236.8M). Dividends continued ($45.7M) and buybacks remained large.

Leverage & Balance Sheet

Positive

Total assets were $5.99B and equity was $1.65B in Q1 2026. Leverage appears manageable with interest coverage ~6.4x and total debt $2.88B; equity declined vs. Q4 2025 ($1.80B), but the balance sheet remains solvent.

Shareholder Returns

Neutral

Cash returns via buybacks were substantial in the quarter (repurchases of ~$250M) alongside dividends (~$45.7M). However, market momentum is limited: 1y price change is only +3.9%, so total return is likely moderate.

Analyst Sentiment & Valuation

Caution

Price is $361.7 vs. consensus target ~$408.75 (upside implied ~13%). While valuation support exists, the latest earnings/cash flow softness tempers conviction.

Disclaimer:This analysis is AI-generated for informational purposes only. Accuracy is not guaranteed and this does not constitute financial advice.

Fundamentals Overview

Loading fundamentals overview...

CSL delivered a mixed Q1: revenue fell 4% to $1.1B, mainly from winter weather suppressing contractor roof-days and the absence of ~$15M tariff-driven Canadian pull-forward from 2025. However, execution drove profitability—adjusted EBITDA margin rose 50 bps to 22.3% and adjusted EPS grew 1% to $3.63, supported by COS productivity, procurement discipline, and selling/admin cost control, plus $250M of share repurchases. Segment performance diverged: CCM margin improved 30 bps to 27.4% (despite softer volumes), while CWT margin declined 40 bps to 15.2% due to mix and volume pressure, partially offset by footprint consolidation and insourcing (including Plasti-Fab EPS resin expansion). Management reaffirmed 2026 low single-digit revenue growth (now “higher end,” ~3%) and ~50 bps EBITDA margin expansion, with pricing actions (~5–8% second round) expected to neutralize raw inflation on a price-cost basis. Key open issue remains new construction softness and geopolitical-driven cost/visibility risk in 2H.

AI IconGrowth Catalysts

  • ThermaThin R-7 insulation momentum (launched at IRE; won 2 awards; deliveries starting ~July; positioned to improve R-value per inch for cold storage and reduce required roof insulation thickness)
  • Contractor install-time labor reduction offerings (FAST-like scan, Peel-and-Stick, Seam Shield) designed to help labor-constrained contractors install faster
  • Reroofing demand stability/low single-digit growth; commercial reroofing remains primary engine (~70% of commercial roofing business)

Business Development

  • Plasti-Fab: expansion of in-house expanded polystyrene resin production supporting CWT margin initiatives
  • Henry acquisition: integration path tied to CWT margin target (~20% close to prior expectations; ultimate 30% over time)
  • MTL acquisition: management characterized it as exceptional (share gains, new products, raw material volatility management)
  • QXO (distribution integration) improving; TopBuild industry activity viewed as limited direct impact (CSL position not in resi fiberglass insulation/shingles-heavy markets mentioned)
  • Beacon: significant presence in shingles cited as not a market CSL plays, limiting direct impact

AI IconFinancial Highlights

  • Revenue: $1.1B, down 4% YoY (winter weather limited roofing contractor days; absence of ~$15M tariff-related Canadian pull-forward from 2025; M&A partially offset)
  • Adjusted EPS: $3.63, up 1% YoY (repurchases more than offset lower organic earnings and higher interest expense)
  • Adjusted EBITDA margin: expanded 50 bps to 22.3% (despite volume pressure), attributed to COS-driven productivity, manufacturing efficiency, cost discipline, and selling/admin simplification
  • Segment margins: CCM EBITDA margin up 30 bps to 27.4% (CCM revenue down 5% YoY to $758M); CWT EBITDA margin down 40 bps to 15.2% (CWT revenue down 1% YoY to $294M)
  • Full-year outlook reaffirmed: low single-digit consolidated revenue growth, with revenue growth expected toward the higher end; ~50 bps full-year adjusted EBITDA margin expansion and double-digit EPS growth
  • Guidance for Q2 CCM profitability: approach ~31% EBITDA margin in Q2 (slightly >31% in Q3; ~28% in Q4); full-year CCM: ~50 bps improvement
  • Macro/price actions: mid-March announced price increases; effective mid-April; second price round announced at CCM 'today' (~5% to 8%); pricing expected to improve price-cost dynamics sequentially through 2026
  • Input cost/rate effects: weather estimated to impact ~3 days in Q1 (~$30–$35M top-line impact); oil-related petrochemical/freight pressures drove input uncertainty

AI IconCapital Funding

  • Cash & liquidity at 03/31/2026: $771M cash and cash equivalents; $1B available under revolving credit facility
  • Net debt/EBITDA: 1.7x (within target range 1–2x)
  • Capital return: $296M to shareholders in Q1 (share repurchases $250M; dividends $46M)
  • Annual repurchase pace: maintaining toward $1B repurchase target for 2026
  • Cash flow: operating cash flow used $45M in Q1; free cash flow used $73M (driven by $125M post-year-end settlement of accrued tax-related liability; excluding this payment, operating cash flow improved YoY)

AI IconStrategy & Ops

  • COS-driven productivity and cost discipline: manufacturing efficiency and selling/admin simplification cited as compounding over several quarters
  • CWT operational levers: automation, footprint consolidation, and insourcing; expanded polystyrene resin insourcing supporting margin trajectory
  • Real-time freight surcharges implemented in mid-March actions to accelerate recovery
  • Q1 order/momentum: improved orders as quarter progressed; exited March with better momentum than entered year; April activity encouraging with backlog conversion improving after weather disruptions
  • Warehouse/inventory improving: warehousing outlook up ~2% this year vs down 5% last year; Q4 destocking attributed to higher interest rates and weaker outlook

AI IconMarket Outlook

  • Full-year 2026: reaffirmed low single-digit revenue growth and ~50 bps adjusted EBITDA margin expansion
  • Revenue split logic: CCM expected low single-digit growth driven by higher prices and reroofing strength; CWT low single-digit growth driven by higher prices and share gain initiatives offsetting new construction softness
  • EPS: double-digit growth expected for 2026 (context: $40 adjusted EPS target under Vision 2030)
  • Q2 revenue seasonality (CWT): 27% of revenue typically in Q2; Q1 typically 23%, Q3 27%, Q4 23% (used for quarterly modeling)
  • Q2/into season guidance conservatism: management guided to low single digits at ~3% for 2026 entering Q2 due to geopolitical demand uncertainty; potential for better in second half acknowledged
  • ThermaThin impact timing: deliveries start around July; described as enthusiasm-building but not impacting Q1/Q2 growth

AI IconRisks & Headwinds

  • Winter weather delayed projects/shipments and reduced contractor roof-days (estimated ~3 days in Q1; ~$30–$35M top-line impact)
  • Tariff pull-forward not repeating: ~$15M headwind vs 2025 Q1 from Canadian customer order timing
  • New construction softness: higher-for-longer interest rates continue to weigh on residential and nonresidential construction; no near-term recovery assumed in full-year outlook
  • Geopolitical risk: elevated volatility cited for second half; heightened risks around Iran conflict and Strait of Hormuz affecting global energy markets
  • Raw material inflation uncertainty: MDI up double digits; benzene and petrochemicals linked; TPO resins up double digits (propylene index); polyols high single digits but sourcing optionality available
  • Project delay/deferral risk: potential delays from Middle East crisis and rate-cut expectations shift; supply availability could push work into next year
  • CWT margin pressure from mix: Q1 heavier foam side mix (lower margin than anticipated retail mix) dragging toward CWT targets

Q&A: Analyst Interest

  • Pricing stickiness and acceptance in a supply-driven shock: Management noted two price increases (March/April; first effective ~April 15), no retroactive action, and expected stickiness from clear line-of-sight drivers (oil/petrochemical derivatives, diesel/freight felt across fleets). They will watch through Q2 and manage via innovation and efficiency.
  • CWT margin path and timeline: Management set an annual goal near 20% and ultimate 30% over time, attributing progress to automation, footprint consolidation, and insourcing. They flagged Q1 mix drag from foam-heavy sales, provided quarter-by-quarter targets (Q2 ~19%, Q3 ~22%), and targeted at least 100 bps YoY CWT margin improvement.
  • Channel inventory normalization and distributor ordering: Management characterized inventory moving toward normal as construction season approaches, with Q4 destocking continuing into Q1 and a pickup in April as distributors increased willingness to carry inventory with improved ABI (~49.8). They said QXO integration is improving, with limited impact from TopBuild/Beacon due to CSL market exposure.

Sentiment: MIXED

Note: This summary was synthesized by AI from the CSL Q1 2026 earnings transcript. Financial data is complex; please verify all metrics against official SEC filings before making investment decisions.

📋 Official Regulatory 10-K / 10-Q SEC Filings

Direct authenticated documentation links to audited SEC database reports for CSL.

SEC EDGAR Live Feed
Loading financial data and tables...
📁

SEC Filings (CSL)

© 2026 Stock Market Info — Carlisle Companies Incorporated (CSL) Financial Profile